HAL Id: halshs-00151509
https://halshs.archives-ouvertes.fr/halshs-00151509
Submitted on 11 Oct 2007
HAL is a multi-disciplinary open access archive for the deposit and dissemination of sci-entific research documents, whether they are pub-lished or not. The documents may come from teaching and research institutions in France or abroad, or from public or private research centers.
L’archive ouverte pluridisciplinaire HAL, est destinée au dépôt et à la diffusion de documents scientifiques de niveau recherche, publiés ou non, émanant des établissements d’enseignement et de recherche français ou étrangers, des laboratoires publics ou privés.
Claude Meidinger, Jean-Louis Rullière, Marie Claire Villeval
To cite this version:
Claude Meidinger, Jean-Louis Rullière, Marie Claire Villeval. Free-riding and Fairness in Principal-Multi-Agent Relationships: Experimental Evidence. 2001. �halshs-00151509�
Économique
UMR 5824 du CNRS
DOCUMENTS DE TRAVAIL - WORKING PAPERS
W.P. 01-08
Free-Riding and Fairness in Principal – Multi-Agent
relationships:
Experimental Evidence
Claude Meidinger, Jean-Louis Rullière, Marie-Claire Villeval
2001
GATE Groupe d’Analyse et de Théorie Économique
UMR 5824 du CNRS
93 chemin des Mouilles – 69130 Écully – France
B.P. 167 – 69131 Écully Cedex
Tél. +33 (0)4 72 86 60 60 – Fax +33 (0)4 72 86 60 90
Messagerie électronique [email protected]
Free-Riding and Fairness in Principal – Multi-Agent relationships:
Experimental Evidence
Free-Riding et bienveillance dans la relation principal –
multi-agents : Evidence expérimentale
CLAUDE MEIDINGER*, JEAN-LOUIS RULLIERE** AND MARIE-CLAIRE
VILLEVAL**
Abstract: How do intrinsic motivations such as fairness and reciprocity influence the
efficiency of a principal – multi-agent relationship when joint production in a team is considered? Focusing on moral hazard in teams (Holmström, 1982), this paper reports the results of an experiment designed to determine whether principal’s fairness helps in reducing free-riding amongst team members. Two treatments were run, with reshuffling (stranger treatment) and without reshuffling (partner treatment). Experimental evidence shows that i) offers of fair contracts favor team cooperation in the stranger treatment, whereas ii) repeated interactions do not necessarily improve team cooperation. All the results of the partner treatment point to the difficulty of establishing a fruitful cooperation between principals and team members unequally motivated by genuine fairness considerations.
Keywords: Fairness, Experimental Economics, Principal-Agent Relationship, Team
Production.
JEL Classification: J33, C91, C92, D63
Résumé: Comment les motivations intrinsèques telles que la bienveillance et la
réciprocité influencent-elles l'efficience de la relation principal - multi-agents dans le travail en équipe? Cet article rapporte les résultats d'une expérience conçue pour déterminer si la bienveillance du principal vis-à-vis des agents permet de limiter le free-riding parmi les membres d’une équipe. Deux traitements ont été réalisés, l’un avec recomposition des appariements à chaque répétition (traitement de type « stranger ») et l’autre avec groupes fixes (traitement de type « partner »). Les résultats expérimentaux montrent que i) les offres de contrats équitables favorisent la coopération au sein de l’équipe dans le traitement « stranger », tandis que ii) les interactions répétées n'améliorent pas nécessairement la coopération en équipe. Tous les résultats du traitement « partner » montrent la difficulté à établir une coopération fructueuse entre le principal et les membres d’une équipe motivés à des degrés différents par des considérations de bienveillance.
Mots clés: équité, économie expérimentale, relation principal-agent, production en
équipe.
* TEAM, Maison des Sciences de l’Economie, 106-112 Bd. de l’Hôpital, F-75013 Paris (France)– Tel:+33 144 07 82 61 Fax: +33 144 07 82 47 [email protected]
** GATE, UMR CNRS n°5824, 93 Chemin des Mouilles, F-69130 Ecully (France) – Tel:+33 472 86 60 60 Fax: +33 472 86 60 90, [email protected], [email protected]
1. INTRODUCTION
What is the impact of intrinsic motivations such as fairness and reciprocity on the efficiency of the principal – multi-agent relationship ? The importance of vertical fairness in the interactions between a principal and an agent has been documented by many experimental studies; the principal pays higher wages than those required by the incentive constraint and the agent delivers a level of effort greater than the one theoretically predicted (Anderhub, Gächter, and Königstein, 1999; Fehr, Gächter and Kirchsteiger, 1997; Fehr, Kirchsteiger, and Riedl, 1998; Güth, Klose, Königstein and Schwalbach, 1998; Keser and Willinger, 2000).
These experimental results have been obtained in designing principal – agent games as a one-to-one relationship in which one principal faces one agent. However, in real life, most people are working within teams. Do these results hold when considering a principal – multi-agent relationship? As pointed out by Holmström in his seminal paper on moral hazard in teams (1982), a multi-agent setting is characterized both by an incentive for agents to free-ride in the context of joint production and by competition in controlling incentives, as agents play a non-cooperative game. An optimal allocation cannot be achieved as a Nash equilibrium with a binding budget balancing constraint (where the outcome is fully allocated to team members). A budget breaking rule, realized by introducing a principal as a residual claimant, can be efficiency-enhancing. The rule stipulates that the joint outcome will accrue to the principal in the event that the actual outcome has not reached the expected target level. Introducing a budget breaker would be more efficient than an active monitoring.
However, this punishment mechanism faces serious drawbacks. A problem of moral hazard on the part of the principal can be pointed out (Eswaran and Kotwal, 1984). With such a contractual arrangement, the third party has an incentive to bribe one team member to shirk and this clandestine deal results in a sub-optimal outcome. Rasmusen (1987) also shows that an all agent contract can still be efficient if workers are risk averse. Free-riding in a team can be eliminated by introducing a lottery in a “massacre contract” in
punished when an out-of-equilibrium outcome is achieved by the team. In contrast, Andolfatto and Nosal (1997) extend Holmström’s perspective in designing a contract in which delivering a payment to the principal even though the desired outcome has been achieved helps reducing the agents’ incentive to free-ride.
As far as principal-multi-agent relationships are considered, this paper intends to pursue this analysis by asking whether fairness and reciprocity help in reducing free-riding within a team. Our aim is not to design the more efficient payment scheme but to identify the influence of intrinsic motivations on the result of a principal – multi-agent relationship, beyond the respect of participation and incentive compatibility constraints. How do the proportion of the total revenue kept by the principal for himself (index of vertical fairness) and the threat of punishment (index of negative reciprocity) affect effort decisions within a team? Does vertical fairness favor solidarity amongst team members?
It should be noted that recent supporting evidence for horizontal fairness between agents has also been reported from experiments which consider either an all agent framework (Nalbantian and Schotter, 1997; Königstein and Tietz, 1998; Carpenter, 1999) or a principal – multi-agent framework (Rossi and Warglien, 1999; Güth, Königstein, Kovacs, and Zala-Mezo, 1999). In Güth and alii however, the authors do not really design a team but rather a collection of separate contracts between a unique principal and many agents. Experimental evidence of horizontal fairness is here delivered very indirectly, through the existence of less asymmetric contracts offered by the principal and through a lower dispersion of efforts when contracts are observable by all agents. Rossi and Warglien’s approach is closer to ours inasmuch as it investigates how principal’s fairness influences cooperation between two interdependent agents performing a production game. Our approach is however different. We consider heterogeneous agents and a threat of punishment by the principal.
Distinctively, this paper reports an experiment designed as a principal – multi-agent game in which a principal faces a team composed of two players with different productivity levels.
The principal first offers a contract that, in exchange of a non-binding desired outcome, specifies a team payment scheme (TPS-1) under which each agent receives an equal share. In such a scheme, because unequal production skills (i.e. unequal productivity) amongst agents depend on natural endowments such as talents, the principal asks each agent to provide a same effort. Despite their differences in talents, she pays them according to a scheme based on a collective ownership in talents (see Fleurbaey and Maniquet, 1999). Agents with different productivity levels but developing the same effort suggested by the principal will receive the same payoff.
The offer can be more or less generous, depending on both the share that the principal keeps for herself (either 25% or 50% of the outcome) and on the effort level suggested to achieve the desired outcome.
If the actual outcome is less than the desired one, the principal can decide whether she applies the previous TPS-1 or a second team payment scheme (TPS-2) under which wages are individualized according to productivity levels. In that case, each player bears a share of the TPS-2 implementation cost. This approach based on a private ownership of talents is substituted to the other one based on a collective ownership of talents.
With players only motivated by pecuniary incentives, it is obvious that the threat to apply TPS-2 is not credible. And because both agents develop a dominant free riding strategy under TPS-1, the outcome will be a non cooperative one. Things can nevertheless be different if players take into account fair behavior.
In real life as in many experiments, the willingness to be kind to others seems highly contingent on the behavior of others. People help those who are helping them and hurt those who are hurting them (Rabin, 1993). Clearly, such a behavior can entail some economic consequences both on vertical relationships (between the principal and the team) and on horizontal relationships (between team members). A generous contract offered by the principal in a framework of skill solidarity may, by reciprocity, induce cooperation within a team, as well as free riding in such a situation can trigger punishment. Intrinsic motivations
within team (solidarity, peer pressure or mutual monitoring) may have something to do with the success of cooperation (Kandel and Lazear, 1992).
This paper reports the results of two repeated game experiments with and without reshuffling that allow to study the impact of reciprocity and reputation in principal-multi-agent sequential move games. Two series of experiments were run, a stranger treatment (with reshuffling) and a partner treatment (without reshuffling). The stranger treatment serves as a benchmark for measuring the extent of genuinely reciprocal fairness (leading to non-strategic conditional behavior to reward kind acts and to punish unkind ones even if costly). The partner treatment leaves room for reputation building.
Experimental evidence shows that, in the stranger treatment, offers of fair contracts, some of them being equity-based, induce team cooperation, whereas offers of unfair contracts always induce team defection. This result is similar to those reported by Rossi and Warglien (1999). Despite the prediction that we should observe neither principal’s fairness nor team cooperation if subjects are only motivated by pecuniary considerations, team cooperation occurs in half of fair contracts. Therefore, vertical behavior influences horizontal behavior within a team. However, in opposition to many other experimental results, repeated interactions do not necessarily improve team cooperation. All the results of the partner treatment point to the difficulty to establish a fruitful cooperation between principals and team members unequally motivated by fairness considerations. In the partner treatment, vertical behavior also influences horizontal behavior, through notably the agents’ interpretation of intentions.
The remainder of this article is organized as follows. Section 2 develops the model and presents the general frame of the game, the four stages of the game, the standard strategic analysis of the game and its strategic analysis when reciprocal fairness is taken into account. Section 3 gives a brief presentation of the experimental design. Section 4 analyses the experimental results. A brief conclusion is given.
2. THE PRINCIPAL – MULTI-AGENT GAME
The game involves three players, a principal (player
X
) and a teamcomposed with two agents (players
Y
1 andY
2). These matched players have toshare an outcome whose amount depends on their decisions.
2.1. The general frame of the game
Let us first define
ρ
i ande
i as playerY
i’s productivity and effort levels,respectively, with
i
∈
{ }
1 2
,
. The resulting outcome is thenpy
=
p
(
ρ
1 1e
+
ρ
2 2e
)
,with
p
=
12
, the price of the output, andρ
1=
1
,ρ
2=
2
. That outcome has to bedivided according to a sharing scheme decided by the principal and which depends on both a parameter
θ
(that determines the principal’s share) and a team payment scheme (that determines the allocation of(
1
−
θ py
)
between theagents).
Two team payment schemes are available in the game.
q The first one, TPS-1, consists of a team payment scheme according to which each agent receives an equal share of the outcome whatever his productivity level. This solidarity scheme is based on the idea of a collective ownership in talents. The players’ shares are
θpy
for the principal and(
1
−
θ
)
py
/
2
foreach agent.
q The second one, TPS-2, is a productivity-based team payment scheme. This second scheme is based on the idea of a private ownership in talents. In that case, the implementation of individualization entails a cost
C
0 (withC
0 =48)that is subtracted from
py
before the sharing. The players’ shares areθ( py C
−
0) for the principal andj i i
C
py
ρ
ρ
ρ
θ
+
−
−
)(
)
1
(
0 for agenti
.In both TPS-1 and TPS-2, the principal’s payoff is equal to her outcome share and the agents’ payoffs are determined by subtracting from their outcome shares a personal cost of effort
C e
e
a
i i
( )
=
2experiments, we added 100 to these theoretical payoffs in order to avoid negative earnings.
The game therefore consists of the following elements.
The principal designs a labor contract and makes a “take it or leave it “ offer to the agents. The contract specifies a desired outcome that can be realized through a common non-binding level of effort
e
*
∈ =
E
{2, 4, 6, 8, 10, 12, 14, 16, 18,20, 22, 24} provided by each agent. It also specifies a value for
θ
, either equal to 0.5 or 0.25 which, once chosen, will be retained for both TPS. When the actual outcome, resulting from the agents’ efforts, equals at least the desired outcome, TPS-1 is applied. When that expected outcome has not been achieved, the principal can freely decide to apply either TPS-1 or TPS-2.In spite of the fact that
e *
is not binding, that level of effort isnevertheless indicated by the principal to her agents, as a kind of cheap talk.
2.2. The four stages of the game
q In the first stage, the principal indicates to the agents a common non-binding level of effort
e
*
∈
E
that determines a desired outcomeamounting to
py
*
=
pe
*
(
ρ
1+
ρ
2)
and chooses aθ
either equal to 0.25 or0.5.
q In the second stage, informed about the principal’s offer, each agent independently accepts or declines the offer. If at least one agent refuses the contract, the round is over and the players’ payoffs are null. If both agents accept, the third stage starts up.
q In the third stage, each agent
Y
freely and independently chooses inE
alevel of effort. This determines an outcome
py
=
p
(
ρ
1 1e
+
ρ
2 2e
)
to beshared.
q In the fourth stage, the principal is informed about the actual outcome
py
. Ifpy
≥
py
*
, she applies TPS-1. Otherwise, she can choose betweenenforcing TPS-1 or applying TPS-2, keeping the same value of
θ
in both cases.The four stages of the game are common knowledge for all players at the start of the game. Tables 1 to 12 in Appendix show the payoffs’ matrices for the two agents and the principal under TPS-1 and TPS-2.
2.3. The standard strategic analysis of the game
Because we avoid negative earnings, the participation constraint of a non-negative payoff for the agents is clearly satisfied. And if the two agents cooperate and follow the principal’s suggestion, a maximum common level of
e*
=
24
has to be required to maximize the principal's payoff. Under TPS-1, with25
.
0
=
θ
, that level of effort will also maximize the agents’ cooperation payoffsπ
icoop
, but not withθ
=
0 5
.
. In that sense, if the principal wants the agents tocooperate, she has to take into account an incentive compatibility constraint given by:
e
Arg
coop
e i
* ( )
θ
=
max
π
(1)We therefore have
e * ( . )
0 25
=
24
ande * ( . )
0 5
=
18
.But clearly, that will not be enough to ensure the agents’ cooperation. The principal must also take into account the possibility of using TPS-2 as a credible threat.
From the agents’ point of view, regardless of the TPS adopted, both of them have a dominant free riding strategy. These strategies are under TPS-1:
e
ifr=
a
(
1
−
)
p
i4
θ
ρ
(2) and under TPS-2:e
ifra
p
i i j=
−
+
(
1
)
2
2θ
ρ
ρ ρ
(3)In Tables 1 to 12 in Appendix, these strategies lead to the following effort values:
q With
θ
=
0 25
.
, under TPS-1:e
1fr=8 or 10 ande
2fr=
18
q With
θ
=
0 25
.
, under TPS-2:e
1fr=6 ande
2fr=
24
q With
θ
=
0 5
.
, under TPS-1:e
1fr=6 ande
2fr=
12
q With
θ
=
0 5
.
, under TPS-2,e
1fr=
4
ande
2fr=
16
.In one-shot games or in repeated games with reshuffling, with players only motivated by pecuniary incentives, the threat to apply TPS-2 is not credible. It follows that both agents have an incentive to free ride whatever the value of
θ
and will play their dominant free riding strategy under TPS-1. The predicted outcome will then be a free riding solution. Withθ
=
0
.
25
, payoffs willbe 282 for Y1 and 217 or 226 for Y2. With
θ
=
0 5
.
, payoffs will be 181 for Y1 and 154 for Y2. The principal’s payoffπ
p will be equal to 232 or 238 withθ
=
0 25
.
andequal to 280 with
θ
=
0 5
.
. Therefore, by backward induction, the principal’s bestchoice is to select
θ
=
0 5
.
in the first stage of the game and not to apply TPS-2 aftera deviation in the fourth stage.
In repeated games without reshuffling, is there any interest for the principal to build a reputation of toughness ?
For
θ
=
0 25
.
, both agents get a payoff of 280 if they cooperate by achievingthe effort level of
e*
=
24
suggested by the principal. When TPS-2 is consideredas a credible threat, an agent that defects has to play his free riding strategy under TPS-2. With such a strategy, Y1 cannot hope to get more than a payoff of 241 when free-riding under TPS-2 and therefore has an interest to cooperate if he expects Y2 will cooperate. But confronted with a cooperative Y1, Y2 has an interest to trigger TPS-2. By playing e2=22, he will get a payoff of 363. Knowing that, Y1 will not cooperate and the outcome will then be the free riding solution under TPS-2 with a principal’s payoff of 250.
For
θ
=
0 5
.
, and thereforee*
=
18
, both agents get a payoff of 181 if theyachieve the required effort level. But here too, it is clear that agent
Y
2 has anincentive to trigger TPS-2 if he conjectures that
Y
1cooperates. By playing his181. Knowing that, agent
Y
1 will not cooperate and the outcome will be the freeriding solution under TPS-2,
e
1fr=
4
ande
2fr=
16
, with payoffs of 160 for Y1 , 164 for Y2 and 292 for the principal.Therefore, in a repeated game without reshuffling, the principal’s best
choice is to select
θ
=
0 5
.
in the first stage of the game and to apply TPS-2 after adeviation in the fourth stage.
2.4. The introduction of fairness considerations
It is clear that some contracts can be considered as being fair. With
25
.
0
=
θ
ande*
=
24
for example, the principal is going to accept a reducedpayoff of 316, instead of a payoff of 424 she can expect by asking for
e*
=
18
withθ
=
0 5
.
. She also offers the agents the opportunity to get an increased payoff of280 if they cooperate, to be compared to the payoff of 181 they could get with
θ
=
0 5
.
ande*
=
18
. It is also clear that among fair contracts (θ
=
0
.
25
), some ofthem can also be considered as being equity-based. With a suggested level of effort
e
≤
18
, each employee’s payoff is equal to or greater than the principal’spayoff. Such a vertical fairness may induce agents to cooperate. It may also motivate the principal to apply the TPS-2 threat (negative reciprocity) in order to punish the agents for not responding positively to her kindness even in a one-shot game.
One should also note that with
θ
=
0 5
.
, because the principal’s payoff isalways greater than the agent’s payoffs for any suggested level of effort, there can be no equity-based contracts. But there can be unfair contracts with a level of suggested effort above the one determined by the incentive compatibility constraint. For
e
>
18
, the principal tries to reinforce her first mover advantageby using cheap talk to suggest a high level of effort.
From that point of view, it seems that vertical fairness may lead to a more fruitful interpretation of observed behavior.
In one-shot games or repeated games with reshuffling, because reputation is ruled out by design, any contract with
θ
=
0 25
.
may be interpreted as acontract offered by a principal motivated by fairness considerations. A look at the principal’s strategy may also allow to distinguish principals playing fair only for strategic reasons from principals genuinely motivated by fairness. Only the latter will punish agents for not responding kindly to a fair offer.
In repeated games without reshuffling, where there is scope for reputation building, two different types of principals must be distinguished.
q On the one hand, greedy principals trying to maximize their payoffs with
θ
=
0 5
.
through a toughness reputation that destroys teamcooperation. With TPS-2 credible, Y2 will defect, the punishment will
be applied and
π
p=
292
(better than 280 obtained withoutpunishment for
θ
=
0
.
5
).q On the other hand, genuinely kind principals trying to enforce cooperation through fair offers with a maximum payoff of
π
p=
316
. Itshould be noted that vertical fairness will usually not work without something that could be related to fair behavior among team members. Without punishment, Y1 has a strong incentive to free ride (under TPS-1, he is offered half of the team’s payoff despite his lower productivity and he will get a free riding payoff greater than
Y
2’spayoff). With punishment, Y2 has the same incentive. It is also worth noting here that greedy principals have interest to mimic genuinely kind principals if they consider that fairness can be an efficient means to increase their payoff.
3. EXPERIMENTAL DESIGN
The experiments were performed in November 1999 at the University of Lyon. They were run in a computerized way with Regate as experimental software. Subjects were drawn from the undergraduate population at the Management School of Lyon and no subject was experienced. Before the
experiment started, written instructions were distributed to the participants and read aloud. A pre-experimental questionnaire was distributed in order to check whether the rules of the game were fully understood. The payoffs functions and the productivity distribution are common knowledge. Tables were distributed to participants indicating the principal’s and each employee’s payoffs according to the individual effort levels, for each sharing rule (TPS-1 and TPS-2) and each value of the
θ
parameter (see Appendix).12 subjects participated in a session (4 groups of 3 subjects for each period). 4 sessions were organized (3 sessions with 4 groups and 1 session with 3 groups). It gives 15 groups of observations. Each subject was randomly assigned either the role of a principal (player
X
), or the role of an employee with a low(player
Y
1) or a high productivity (playerY
2). In each period, each principal ismatched with two heterogeneous employees. Two treatments were run.
q A first series of sessions consisted of a “stranger treatment” (7 groups). Each subject played 15 rounds of the game in the same role but he could be matched with different players all along the session. The matching of a principal with two agents was determined randomly each period. This treatment excludes repeated game effects. q A second series of sessions consisted of a “partner treatment” (8 groups) without reshuffling. In this case, each subject played 15 rounds of the game, staying in the same role and matched with the same two other players all along the session. This treatment enables to observe reputation effects and the principal’s will to build a toughness reputation.
Each session started with 5 trial periods (which the results were not taken into account for analyses and payments) in order to help players to get accustomed with the rules of the game.
In each period, employees are informed of the level of effort suggested by the principal, *
scheme which will be actually implemented (TPS-1 or TPS-2). In each period, the principal is informed of the acceptance or rejection of the contract, and of the size of the actual outcome. Each player in each period is also informed of the payoffs received by the two other players with which he is playing. This ended the period. During the experiment, each player could see on the upper half of his or her computer screen a table showing his or her decisions and results in all previous rounds of the game.
At the end of the session, each player was paid his or her average net payoff in the 15 rounds in French Francs according to the conversion rate 1 ECU= 0,4 FF. A showing up fee of 20 FF was added.
IV – EXPERIMENTAL EVIDENCE
The total number of contracts offered by the principals is 105 in the stranger treatment (ST) and 120 in the partner treatment (PT). Let us consider successively these two treatments.
4.1. The stranger treatment
Contracts: 26 contracts (25%) are fair (
θ
=0.25) and, among them, 18 contracts are equity-based. Out of the 79 remaining contracts withθ
=0.5, 33 contracts (42%) are unfair. A one-tailed binomial test leads, under the normal distribution approximation, to the rejection of the hypothesis H0 (no difference between the probabilities of choosingθ
=
0
.
5
orθ
=
0
.
25
) at a significance levelof 0.005, and to the acceptance of a greater probability to choose
θ
=
0
.
5
.Due to the binding participation constraint, all contracts offered should be accepted since they offer payoffs strictly greater than zero. All contracts offered with
θ
=0.25 are accepted and 4 contracts withθ
=0.5 are rejected. This yields a total of 101 contracts accepted.The distribution of the effort values e according to the different values of
Contracts offered - ST 0 5 10 15 20 2 4 6 8 10 12 14 16 18 20 22 24 e 0,25 0,5
Figure 1. Distribution of offers according to the value of theta and the suggested effort level (e) in the stranger treatment
With
θ
=0.25, e should be equal to 24 but in fact, only 19% of the contracts respect this incentive compatibility constraint. 81% of the contracts suggest a lower level of effort.With
θ
=0.5, 14% of the contracts respect the incentive compatibility constraint (e=18). 42% of offers suggest a level of effort higher than the incentive compatibility constraint (unfair offers).Team cooperation: defined as the respect by both agents of the suggested effort level, it should be noted that team cooperation is weak (21% of accepted contracts) (see Table 1).
Suggested effort (e) # cases 2 4 6 8 10 12 14 16 18 20 22 24 Total
=
θ
0.25 Accepted contracts Team cooperation 2 1 6 6 1 1 4 2 2 1 1 0 2 0 3 1 5 1 26 13=
θ
0.5 Accepted contracts Team cooperation 2 2 2 1 5 2 8 1 4 0 5 0 7 1 11 1 9 0 7 0 15 0 75 8Team cooperation is observed in 50% of accepted contracts with
θ
=0.25 but only in 11% of contracts withθ
=0.5. Unfair contracts (θ
=0.5 and e>18) never induce team cooperation. By contrast, equity-based contracts (θ
=0.25 ande
≤
18) usually support team cooperation. Therefore, with a broader fairness concept including equity considerations, it seems here that principal’s fairness helps in reducing free-riding within the team (positive reciprocity).If one looks now at the individual agent behavior, one should note that the rates of defection increase with the value of e and are generally greater for
θ
=0.5 than forθ
=0.25. Whenθ
=0.25, the less (more) productive agent defects in 38.5% (42.3%) of the contracts. Whenθ
=0.5, the less (more) productive agent defects in 73.3% (70.7%) of the contracts. For both values ofθ
, aχ
2test (at alevel of significance of 0.60) leads to the acceptation of equal frequencies of defection for agents Y1 and Y2 (
χ
2= 0.3252 forθ
=0.25 and 0.2198 forθ
=0.5).Punishment: in the stranger treatment, a principal motivated only by pecuniary considerations should never apply punishment (TPS-2). The experimental evidence shows that punishment has been applied in 13 cases out of 80 group defections (16.2%) and just once with
θ
=0.25 (negative reciprocity). One should point out that punishment, applied in 6 of the unfair contracts, reinforces in those cases the principal’s meanness. The evidence therefore mostly points to principals either playing fair for strategic reasons or trying to maximize their payoffs through a first mover advantage withθ
=0.5.Payoffs: As displayed by Table 2, fair contracts produce more efficient results. The average size of the pie is greater for
θ
=0.25 than forθ
=0.5. Equity-based contracts are not however more efficient than this average. By contrast, by suggesting high efforts, unfair contracts somehow succeed in achieving an amount to be shared greater than the average one obtained whenθ
=0.5.Nature of
contracts Average size of the pie Principal’s payoff productive Less agent’s payoff More productive agent’s payoff All contracts 708.2 265.0 173.0 170.2 Contracts
with
θ
=0.25 824.3 230.6 242.9 228.6 Equity-based contracts 812.0 228.0 240.9 226.1 Contracts withθ
=0.5 670.0 276.3 149.9 151.1 Unfair contracts 713.1 296.1 159.9 150.2Table 2. Average payoffs in the stranger treatment
Fair contracts (including equity-based ones) produce a quasi-equal pie sharing among the three players, with a small advantage to the less productive agent. As a matter of fact, the principal gets her worse payoff when she offers equity-based contracts and her best payoff when she offers unfair contracts. But for both agents, the payoff gap between these two kinds of contracts is larger by far.
4.2. The partner treatment
Contracts: 8 groups have played the partner treatment, giving 8 series of independent observations (120 contracts offered).
39 contracts (33%) are fair (
θ
=0.25) and among them, 22 contracts are equity-based (e≤
18).Only 38% of the 39 contracts respect the incentive compatibility constraint.In the 81 remaining contracts with
θ
=
0
.
5
, only 5% respect the incentivecompatibility constraint. 31 contracts (38%) are unfair
(
e
>
18
)
.In spite of the fact that the proportion of contracts offered with
θ
=0.25 is greater in the partner treatment (33%) than in the stranger treatment (25%), it should be noted here that aχ
2 (corrected for continuity) leads to theacceptation of equal frequencies of both types of contracts in both populations (
χ
2=
1
,
58
with a probability of 0.20). This may point to the fact that greedyfirst round of the repeated game (t=1) and the last round (t=15) shows no significant difference (at a level of 0.70) between the two populations.
However, it seems that most contracts with
θ
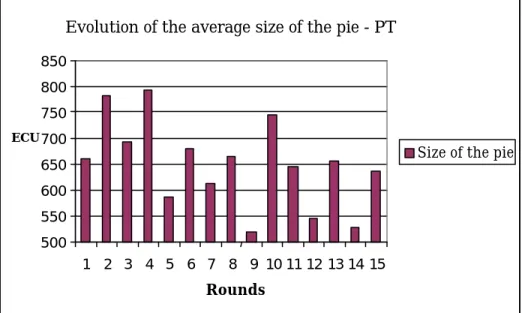
=0.25 cannot be interpreted as a sign of principal’s fairness. Unlike the stranger treatment, in the partner treatment one should look at the evolution of proposed contracts over time to appreciate fairness intentions.A look at Figures 2 and 3 below shows that only three principals out of eight start the repeated game by offering fair contracts and that most of the fair contracts are proposed at rounds 10 and 11 (Figure 2), just after a sharp decline of the average size of the pie at round 9 (Figure 3).
Evolution of contracts offered - PT
0 1 2 3 4 5 6 7 8 1 2 3 4 5 6 7 8 9 10 11 12 13 14 15 Rounds # contracts Theta=0.25 Theta=0.5
Figure 2. Evolution of the value of theta over time in the partner treatment
Evolution of the average size of the pie - PT
500 550 600 650 700 750 800 850 1 2 3 4 5 6 7 8 9 10 11 12 13 14 15 Rounds ECU
Size of the pie
Figure 3. Evolution of the average size of the pie in the partner treatment
These observations therefore seem to point to the fact that most principals do not care about fairness. They try to enforce cooperation with
θ
=0.5 and worry about the shrinking size of the pie, just around the middle of the game, due to the offer of unfair contracts (from rounds 6 to 9, unfair contracts represent 46% of contracts withθ
=0.5, and more than one third of the total contracts offered). But even though fair contracts offered at round 10 help to increase the average size of the pie, they are nevertheless proposed too late to be considered as a sign of trustful cooperation. Consequently, at the end of the game (rounds 12 to 15), the proportion of fair contracts collapses and the value of e increases, a classical effect of end game.Finally, a total of 108 contracts have then been accepted. But just note that if, in the partner treatment as in the stranger treatment, all contracts offered with
θ
=0.25 are accepted, a smaller proportion of contracts offered withθ
=0.5 are here accepted (81.5% versus 95% in the stranger treatment). This has something to do with the strategies of some agents that use contract rejection not only as a punishment device but also as an incentive one.(see Table 3). A
χ
2test rejects the null hypothesis at a level of α=0.01 forθ
=0.25and at a level of α=0.15 for
θ
=0.5. Only associated with low levels of suggested effort (e<10 withθ
=0.25 and e<12 withθ
=0.5), team cooperation is indeed never achieved with unfair contracts.Suggested effort (e) # cases 2 4 6 8 10 12 14 16 18 20 22 24 Total
θ
=0.25 Accepted contracts Team cooperation 2 2 1 1 2 0 12 0 3 0 1 0 1 0 2 0 15 0 39 3θ
=0.5 Accepted contracts Team cooperation 5 5 5 4 4 3 4 1 5 1 6 0 0 9 1 0 3 0 5 0 7 0 15 0 69 14Table 3. The extent of team cooperation in the partner treatment
Such a lack of team cooperation is explained by most of the principals’ behavior, trying to enforce cooperation with
θ
=0.5 at the beginning of the game. Generally not considered as a sign of trustful cooperation, only 3 out of the 39 proposed fair contracts lead to team cooperation.Coordination failures and payoffs: Table 4 displays the distribution of groups’ payoffs. A look at subjects’ behavior in some groups illustrates the difficulties to achieve coordination. Two particular groups are here chosen : Group 1 which exhibits a failure of coordination with a genuinely kind principal and Group 3 that exhibit the same failure with a greedy principal.
Group Average suggested effort Frequency of theta=0.25 Frequency of punishment Average Y1’s effort Average Y2’s effort Average pie Average principal’s payoff Average Y1’s payoff Average Y2’s payoff All con- tracts 15.2 39 22 7.7 12.3 650 226 172 156 1 18.8 8 2 12.4 10 585 159 121 152 2 14.7 1 3 8 9 591 224 144 153
3 18 1 5 8.9 14 743 305 177 167 4 21.7 4 3 5.8 17.2 686 230 175 141 5 7.2 3 2 7.9 12.5 695 274 221 165 6 12.3 14 2 4.5 14.8 710 205 239 184 7 12 2 1 5.8 7.5 500 162 128 121 8 17.3 6 4 9.3 12.7 689 245 174 167
Table 4. Distribution of payoffs in groups
q Let us first consider Group 1, the worst but one in terms of average pie. Figure 4 displays subjects’ behavior.
Over the five first rounds, two out of the three subjects (the principal and agent Y1) try to set up a coordination on
θ
=0.25 and e=24. But agent Y2 defects by playing a low level of effort. Such a behavior triggers a retaliation war. It is interesting here to note that such a war takes place precisely between those two subjects that first agree on coordination. At round 5, partly for inciting the other agent to raise his contribution, Y1 defects (horizontal punishment). The principal retaliates by proposing an unfair contract in the next two rounds (vertical punishment) and this leads Y1 to reject both offers. Afterwards, fair offers cannot prevent Y1 to defect, then to reject the proposed contracts withθ
=0.5 at rounds 13 and 14. Finally, the principal enforces punishment in the last round.Evolution of suggested and individual effort levels - Group 1
0 5 10 15 20 25 30 1 2 3 4 5 6 7 8 9 10 11 12 13 14 15 Rounds 0 0,1 0,2 0,3 0,4 0,5 0,6 e e1 e2 Theta
Figure 4. Evolution of subjects’ behavior in Group 1
q By contrast, let us consider Group 3, which achieved the best average pie (Figure 5).
Efficiency can be here explained by a generalized lack of reciprocity concern. First of all, except at round 10, it should be noted that the greedy principal ever uses her first mover advantage by choosing
θ
=0.5 and suggesting on the average a high level of effort (9 unfair contracts over 15 rounds).Evolution of suggested and individual effort levels - Group 3
0 5 10 15 20 25 30 1 2 3 4 5 6 7 8 9 10 11 12 13 14 15 Rounds 0 0,1 0,2 0,3 0,4 0,5 0,6 e e1 e2 Theta
In addition, she mostly enforces punishment (at rounds 3, 4, 6, 11 and 15) with unfair contracts (4 out of 5 cases of punishment enforcement). One should note more generally that this strategy is also observed in other groups. In the aggregate, punishment is applied in 37% of unfair contracts, in 18% of other contracts with
θ
=0.5. In that group, agents do not seem to bother about reciprocation. There is no contract rejection despite the number of unfair contracts; agent Y1 free rides (and he continues to do so even after a punishment) on the high productivity of agent Y2 who, in turn, tries not to get a reduced payoff by choosing on the average a level of effort greater than Y1’s one.V. CONCLUSION
Much experimental evidence has established, on the one hand, the importance of incentive to free-ride in groups and, on the other hand, the extent of fairness and reciprocity in one principal – one agent relationships. Distinctively, this paper considers a principal – multi-agent relationship and tries to determine whether principal’s fairness helps in limiting the extent of free-riding within a team.
Two repeated game experiments have been run that help to study how team cooperation and free-riding develop in principal – multi-agent sequential move games. Experimental evidence shows that vertical fairness favors horizontal fairness between agents and thus efficiency in the stranger treatment. However, a repeated interaction between same subjects need not improve team cooperation.
One should first note that the results of our partner treatment are close to the evidence displayed by public goods experiments on individual behavior within groups. In such experiments, the level of individual contributions to the funding of a public goods declines over time to the free-riding equilibrium, mainly due to the coexistence of free-riders and conditional cooperators. However, when a punishment device is introduced in such experiments, individual contributions raise over time and converge progressively to the greatest possible level of contribution (Fehr and Gächter, 1999). Distinctively, in
cooperation, because of its asymmetric nature. There is no explicit horizontal punishment mechanism enabling a mutual monitoring within the team and the vertical mechanism that should favor team cooperation is not efficient in a repeated interaction because of its asymmetry: When the threat is credible, the more productive agent has an interest in free-riding in order to trigger the punishment and, thus, to increase his payoff.
One should also note that less cooperation is observed here than in a one principal – one agent framework because of the incentives to free-ride in a team production process. One of our main results is that a fruitful and long-lasting cooperation between principal and team-mates is all the more difficult to achieve with people differently motivated by fairness. Team cooperation occurs in our experiment if and only if two conditions are met. First, team cooperation requires that the principal offers a fair contract and does not apply the punishment that could trigger the more productive agent’s free-riding. Second, team cooperation implies that the more productive agent should accept the equal sharing TPS in spite of his higher contribution to the outcome. In such a way, cooperation is more demanding since fairness must develop between agents and not only between one principal and one agent. In such an asymmetric principal – multi-agent relationship, the lack of cooperation in repeated interactions is due to the fact that selfish considerations easily dominate fairness.
REFERENCES
Anderhub, Vital, Simon Gächter, and Manfred Königstein, “Efficient Contracting and Fair Play in a Simple Principal-Agent Experiment”, Humboldt University and University of Zurich, mimeo, 1999.
Andolfatto, David, and Ed Nosal, “Optimal Team Contracts”, Canadian Journal of Economics, XXX, 2 (1997), 385-396.
Carpenter, Jeffrey P., “Mutual Monitoring in Teams: Theory and Experimental Evidence ”, Middlebury College, mimeo, 1999.
Eswaran, Mukesh, and Ashok Kotwal, “The Moral Hazard of Budget-Breaking”, Rand Journal
of Economics, 15, 4 (1984), 578-581.
Fehr, Ernst, Simon Gächter, and Georg Kirchsteiger, “Reciprocity as a Contract Enforcement Device: Experimental Evidence”, Econometrica, 65 (1997), 833-860.
Fehr, Ernst, Georg Kirchsteiger, and Arno Riedl, “Gift Exchange and Reciprocity in Competitive Experimental Markets”, European Economic Review, 42 (1998), 1-34. Fehr, Ernst, and Simon Gächter, “Cooperation and Punishment in Public Goods
Experiments”, Institute for Empirical Research in Economics, University of Zurich, Working Paper Series, 10, June 1999.
Fleurbaey, Marc, and François Maniquet, “Cooperative Production with Unequal Skills: The Solidarity Approach to Compensation”, Social Choice and Welfare, 16 (1999), 569-583.
Gächter, Simon, and Armin Falk, “Reputation or Reciprocity”, Institute for Empirical Economic Research, University of Zurich, mimeo, 1997.
Güth, Werner, Wolfgang Klose, Manfred Königstein, and Joachim Schwalbach, “An Experimental Study of a Dynamic Principal-Agent Relationship”, Managerial and
Decision Economics, 19 (1998), 327-341.
Güth, Werner, Manfred Königstein, Judit Kovacs, and Eniko Zala-Mezo, “Discriminating Incentive Schemes in one Principal-Multiple Agents-Situations: A Theoretical and Experimental Analysis”, Humbold University and Kossut University, mimeo, 1999. Holmström, Bengt, “Moral Hazard in Teams”, Bell Journal of Economics, 13, 2 (1982), 324-339.
Isaac R.Mark, and James M. Walker, “Nash as an Organizing Principle in the Voluntary Provision of Public Goods: Experimental Evidence”, Experimental Economics, 1 (1998), 191-206.
Kandel Eugene, and Edward P. Lazear, “Peer Pressure and Partnerships”, Journal of Political
Economy, 100, 4 (1992), 801-817.
Keser Claudia, and Marc Willinger, “Principal’s Principles when Agents’ Actions are Hidden”,
International Journal of Industrial Organization, 18 (2000), 163-185.
Königstein, Manfred, and Reinhard Tietz, “Profit Sharing in an Asymmetric Bargaining Game”, Humboldt University Discussion Paper, 127, 1998.
Nalbantian, Haig R., and Andrew Schotter, « Productivity under Group Incentives: An Experimental Study”, American Economic Review, 87 (1997), 314-341.
Rabin, Matthew, “Incorporating Fairness into Game Theory and Economics”, American
Economic Review, 83, (1993), 1281-1302.
Rasmusen, Eric, “Moral Hazard in Risk-Averse Teams”, Rand Journal of Economics, 18, 3 (1987), 428-435.
Rossi, Alessandro, and Massimo Warglien, “Fairness in Hierarchical Triangles: An Experimental Study”, University of Trento, Rock Working paper, 1999.
APPENDIX
SHARING RULE : TPS-1 A1-
θ
=
0
.
25
Table 1 – Player Y1’s payoffs Effort Y2 Y1 2 4 6 8 10 12 14 16 18 20 22 24 2 126 144 162 180 198 216 234 252 270 288 306 324 4 132 150 168 186 204 222 240 258 276 294 312 330 6 136 154 172 190 208 226 244 262 280 298 316 334 8 138 156 174 192 210 228 246 264 282 300 318 336 10 138 156 174 192 210 228 246 264 282 300 318 336 12 136 154 172 190 208 226 244 262 280 298 316 334 14 132 150 168 186 204 222 240 258 276 294 312 330 16 126 144 162 180 198 216 234 252 270 288 306 324 18 118 136 154 172 190 208 226 244 262 280 298 316 20 108 126 144 162 180 198 216 234 252 270 288 306 22 96 114 132 150 168 186 204 222 240 258 276 294 24 82 100 118 136 154 172 190 208 226 244 262 280
Table 2 – Player Y2’s payoffs Effort Y2 Y1 2 4 6 8 10 12 14 16 18 20 22 24 2 126 141 154 165 174 181 186 189 190 189 186 181 4 135 150 163 174 183 190 195 198 199 198 195 190 6 144 159 172 183 192 199 204 207 208 207 204 199 8 153 168 181 192 201 208 213 216 217 216 213 208 10 162 177 190 201 210 217 222 225 226 225 222 217 12 171 186 199 210 219 226 231 234 235 234 231 226 14 180 195 208 219 228 235 240 243 244 243 240 235 16 189 204 217 228 237 244 249 252 253 252 249 244 18 198 213 226 237 246 253 258 261 262 261 258 253 20 207 222 235 246 255 262 267 270 271 270 267 262 22 216 231 244 255 264 271 276 279 280 279 276 271
Table 3 - Player X’s payoffs Effort Y2 Y1 2 4 6 8 10 12 14 16 18 20 22 24 2 118 130 142 154 166 178 190 202 214 226 238 250 4 124 136 148 160 172 184 196 208 220 232 244 256 6 130 142 154 166 178 190 202 214 226 238 250 262 8 136 148 160 172 184 196 208 220 232 244 256 268 10 142 154 166 178 190 202 214 226 238 250 262 274 12 148 160 172 184 196 208 220 232 244 256 268 280 14 154 166 178 190 202 214 226 238 250 262 274 286 16 160 172 184 196 208 220 232 244 256 268 280 292 18 166 178 190 202 214 226 238 250 262 274 286 298 20 172 184 196 208 220 232 244 256 268 280 292 304 22 178 190 202 214 226 238 250 262 274 286 298 310 24 184 196 208 220 232 244 256 268 280 292 304 316 A2-
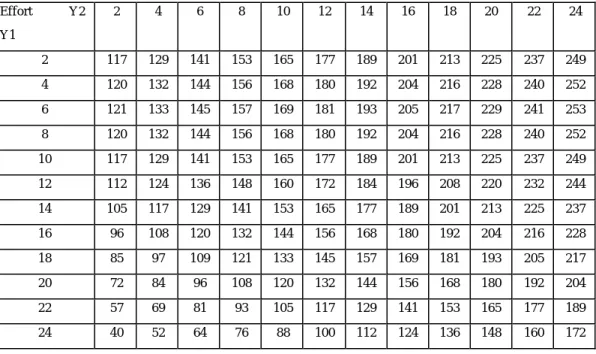
θ
=
0
.
5
Table 4 - Player Y1’s payoffs Effort Y2 Y1 2 4 6 8 10 12 14 16 18 20 22 24 2 117 129 141 153 165 177 189 201 213 225 237 249 4 120 132 144 156 168 180 192 204 216 228 240 252 6 121 133 145 157 169 181 193 205 217 229 241 253 8 120 132 144 156 168 180 192 204 216 228 240 252 10 117 129 141 153 165 177 189 201 213 225 237 249 12 112 124 136 148 160 172 184 196 208 220 232 244 14 105 117 129 141 153 165 177 189 201 213 225 237 16 96 108 120 132 144 156 168 180 192 204 216 228 18 85 97 109 121 133 145 157 169 181 193 205 217 20 72 84 96 108 120 132 144 156 168 180 192 204 22 57 69 81 93 105 117 129 141 153 165 177 189 24 40 52 64 76 88 100 112 124 136 148 160 172
Table 5 - Player Y2’s payoffs Effort Y2 Y1 2 4 6 8 10 12 14 16 18 20 22 24 2 117 126 133 138 141 142 141 138 133 126 117 106 4 123 132 139 144 147 148 147 144 139 132 123 112 6 129 138 145 150 153 154 153 150 145 138 129 118 8 135 144 151 156 159 160 159 156 151 144 135 124 10 141 150 157 162 165 166 165 162 157 150 141 130 12 147 156 163 168 171 172 171 168 163 156 147 136 14 153 162 169 174 177 178 177 174 169 162 153 142 16 159 168 175 180 183 184 183 180 175 168 159 148 18 165 174 181 186 189 190 189 186 181 174 165 154 20 171 180 187 192 195 196 195 192 187 180 171 160 22 177 186 193 198 201 202 201 198 193 186 177 166 24 183 192 199 204 207 208 207 204 199 192 183 172
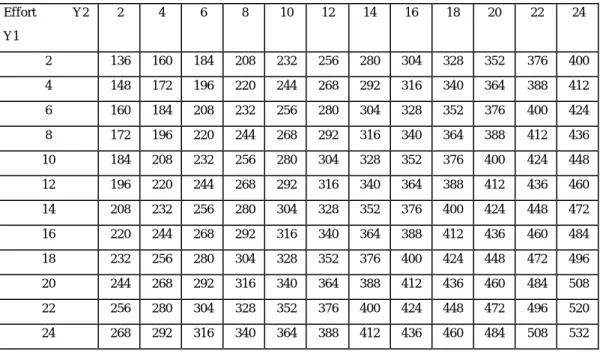
Table 6 - Player X’s payoffs Effort Y2 Y1 2 4 6 8 10 12 14 16 18 20 22 24 2 136 160 184 208 232 256 280 304 328 352 376 400 4 148 172 196 220 244 268 292 316 340 364 388 412 6 160 184 208 232 256 280 304 328 352 376 400 424 8 172 196 220 244 268 292 316 340 364 388 412 436 10 184 208 232 256 280 304 328 352 376 400 424 448 12 196 220 244 268 292 316 340 364 388 412 436 460 14 208 232 256 280 304 328 352 376 400 424 448 472 16 220 244 268 292 316 340 364 388 412 436 460 484 18 232 256 280 304 328 352 376 400 424 448 472 496 20 244 268 292 316 340 364 388 412 436 460 484 508 22 256 280 304 328 352 376 400 424 448 472 496 520 24 268 292 316 340 364 388 412 436 460 484 508 532
SHARING RULE : TPS-2 A3-
θ
=
0
.
25
Table 7- Player Y1’s payoffs Effort Y2 Y1 2 4 6 8 10 12 14 16 18 20 22 24 2 105 117 129 141 153 165 177 189 201 213 225 237 4 108 120 132 144 156 168 180 192 204 216 228 240 6 109 121 133 145 157 169 181 193 205 217 229 241 8 108 120 132 144 156 168 180 192 204 216 228 240 10 105 117 129 141 153 165 177 189 201 213 225 237 12 100 112 124 136 148 160 172 184 196 208 220 232 14 93 105 117 129 141 153 165 177 189 201 213 225 16 84 96 108 120 132 144 156 168 180 192 204 216 18 73 85 97 109 121 133 145 157 169 181 193 205 20 60 72 84 96 108 120 132 144 156 168 180 192 22 45 57 69 81 93 105 117 129 141 153 165 177 24 28 40 52 64 76 88 100 112 124 136 148 160
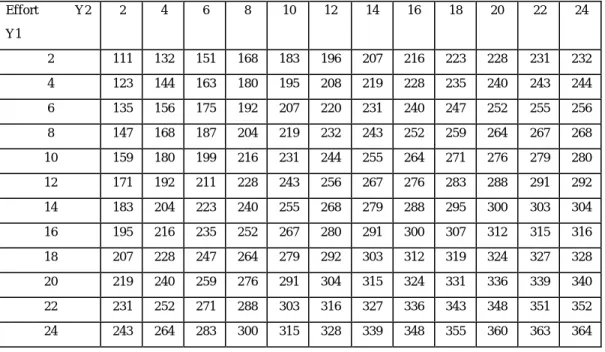
Table 8 – Player Y2’s payoffs Effort Y2 Y1 2 4 6 8 10 12 14 16 18 20 22 24 2 111 132 151 168 183 196 207 216 223 228 231 232 4 123 144 163 180 195 208 219 228 235 240 243 244 6 135 156 175 192 207 220 231 240 247 252 255 256 8 147 168 187 204 219 232 243 252 259 264 267 268 10 159 180 199 216 231 244 255 264 271 276 279 280 12 171 192 211 228 243 256 267 276 283 288 291 292 14 183 204 223 240 255 268 279 288 295 300 303 304 16 195 216 235 252 267 280 291 300 307 312 315 316 18 207 228 247 264 279 292 303 312 319 324 327 328 20 219 240 259 276 291 304 315 324 331 336 339 340 22 231 252 271 288 303 316 327 336 343 348 351 352 24 243 264 283 300 315 328 339 348 355 360 363 364
Table 9 - Player X’s payoffs Effort Y2 Y1 2 4 6 8 10 12 14 16 18 20 22 24 2 106 118 130 142 154 166 178 190 202 214 226 238 4 112 124 136 148 160 172 184 196 208 220 232 244 6 118 130 142 154 166 178 190 202 214 226 238 250 8 124 136 148 160 172 184 196 208 220 232 244 256 10 130 142 154 166 178 190 202 214 226 238 250 262 12 136 148 160 172 184 196 208 220 232 244 256 268 14 142 154 166 178 190 202 214 226 238 250 262 274 16 148 160 172 184 196 208 220 232 244 256 268 280 18 154 166 178 190 202 214 226 238 250 262 274 286 20 160 172 184 196 208 220 232 244 256 268 280 292 22 166 178 190 202 214 226 238 250 262 274 286 298 24 172 184 196 208 220 232 244 256 268 280 292 304 A4-
θ
=
0
.
5
Table 10 - Player Y1’s payoffs Effort Y2 Y1 2 4 6 8 10 12 14 16 18 20 22 24 2 103 111 119 127 135 143 151 159 167 175 183 191 4 104 112 120 128 136 144 152 160 168 176 184 192 6 103 111 119 127 135 143 151 159 167 175 183 191 8 100 108 116 124 132 140 148 156 164 172 180 188 10 95 103 111 119 127 135 143 151 159 167 175 183 12 88 96 104 112 120 128 136 144 152 160 168 176 14 79 87 95 103 111 119 127 135 143 151 159 167 16 68 76 84 92 100 108 116 124 132 140 148 156 18 55 63 71 79 87 95 103 111 119 127 135 143 20 40 48 56 64 72 80 88 96 104 112 120 128 22 23 31 39 47 55 63 71 79 87 95 103 111 24 4 12 20 28 36 44 52 60 68 76 84 92
Table 11 – Player Y2’s payoffs Effort Y2 Y1 2 4 6 8 10 12 14 16 18 20 22 24 2 107 120 131 140 147 152 155 156 155 152 147 140 4 115 128 139 148 155 160 163 164 163 160 155 148 6 123 136 147 156 163 168 171 172 171 168 163 156 8 131 144 155 164 171 176 179 180 179 176 171 164 10 139 152 163 172 179 184 187 188 187 184 179 172 12 147 160 171 180 187 192 195 196 195 192 187 180 14 155 168 179 188 195 200 203 204 203 200 195 188 16 163 176 187 196 203 208 211 212 211 208 203 196 18 171 184 195 204 211 216 219 220 219 216 211 204 20 179 192 203 212 219 224 227 228 227 224 219 212 22 187 200 211 220 227 232 235 236 235 232 227 220 24 195 208 219 228 235 240 243 244 243 240 235 228
Table 12 - Player X’s payoffs Effort Y2 Y1 2 4 6 8 10 12 14 16 18 20 22 24 2 112 136 160 184 208 232 256 280 304 328 352 376 4 124 148 172 196 220 244 268 292 316 340 364 388 6 136 160 184 208 232 256 280 304 328 352 376 400 8 148 172 196 220 244 268 292 316 340 364 388 412 10 160 184 208 232 256 280 304 328 352 376 400 424 12 172 196 220 244 268 292 316 340 364 388 412 436 14 184 208 232 256 280 304 328 352 376 400 424 448 16 196 220 244 268 292 316 340 364 388 412 436 460 18 208 232 256 280 304 328 352 376 400 424 448 472 20 220 244 268 292 316 340 364 388 412 436 460 484 22 232 256 280 304 328 352 376 400 424 448 472 496 24 244 268 292 316 340 364 388 412 436 460 484 508