HAL Id: hal-02876995
https://hal-pjse.archives-ouvertes.fr/hal-02876995
Preprint submitted on 21 Jun 2020HAL is a multi-disciplinary open access archive for the deposit and dissemination of sci-entific research documents, whether they are pub-lished or not. The documents may come from teaching and research institutions in France or abroad, or from public or private research centers.
L’archive ouverte pluridisciplinaire HAL, est destinée au dépôt et à la diffusion de documents scientifiques de niveau recherche, publiés ou non, émanant des établissements d’enseignement et de recherche français ou étrangers, des laboratoires publics ou privés.
Between Communism and Capitalism: Long-Term
Inequality in Poland, 1892- 2015
Pawel Bukowski, Filip Novokmet
To cite this version:
Pawel Bukowski, Filip Novokmet. Between Communism and Capitalism: Long-Term Inequality in Poland, 1892- 2015. 2019. �hal-02876995�
World Inequality Lab Working papers n°2019/08
"Between Communism and Capitalism: Long-Term Inequality in Poland,
1892-2015"
Pawel Bukowski, Filip Novokmet
Keywords : Communism; Capitalism; Inequality ; Poland, capital income,
distribution, concentration; market liberalisation; privatisation; top incomes
Between Communism and Capitalism:
Long-Term Inequality in Poland, 1892-2015
Paweł Bukowski
Centre for Economic Performance, London School of Economics and Political Science
Filip Novokmet
Institute for Macroeconomics and Econometrics, University of Bonn World Inequality Lab, Paris School of Economics
Abstract.
How has Polish inequality evolved between communism and capitalism to reach one of the highest levels in Europe today? To address this question, we construct the first consistent series on the long-term distri-bution of income in Poland by combining tax, household survey and national accounts data. We document a U-shaped evolution of inequalities from the end of the 19th century until today: (i) inequality was high before WWII; (ii) abruptly fell after the introduction of communism in 1947 and stagnated at low levels during the whole communist period; (iii) experienced a sharp rise with the return to capitalism in 1989. Between 1989 and 2015 the top 10% income share increased from 23% to 35% and the top 1% income share from 4% to 13%. We find that official survey-based measures strongly under-estimate the rise of inequality since 1989. Our new estimates show that frequently quoted Poland’s transition success has largely benefited top income groups.
We find that inequality was high in the first half of the 20th century due to strong concentration of capital
income at the top of the distribution. The secular fall after WW2 was largely to a combination of capital income shocks from war destructions with communist policies both eliminating private ownership and forc-ing wage compression. The rise of inequality after the return to capitalism in the early 1990s was induced both by the rise of top labour and capital incomes. However, the strong rise in inequality in the 2000s was driven solely by the increase in top capital incomes, which is likely related to current globalization forces. Yet overall, the unique Polish inequality history speaks about the central role of policies and institutions in shaping inequality in the long run.
Keywords: Income inequality; Transformation; Poland JEL Classification: D31, E01, J3, N34
* We are grateful to Michał Brzeziński, Paweł Chrostek, Irena Grosfeld, Sergei Guriev, Justyna Klejdysz, Marek Kośny, Guy Michaels, Branko Milanovic, Radosław Piekarz, Thomas Piketty, Aaron Reeves, Jacek Rostowski, Marek Skawiński, and Tomasz Zawisza for helpful comments. All errors are of ours. Pawel Bukowski is from the Centre for Economic Performance, London School of Economics and Political Science, Houghton Street, WC2A 2AE, London, p.bukowski@lse.ac.uk. Filip Novokmet is from the Institute for Macroeconomics and Econometrics, University of Bonn, Kaiserplatz 7-9, 53113 Bonn; fillip.novokmet@uni-bonn.de. Pawel Bukowski’s participation in the project was supported by the Economic and Social Research Council at the Centre for Economic Performance and by the European Union's Horizon 2020 research and innovation programme under grant agreement No 724363. Filip Novokmet’s participation in the project was supported by the European Research Council under the European Union's Seventh Framework Programme, ERC Grant Agreement number 340831.
2
1. Introduction
Right from the beginning of modern economics an interest in distributional issues has constantly been present in economic and public discourse, varying strongly in its intensity from the initial enthusiasm of the classical economists,1 but often finding itself unjustifiably ousted at the margins
of economic interest. In the middle of the twentieth century, Simon Kuznets renewed the enthusiasm and taught us about the inextricable interplay of inequality and economic growth in the process of economic development. However, the evolution of inequalities and its determinants are still not well understood. Our understanding of inequalities depends on the available empirical evidence, and as we have obtained new evidence, charting inequality further back in time, the old paradigms have been challenged and new ones developed. The research on top incomes (Kuznets 1953; Piketty 2001, 2014; Atkinson and Piketty, 2007, 2010) has played a central role in charting these new modes of understanding by providing the empirical basis for path-breaking theories in the field.
Although numerous developed countries have been extensively studied, surprisingly little attention has been devoted to Central and Eastern Europe. Importantly, Poland has been missing from the picture. The episodes of state formation, wars, socialism, transition into capitalism, and integration into the EU make Poland a particularly compelling case for studying determinants of income inequalities. Poland’s profound transformation from communism to a market economy happened in less than one generation, and the accompanying economic growth has been the fastest in Europe (Piatkowski 2018). While the real average national income per capita has more than doubled since 1990, little is known which income groups have benefited from it. A growing support for redistributive policies, as an important factor in the victory of the populist parties in recent elections (Lindner et al. 2019), might suggest that this growth has not been equally shared. How do inequalities evolve in such quick-changing societies and what is the role of transition policies and emerging institutions? Polish economy has been also deeply transformed by the new wave of globalization. This is the only major European country, which has recently experienced a substantial re/industrialization and growing share in the World’s GDP (Baldwin 2016). But we know little about distributional effects of these processes for the division of national income
3
between capital and labour. Finally, how does Polish experience compare to western European countries, Russia, other former socialist countries in EU, or China and other developing countries?
This paper is a first comprehensive attempt to look at the long-run evolution of inequality in Poland in order to shed light on these questions. We combine tax, survey and national accounts data to provide consistent series on the long-term distribution of national income in Poland. First, we combine household surveys and income tax data in order to provide more reliable estimates of the full income distribution series in Poland for the 1983-2015 period. More precisely, we use tax data on high-income taxpayers to correct the top of the survey distribution. Next, we construct top income shares for the whole period from the end of the 19th century until today.2 We provide thus
first homogeneous series that offer a possibility to compare the level and evolution of income inequality in Poland both through time and across countries. Our motivation is to fill the void in the literature and contribute to the understanding of the long-term determinants of inequality. Our work is also a part of the broader project of incorporating distributional statistics in the national accounts (Stiglitz et al. 2009; Alvaredo et al. 2016; Piketty et al. 2018; Garbinti et al. 2018; Bukowski et al. 2019).
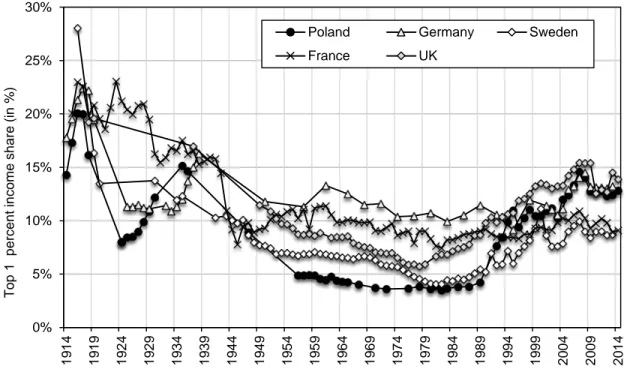
Figure 1 summarizes our main results on the long-run income inequality in Poland. Top income shares in Poland followed a U-shaped evolution from 1892 until today. Inequality was high in the first half of the 20th century due to high concentration of capital income at the top of the distribu-tion. Initially, during the period of Partitions, top income shares experienced different trajectories in the Prussian and Austrian parts. A steady rise in the former contrasts with the stagnation in the latter. The end of the First World War and the immediate post-war development led to the sharp reduction in top income shares, owing to the shocks to capital income such as the wartime destruc-tion, the hyperinflation of the early 1920s and the introduction of the anti-rich policies, including steeply progressive income and wealth taxation. During the interwar period, top income shares recovered from this low-point. The Great Depression resulted in further top concentration since
2 The reason we focus on top income shares for the earlier period is the absence of household survey data (see Section
2). Nevertheless, it has been found that the evolution of top income shares reasonably well outlines the evolution of the overall income distribution through the 20th century (Roine and Waldenström 2015).
4
top incomes were less adversely affected than the majority of the population consisting of small-holding farmers. The proportionally lower decrease in incomes of top groups during the depression was largely procured by the rapid cartelization and intensified industrial concentration. Yet, using cross-regional data for the interwar Poland, we also point to the importance of inherited institu-tional and legal systems for the level of inequality.
As documented now in many countries, the post-WWII downward trend was induced by the fall in capital income concentration. The introduction of communism signified comparatively greater shock to capital incomes relative to other countries, by literally eliminating private capital income with nationalisations and expropriations, while in addition it implied strong reduction of top labour incomes. During the remaining four decades of the communist rule, top income shares displayed notable stability at these—to some extent artificially—lower levels. Despite the specific dimen-sions of inequality during communism we argue that money incomes were the single most im-portant welfare dimension in the socialist Poland.
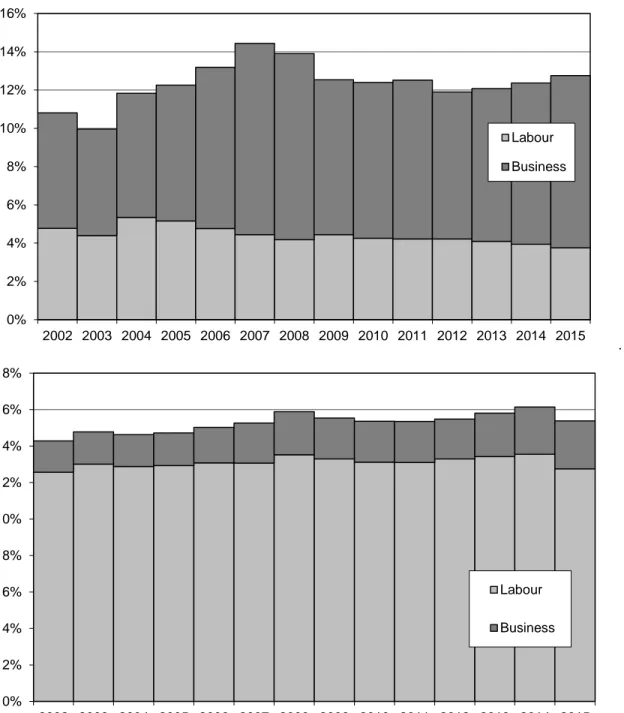
We analyse the transition from communism to the market economy by constructing the full income distribution (1983-2015) from combined tax and survey data. Figure 2 presents our series on the income distribution. We show that within one generation, Poland has moved from being one of the most egalitarian to one of the most unequal countries in Europe. Inequality experienced a sub-stantial and steady rise after the fall of communism, which was driven by a sharp increase in in-come shares of the top groups within the top decile. The highest increase took place immediately at the outset of the transition in the early 1990s, but we also find a substantial growth since the early 2000s, after Poland joined the EU. In fact, top income groups have been main beneficiaries of strong Polish growth in the 2000s. Over the whole 1989-2015 period, top 1% has captured almost twice as large portion of the total income growth than the bottom 50% (24% versus 13%). The middle 40 per cent and bottom 50 per cent income shares experienced a similar evolution characterized by a stable fall from the transition until the mid-2000s, and a stagnation afterwards. A considerable tax redistribution (especially during the early transition) was needed to pre-clude a stronger decline of middle and bottom income groups (Brzezinski et al, pp. 98-99). These results stay in contrast to the official survey-based measures, which substantially underestimate the rise of inequality since the end of communism, primarily by underestimating the top of the
5
income distribution. Our work thus sheds a new light on the distributional impact of the post-communist growth and presents a major contribution to the rich literature on the inequality devel-opment in Poland after the fall of communism (Atkinson and Micklewright 1992, Rutkowski 1996, Szulc 2000, Keane and Prasad 2002, Mitra and Yemtsov 2006, Brzezinski et al. 2013, etc.).
The rise of inequality after the return to capitalism in the early 1990s was induced both by the rise of top labour and capital incomes. However, the strong rise in inequality in the 2000s was driven solely by the increase in top capital incomes, which are dominant sources of income for the top percentile group. The labour income, in turn, dominates for the group below the top percentile. Today, Polish top income shares are at the level of more unequal European countries, most notably Germany and the United Kingdom, but still substantially below those documented in Russia (No-vokmet et al. 2018a). However, income concentration in Poland is higher than in other former socialist countries in the EU, owing to relatively higher number of affluent entrepreneurs, plausibly benefiting from the larger domestic market. Finally, the evolution of Polish top incomes bears similarities to China (Piketty et al. 2019; Novokmet et al. 2018b), which suggests that inequality has risen both at middles (e.g., Poland or China) and ends (e.g., the US or Germany) of the global value chains (Autor et al. 2014; 2016; Balsvik et al. 2015).3
3 Baldwin (2016) describes Poland as one of the ‘Industrializing Six’ countries with growing share of manufacturing
(next to China, Korea, India, Indonesia and Thailand) and the ‘Rising Eleven’ countries with rising global share of GDP.
6
Figure 1: Top 1 per cent income share in Poland 1892-2015
Source: authors’ computation based on income tax statistics. Distribution of fiscal income among tax units. Note: the Prussian Poland is the Province of Posen and West Prussia, the Austrian Poland is Galicia. For 1925-1937 Poland is the Second Polish Republic (with 1918-1939 borders), for 1992 Poland is the Third Polish Republic (with post-1945 borders).
Figure 2: Income shares in Poland 1983-2015
Source: authors’ computation. Distribution of pre-tax national income (before taxes and transfers, except pensions and unemployment insurance) among equal-split adults.
0% 5% 10% 15% 20% 25% 18 90 18 95 19 00 19 05 19 10 19 15 19 20 19 25 19 30 19 35 19 40 19 45 19 50 19 55 19 60 19 65 19 70 19 75 19 80 19 85 19 90 19 95 20 00 20 05 20 10 20 15 T op 1% inc om e s har e Poland Austrian Poland Prussian Poland 15% 20% 25% 30% 35% 40% 45% 50% 19 83 19 85 19 87 19 89 19 91 19 93 19 95 19 97 19 99 20 01 20 03 20 05 20 07 20 09 20 11 20 13 20 15
7
Our paper is closely related to the voluminous literature looking at the relationship between inequality and economic growth. Kuznets (1953) has constructed first top income shares for the US, which served as the empirical basis for the inverted-U curve, according to which inequality rises in early phases of economic development but falls eventually as the growth advances (Kuznets 1955). Economists have generally applied the ‘demand and supply of skills’ framework to explain changes in inequality (see i.e. Acemoglu 2002; Card and DiNardo 2002). The recent rise of inequality has been perceived as a by-product of technological change that has been spurring economic growth and bringing exorbitant rewards to few visionary entrepreneurs. But inequality is bound to fall eventually as these innovations permeate the economy and new skills are acquired by the rest of the society, most importantly through education (Tinbergen 1974; Goldin and Katz 2008). But, the revival of the Kuznets’s pioneering study (1953) by Piketty (2001, 2003) has challenged this optimistic view, as we observe continuously growing inequalities.4 Piketty (2014) has recently offered a more sombre view of the growth-inequality link, according to which unrestrained capitalist development inevitably leads to rising inequality. He believes that the ‘great levelling’ of the twentieth century was a historically unique episode and that there is no spontaneous fall in inequality.
This study shows the central role of policies and institutions in shaping inequality in the long run. Most obviously, the critical role of institutions and policies is manifestly encapsulated by unpar-alleled changes in the labour market and capital ownership arrangements which followed the rise and fall of communism in Poland. The communist system eliminated private capital income and compressed earnings, which led to the sharp fall and decades-long stagnation of the top income shares. By the same token, the labour market liberalisation and privatisation during the transition instantly increased inequalities and brought them to the level of countries with long histories of capitalism. To a certain extent, the Polish experience may be seen as an extreme version of ine-quality developments in the Western countries. In the latter, authors as Piketty (2001, 2014) or Atkinson (2015) have attributed the key role to fiscal institutions and redistributive policies (such
4 In addition to the skill-biased technological change, economists have explored alternative explanations, especially
processes connected with the new wave of globalization (e.g., Autor et al 2016), institutional changes (e.g., Machin and van Reenen 2007), tax policy favouring the richest, (e.g., Piketty et al. 2014) or increasing wealth inheritance (e.g., Alvaredo et al. 2013).
8
as changing patterns of progressive taxation and social expenditure) for the long-run evolution of income inequality.5
Furthermore, divergent transition strategies taken in Poland, on the one hand, and Russia, on the other, connote alternative political choices which support the importance of institutions and poli-cies. For example, a marked increase in social transfers during first transition years played the key role in ‘protecting’ the bottom 50% of the distribution and provided the general political support for the market reforms and enterprise restructuring in Poland (Keane and Prasad 2002). This stands in contrast to the Russian transition, where the bottom 50% share collapsed (Novokmet et al. 2018a), and suggests that mitigating a more substantial rise in inequality may be actually condu-cive for economic growth (Banerjee and Duflo 2003, Sukiassyan 2007). We provide additional pieces of suggestive evidence to support the importance of institutions and policies. Using a cross-country panel with a full set of cross-country and year fixed effects, we first show that the changes in minimum wage in Poland had positive implications for the share of bottom 50%, but negative in Russia. Second, that privatization in Russia predicts much stronger rise of inequality in Russia, than in Poland. Overall, the unique Polish inequality history suggests that the rise of inequality is not inevitable and, most importantly, that the future will depend on the institutions and policies taken.
Finally, the recent developments suggest that the future of inequalities in Poland is likely to be linked with the prominent role of capital income among top incomes. Moreover, one should not expect a weakening of this trend, as processes connected with globalisation and technological change seem to contribute to the growing dominance of capital in the economy. Using the same methodology as described above, we show that the rise of capital share and export share of GDP in Poland predict a strong rise of the top 1% income share and fall of all other income groups. In line with the globalisation channel, we show a similar pattern in Germany, which has been Po-land’s the largest direct investor and most important trading partner. Rising inequalities might have
5 For example, the top marginal tax rates of the personal income tax had reached ‘confiscatory’ levels above 90% in
the post-WW2 decade in the US and the UK. Similarly, the radical measures were taken at decreasing industrial concentration (such as the New Deal antitrust regulation in the US, or the dissolution of zaibatsu in Japan after WW2, Moriguchi and Saez 2008). In this respect, a development in Poland after the accession of communists to power could be seen as a more extreme variety of anti-rich policies and institutions implemented internationally.
9
adverse social and political implications, as evident in the recent populist anti-globalization back-lash in Poland and internationally (Algan et al. 2017, Piketty 2018, Eichengreen 2018, Rodrik 2018, Fukuyama 2018, Lindner et al. 2019). The issue of distribution of gains from economic growth has become thus crucial for sustaining the long-run development. We hope that our work will be a contribution in how to approach these imminent challenges.
The paper is organised as follows. Section 2 describes data sources and methodology. Section 3 presents trends of the top income shares since the end of the 19th century until the end of
com-munism. Section 4 presents the evolution and composition of the full income distribution since 1983 until today, and discusses the potential mechanism at play. Section 5 compares the estimates for Poland with other countries. Finally, Section 6 concludes. The details of the data and estimation are discussed in the Appendix.
2. Data and Methodology
We combine tax, survey and national accounts data to construct our measures of long-run income distribution. First, we construct new consistent series on the entire income distribution for the 1983-2015 period. More precisely, we correct the top of the household income survey distribution with administrative tax data on high-income taxpayers. The methodology follows the Distributional National Accounts (DINA) guidelines (Alvaredo et al. 2016). For the earlier period, we focus on top income shares due to the absence of viable household survey data. We combine income tax and national accounts data to construct top income shares for the whole period from the end of the 19th century until today. Appendixes A.1–A.3 discuss in detail the data and methodology.
2.1. Data sources
Income Tax Statistics in Poland. We first present data sources on income tax statistics, which present the central block for the construction of top income shares and the distributional national accounts. The first modern income tax in the Polish lands was established by the Prussian (1891) and Austrian Empires (1898) during the Partitions of Poland. Both Prussian and Austrian income tax statistics provide tabulations of income taxpayers in a regional breakdown, which has allowed
10
us to construct top income shares for provinces with significant Polish population (Pomerania, Posen, Silesia, West Prussia in Prussia; Galicia in Imperial Austria). There is no tax data for the Russian Partition (the Congress Kingdom), as comprehensive income tax was never introduced in the Imperial Russia.
In 1924 the newly independent Poland introduced a unified progressive income tax for its whole territory. Detailed interwar income tax statistics were published separately for unearned income (fundowany) and earned income (niefundowany), organised by a large number of income brackets containing the number of taxpayers in each bracket and their corresponding tax obligation.6 The
total income in brackets is missing, but bracket ranges are quite narrow, and consequently, estimates of total bracket income are robust to the specific distributional assumptions (see Appendix A.1.3 for more details).
The communist government was established in 1947, so the interwar income tax system was still in use for several years after WWII, and the income tax tabulations are available for 1945-7. However, with the waves of nationalisation and the elimination of the private sector in the late 1940s, the personal income tax de-facto disappeared along with tax statistics. Instead, we combine different data sources to construct top income shares during the socialist period. As our starting point, we look at the detailed earnings statistics, published annually since 1956. The statistics covered all workers in the socialised sector, which accounted for the greatest part of the labour force(Atkinson and Micklewright 1992, Atkinson 2008). Published tabulations range workers in the large number of brackets according to the size of their gross earnings,7providing as a result a detailed insight both into the upper and lower tail of the earnings distribution.8 Next, we assume
6 See Appendix A.1.3 on how we combine tabulations for unearned and earned income.
7 Atkinson and Micklewright (1992, p. 257) point out that the definition of gross earnings “include basic pay, overtime,
compensation for hazardous work conditions, additional payments related to job tenure or the holding of a managerial position, profit shares, bonuses and premia”
8 In order to check the representativeness of top wages in the enterprise survey, we have found the statistics of the
‘equalizing tax’ (podatek wyrównawczy) in the Archives of Modern Records (Archiwum Akt Nowych) in Warsaw (subject to the tax were individuals earning 3.5 times the average wage in the 1970s, 2 times the average wage in the 1980s). Namely, the wage survey did not include armed forces and police or senior government officials (Atkinson and Micklewright 1992), while the latter included. The comparison suggests a strong consistency between sources, resulting in practically equivalent top income shares of top 0.1% group (the inverted Pareto coefficient of P99.9-100 is around 1.3 according to both sources). A corresponding picture is obtained from the personal income tax data in socialist Yugoslavia, exploited in Novokmet (2017).
11
that top earnings in the earnings statistics are representative of the right-end tail of the income distribution9 (more precisely, we focus on brackets covering 5 per cent of individuals with highest earnings), while the remaining adult population is bulked into the bottom bracket (the bottom 95 per cent).10 We impute the remaining income from self-employment and social transfers as follows. Income of self-employed in the agriculture and pensions are wholly attributed to the bottom bracket.11 Other self-employment income and other cash transfers are uniformly distributed among all adults. For all details and data sources, see Appendix 1 and 2.
For the post-communist era, income tax data come from the annual reports on the settlement of the personal income tax (PIT). The tax administration has published annual income tax tabulations since 1992. Tabulations are organised by income ranges that correspond to tax brackets as defined by the progressive tax schedule, with each bracket containing the number of taxpayers, their total income, deductions and the corresponding tax obligation. Due to the limited progressive structure of Polish PIT, the number of brackets in published statistics has been relatively small (generally equal to three for the post-communist period), with more than 90% of taxpayers located in the bottom bracket. As a result, although a great majority of population is subject to PIT, the available income tax tabulations cannot be used to recover the entire income distribution. Instead, we use information on high-income taxpayers in combination with the household survey data. The sources of income tax statistics are provided in Appendix A.1.6.
Household income surveys. Household budget survey (HBS) has been regularly conducted in Poland since 1957. Until 1972, it covered only employees in socialized sector excluding agriculture. Thereafter, it was conducted for four types of households: worker, mixed, farmer, and pensioner households (Atkinson and Micklewright 1992, pp. 258-263). The survey underwent
9 The rationale behind this assumption is that since the private capital income played a marginal role in the Polish
socialist economy, top earnings provide a reasonably good approximation of top incomes.
10 Note that we define the population unit as the individual aged 20-year-old or more (see below), which means that
our control total for the population includes, in addition to those employed in the socialised sector, importantly self-employed (largely in the private agriculture) and pensioners. Note accordingly that high-earning individuals from the wage statistics account for the top 5% of the total adult population (rather than of all workers only)
11 The bulk of non-wage private income was concentrated in the small-scale agriculture, characterized by the low
productivity and the small earning potential (as it was heavily constrained by the small maximum holding size and the maximum number of employees allowed), and thus plausibly did not contribute to top incomes.
12
important changes after 1990, becoming fully representative of the population (Kordos et al 2002; Milanović 1999; Keane and Prasad 2000).
For the 1980s, we use the Polish Household Budget Survey (HBS) data from Atkinson and Micklewright (1992, Tables PI1 and PI2). The authors provide tabulations of the individual distribution of household income per capita by combining the distribution of income for four types of households from the official HBS reports.12 The tabulations are organized by eight income
groups, providing in each the number of individuals and the mean income. For the 1992-2004 period, we use harmonised HBS microdata from the Luxembourg Income Study (LIS). Finally, for the period 2005-2015, we use the EU Statistics on Income and Living Conditions (EU-SILC) collected by Eurostat. We harmonize the definition of income and the unit of analysis across the surveys (see Appendix A.2.1).
National accounts data. We construct the total income and population controls based on the definition of income and the tax unit in the tax code. For the 1992-2015 period, we use National Accounts data published by the Central Statistical Office of Poland (GUS). For the interwar period we rely on historical series published by Kalecki and Landau (1934), as well as series constructed for the Maddison project (Bolt et al. 2018). The data for the period before World War I comes from the Prussian and Austrian censuses, yearbooks and various monographies (see Appendixes A.1.1–1.2.).
2.2. Methodology
There have been long-standing attempts to combine various data sources in order to produce consistent series on the distribution of national income over time and across countries. One of the pioneering works was done on Poland by Jan Wiśniewski (1934), who combined numerous data sources, such as income tax data, occupational ‘social tables’, and census data, in order to estimate the income distribution in Poland in 1929. In recent years, the large body of empirical work on the income distribution has estimated long-run series of top income shares, by combining income tax tabulations with national accounts totals for the population and the income, and using Pareto
12 The official HBS reports during socialist Poland give separate presentations for four household types and do not
13
interpolation techniques. The methodology was pioneered by Kuznets (1953) and recently advanced by Piketty (2001, 2003), Atkinson and Piketty (2007, 2010), among others. We produce top income shares in Poland for the whole period from 1892 until 2015. All details are provided in Appendixes A.1–A.3.
Although tax data has proven to be especially useful to chart the long-term dynamics at the upper end of the distribution, they are however silent on the remaining part of the distribution. On the other hand, it is well documented that household income surveys underestimate top incomes,13
which can critically impact overall distributional measures and misread the general trends in the income distribution (Piketty and Saez 2003; Atkinson et al. 2011). Consequently, there have been various attempts to combine administrative tax and survey data to obtain more reliable estimates of the income distribution (e.g. Burkhauser et al. 2016; Piketty et al. 2018). A major progress in this direction has been made by the WID.world project. We follow its Distributional National Accounts guidelines (Alvaredo et al. 2016; Piketty et al. 2018) in the construction of comprehensive measures of income distribution in Poland.
The general methodology we use to combine survey and fiscal data consists of two basic steps. In the first step we use the raw survey tabulations and generalized Pareto interpolation techniques (Blanchet et al. 2017) to estimate series on the distribution of survey income by generalized per-centiles (g-perper-centiles).14 In the second step, we use tax data on high-income taxpayers to correct upwards the survey series and obtain corrected estimates of the distribution of fiscal income. We assume that survey data provide a reasonable description of the income distribution below the 85th percentile. On the other hand, we take that tax data is accurate above the percentile corresponding
13 Most importantly, due to higher non-response and under-reporting among richer respondents, as well as due to
specific survey collection constraints and top coding.
14 As explained in Alvaredo et al. (2016, p. 15) “G-percentiles files use 127 rows: 99 for the bottom 99 percentiles, 9
for the bottom 9 tenth-of-percentiles of the top percentile, 9 for the bottom 9 one-hundredth-of- percentiles of top tenth-of-percentile, and 10 for the 10 one-thousandth-of-percentile of the top one-hundredth-of-percentile.”
14
to the first available income threshold in tax tabulations (generally corresponding to the 95th per-centile).15 We then apply the piecewise-linear correction factors f(p) between these percentiles.16
In our accompanying work in progress (Bukowski et al. 2019) we show that the above methodology produced series on income inequality remarkably similar to those based on the registry database of the universe of individual-level tax returns for the period 2004-2017 (see also Kośny 2012 for Lower Silesia).17
Unit of observation. The unit of observation is the individual aged 20-year-old or more. Household income in survey is equally split between adults who belong to the same household. We should bear in mind that when combining survey and tax data we make implicit assumptions that high-income individuals in tax data are either singles, or that spouses have reported equal income. Since the option of joint filing for couples is widely used (the tax unit in the tax code is individual), it is reasonable to assume that eligible high-income taxpayers file a joint declaration by equally splitting their income in order to reduce their tax obligation.18 According to the PIT reports, the majority of eligible taxpayers used the joint taxation.19
Further issue is that the homogeneity over time can be impaired by changes in the tax unit in the tax code. While the data for the communist and post-communist period relates to individual units,
15 We find this assumption fairly robust by checking different variant series using p
0=0.8 and p0=0.9.
16 More precisely, the upgrade factor between survey and fiscal income is 1 for P85 and rises linearly to the observed
factor in the tax and survey data. We also apply linear correction factors between empirical thresholds from the tax tabulations.
17 Because of the regulation at the Ministry of Finance of Poland, we are not able to use the individual-level tax data
in this paper.
18 We use equal-split-adults series within the household rather than within the couple as our benchmark, because the
Household Budget Survey (used for the 1983-2004 period) reports a substantial part of the household income only at the household level. Since the tax data relates to income split within couples, we have implicitly assumed that nuclear families prevail in Poland today (especially in the case of higher income households), and this should not result in any significant bias.
19 In 2000, almost 62% taxpayers used joint taxation, after the linear taxation has been introduced in 2004, 58% of
those using progressive schedule used this option, and in 2016 the share fell to 48%. In comparison, the share of married in working age population was 64% in 2000 and 55% in 2016 (GUS 2017). Therefore, a substantial share of marriages used joint taxation, and the downward trend in the share of joint fillings could be due to a falling share of married people throughout this period.
Furthermore, we have adjusted downwards thresholds and average incomes in the income tax tabulations after 2004, in order to account for the fact that taxpayers under the ‘business’ flat tax schedule cannot use the joint-filing option and split their income with their spouses. See Appendix A.1.6.
15
the tax unit in Austria, Prussia, and in interwar Poland was household, with the total income of household members ascribed to the head of the household. This makes a discontinuity in the series after 1947, however, Atkinson, Piketty and Saez (2011) suggest that the potential bias should not affect the general trend in top income shares. The total number of households is estimated as all adult above 20 years of age minus the number of married females. The corresponding data is taken from population censuses and annual figures from the statistics on the movement of the population, and linearly interpolated for missing years.
Definition of Income. We focus on the distribution of pre-tax income, which refers to the sum of all income flows going to labour and capital, plus pensions but before other taxes and transfers. This income concept corresponds to the concept of fiscal income reported in the income tax statistics (Alvaredo et al. 2016; Piketty et al. 2018).20
Taxable income in both Austria and Prussia, as well as in the interwar period was quite broad and allowed very few exemptions.The post-communist tax data include income from employment, pensions, income from non-agricultural business activity and special agricultural activity, income from self-employment, rental income and income from other sources.21 We account for the changes in the tax law, which modify the definition of income. There were no major reforms of the tax system during the interwar period. However, the post-communist tax law has been amended several times since 1992. Most importantly, since 2004 income from non-agricultural business activity (further referred as business income) can be taxed separately using a newly introduced flat tax. See Appendix A.1.6. for all details how we combine statistics on business income taxed at linear rates and income taxed using the progressive scale.
As noted, when joining the survey and tax data, we produce the distribution of fiscal income.22 A distinction needs to be made between fiscal income and national income, which is defined as GDP
20 This income concept has been typically labeled as ‘gross income’, which refers to income before all personal
de-ductions and personal income taxes (Atkinson and Piketty 2007, 2010). Note that the gross definition is after subtrac-tion (from revenues) of costs needed to obtain, secure and maintain income.
21 Capital income in the form of dividends and interests is taxed separately at a source and thus not included in the
statistics for the progressive schedule. However, most of the income derived from business activity is taxed at the individual level as income from non-agricultural business (see below).
16
minus consumption of fixed capital plus net foreign income (SNA 2008). A major difference is due to the fact the national income includes in addition tax-exempt capital income, such as undis-tributed corporate profits or imputed homeowners’ rents. We do not impute these items due to data availability, but, in general, it has been found that the fiscal correction (using income tax data) accounts for the bulk of upward correction of raw survey inequality, and further adjustment for the distribution of tax-exempt capital income has showed to be of limited importance (e.g. Novokmet et al. 2018, Piketty et al. 2019). Most importantly, correcting income distribution by imputing corporate retained earnings is less important in Poland, because business income is predominantly taxed according to the pass-through concept and hence attributed to individuals(Kopczuk 2012; Alstadsæter et al. 2017).23
Alstadsæter et al. (2017, Table 1) show that Poland has by far the high-est share of employment in pass-through entities in Europe. Finally, in order to allow an interna-tional comparison, we scale fiscal income distribution up to the nainterna-tional income totals by propor-tionally upgrading thresholds and average incomes for each percentile of the fiscal income distri-bution.
3. Top Income Shares in Poland 1892-1989
This section presents the evolution of top income shares in Poland since 1892 until 1989. Over this period, Poland has experienced dramatic economic and political transformations. We start with a brief summary of the Polish economic growth and major historical episodes since the end of the 19th century. Throughout the 20th and 21st centuries the real income per adult in Poland has been around half of the income in Western Europe (Figure A1). The gap widened during the communist period, especially in the 1980s, and has narrowed after the transition in 1989. Today, Poland is considered by the World Bank as a high-income country.
23 The ‘pass-through’ approach of taxing business income is applied to unincorporated entities, where business income
is attributed to the owner who is taxed under the personal income tax. Most domestic firms in Poland are unincorporated businesses (Concise Statistical Yearbook of Poland (annual). Chapter: Privatization. Entities of the National Economy). Alternatively, business income of incorporated entities is taxed under the corporate tax, and subsequently taxed at the individual level when distributed (Alstadsæter et al. 2017). As we show in Figure A18, this legal form has been chiefly used by foreign-owned corporations.
17
Table 1 summarizes the major episodes in the Polish history since the 19th century. We follow this historical periodization in our analysis, as we believe that the specific historical setting and chang-ing institutional frameworks are essential in shapchang-ing inequality in the long run.
Table 1: Major Episodes in the Polish History since the 19th Century
1772 – 1918 The Partitions of Poland between Austria, Prussia, and Russia. As a result, Poland was removed from the map of Europe for 123 years. The occupying Empires imposed their own institutions.
1914 – 1918 World War I – the occupying Empires fought on the opposite sides, leading to a massive destruc-tion on the Polish lands.
1918 – 1939 Interwar Poland – the country was re-created and gained a full independence. It drifted from dem-ocratic parliamentary republic towards authoritarian presidential republic.
1939 – 1945 World War II – Poland was occupied by Germany and Soviet Union, and experienced the biggest relative war losses. Approximately 17% of the 1939 population were killed.
1947 – 1989
Communism – Soviet communist system with a centrally planned economy was introduced. Al-most a complete elimination of private capital income, through e.g. nationalisation or expropria-tion.
1989 – Capitalism – a market based economy with parliamentary democracy was re-established. In 2004 Poland joined the European Union.
3.1. Partitioned Poland and World War I
The three Partitions displayed different levels of economic development as well as specific institutions and different social conditions.24 Only Prussia and Austro-Hungary introduced a comprehensive income tax in the Polish lands. We construct top income shares for the Austrian and Prussian partitions. Unfortunately, we omit the Russian partition as there are no comprehensive tax sources available.
24 The best economic situation was in the Prussian part, where the authorities carried out many reforms including the
abolition of serfdom. The agriculture, rather than industry, was the main driver of the economic progress. In the Russian partition, it was the industry that developed the most. The delayed abolition of serfdom reforms during the second half of the 19th century contributed to the relative backwardness of the agriculture in the Congress Kingdom. However, the worst economic situation was in the Austrian part. Before the end of the 19th century, Galicia had not been industrialized, and the agriculture was under invested and parceled.
18
Figure 1 shows the top 1 per cent income shares in Poland since 1892 until today (see Table A1 - Table A3).25 We start with the Prussian Partition. It can be seen that following a moderate rise since the 1890s until 1914, top inequality increased sharply by 7 percentage points after the out-break of World War I. The overall rise in top income shares was mostly driven by very high-income shares (see Figure A2 and Figure A3, Table A4) and almost exclusively due to a rise of very high incomes in the rural areas, while shares of urban incomes remained surprisingly stable throughout the whole period under consideration (Figure A4).26 We believe that an explanation
for the documented rise of top income shares in the Prussian partition should be sought in the growth of the commercial capital-intensive agriculture (Dumke 1991) and development of related industries (such as distilleries, mills or machines for agriculture, etc.) (Perkins 1984, Grant 2005, Eddie 2008).27 The functional shift towards capital income in agriculture was dominantly captured by the top of the distribution because of relatively high land inequality – an outcome of the Prussian land reforms, which favoured larger estates at the cost of smallholdings (Mieszczankowski 1960; Grant 2005; Eddie 2008, 2013). Large estates were the driving force behind the structural trans-formation of agriculture in East Elbia, in what has often come to be generalised as the ‘Prussian’ road to industrialisation (Lenin 1908).
The emergence of agrarian capitalism in Prussian Poland was spurred by external and internal factors. Changes in the terms of trade induced a shift from traditionally dominant grain production to capital-intensive industrial crops,28 such as sugar beet. Mass migrations from the east to industrial regions in western Germany and across the Atlantic led to the growing shortage of labour and subsequent rise in agricultural wages (Wolf 2006). At the same time, the economic nationalism
25 Malinowski and van Zanden (2017) provide the estimates of the income distribution for the preindustrial Poland. 26 To be more precise, the rise of top incomes in rural areas and stagnation in urban areas was a characteristic of the
Province of Posen – the largest and most important part of the Prussian Partition. In the second province, Western Prussia, we do not report differences between rural and urban areas. See Bukowski and Novokmet (2017) for more details.
27 Dumke (1991) finds that the capital share in national income increased during the industrialization in Prussia due
to the rise of the capital share in agriculture. There was a concurrent rise in income inequality.
28 This gradual turn from traditionally dominant grain production in the eastern provinces was largely motivated by
the availability of the cheap grain import from the ‘New World’ and Russia, caused by a fall in transport costs, and the introduction of the grain tariffs could not have halted this trend (Wolf 2006). Germany gradually became the net importer of grain and lost in addition its traditional grain export markets as Britain.
19
of the Prussian government curbed immigration of the abundant cheap labour from the Russian and Austrian partitions. Despite the campaigns of Prussian landlords for looser immigration policy, the Prussian authorities endeavoured instead in alternatives such as providing eastern agriculture with additional capital (Wolf 2006). Growing capital-intensity of agriculture likely contributed to a spectacular improvement in productivity in the Prussian partition between 1882 and 1907, surpassing that in the rest of Germany (see Figure A5, Tipton 1976, Grant 2002).29
The Austrian Partition (also known as Galicia) was economically the least developed of the three ‘partitioned’ Polish regions.30 Top income shares in Galicia showed no clear trend in the two
decades preceding WW1 (Figure 1). The top 1 per cent income share increased by almost 3 percentage points in the short period from 1898 until 1901, when it peaked at 14.3 per cent. Afterwards we observe a falling trend during the years preceding WW1. We believe that top incomes in Galicia were dominantly an urban phenomenon. As shown in Figure A6,31 the predominance of employment income might suggest that employees in towns, such as in banks or imperial administration, lived much better than the surrounding rural population – overwhelmingly living at the bare subsistence level.32 Similarly, top incomes presumably included modest business activities in cities, carried on dominantly by Jews engaged in commerce, handicraft and smaller-scale industry (McCagg 1989).33 As we look below, the rural-urban income gap figured prominently during the interwar period. Among the interwar Polish counties, those located in Galicia were characterized by the highest correlation between urbanisation ratio and top 1% income shares (see Section 3.2.).
29 For instance, the yield of potatoes and wheat in quintal per hectare doubled between 1878-1882 and 1909-1913
(Wolf 2006, p.39).
30The area was fully incorporated into Poland in 1918, but only the western part remained in the country after
WWII.
31 We cannot ascertain income sources of particular top groups, as there is no source breakdown for specific tax
brack-ets, but only the income decomposition of those subject to the income tax (approximately the top 2-3 per cent income group).
32 Smallholdings coupled with prevailing backward agricultural techniques remained the main characteristic of the
Galician agriculture. In 1902, one-third of agricultural holdings were smaller than 2 hectares and 60% less than 5 hectares (only 1.2% larger than 20 hectares) (Bujak 1908). Clearly, such dwarf holdings could not secure even the minimum existential needs. Regional specialization in agricultural products was further impeded due to more efficient competition from Hungary and Moravia, as well as high tariffs in the Prussian and Russian partitions (Landau and Tomaszewski 1985, p. 16).
33 There were only a few industries of some importance in Galicia, such as the crude oil industry, salt mining or
distilling. The former, in particular, was a source of never realized dreams of economic prosperity. Galicia produced in 1909 almost 5 per cent of the world output of crude oil and gave rise to several men of substantial wealth, such as industry pioneers Szczepanowski or McGarvey (Frank 2005).
20
Top income shares in the Prussian partition soared during World War I (Figure 1 and Figure A2, Table A4). The economic environment favoured the capital owners, especially due to the wartime demand for armament and food. The shortage of raw materials, critical for the war economy, brought huge profits to Silesian mining industry and its ‘coal barons’ residing at the top of the income distribution. The Allied blockade was the root cause of the German food problem, as it caused a plunge in food imports (Ritschl 2005). Food shortages led to a surge in prices, bringing, in turn, extraordinary profits to agricultural producers, which were proportionally more concentrated in Prussian Poland. It may be thus indicative that the greatest increase in top income shares occurred in 1916. In that year, German food imports had collapsed due to a halt of imports from neutral countries, namely from Denmark and Netherlands, which were important supply source during the first two years of the war (Ritschl 2005, Hardach 1977).34
3.2. Interwar Poland
The unification of Poland in 1918 is one of the pivotal events in the Polish history. Poland was established on the world map after 123 years under foreign dominions. This century-long dream had to be, however, realised in quite a tumultuous atmosphere of economic crisis, broken interna-tional trade, and recovery from the massive destructions and human losses of the Great War.
Our starting point in the interwar period (1924) coincides with the lowest documented point in top income shares during the existence of interwar Poland, with the share of the top percentile slightly above 8 per cent (Figure 1). There are several arguments in favour of the lower top shares in the first half of the 1920s. First, Poland was among countries that suffered greatest losses during the First World War, both in the number of human casualties as well as in the extent of physical de-struction. The level of industrial production in 1919 was less than 15 per cent of its 1913 level (Landau 1968). Deleterious effects of exogenous shocks to capital income in the interwar period are now well documented as the single most important reason behind the secular fall in top incomes
34 In the same manner, the recovery of food imports with the seizure of Romania in 1918 might have alleviated the
pressure on food prices (Ritschl 2005). Note in this respect a surge in top income shares in neutral countries during WW1, such as Netherlands, Denmark or Sweden, who directly benefited from the boom in international food and commodity prices.
21
initiated after the First World War (Piketty 2001; 2003; Scheidel 2017). One should add on top of that a tremendous effort of German and Russian troops in dismantling factories during their re-spective retreats (Davies 2005; Landau 1968).35 The Polish-Soviet war of 1919-1920 further dis-rupted the industrial production and broke the supply chains (Landau and Tomaszewski 1984). Second, the risk of political radicalization and the communist upheaval pressured the new leader-ship of Poland into passing the new social legislation, such as eight-hour working day, trade unions or right to strike (Sztrum de Sztrem 1922; Derengowski 1930; Wolf 2007). Further, various anti-capital policies were introduced, including the land reform, a sharp increase in tax progressivity36
and heavier taxation of capital than labour.37 Industrial capital tied in export sectors especially
suffered from the loss of the large and protected Russian market38 and the Polish-German trade
war of 1925. The currency stabilization in 1923 further negatively affected the international com-petitiveness of Polish products (Landau and Tomaszewski 1985, p. 77), while another great shock was hyperinflation.39 Generally speaking, the post-war situation worldwide signified altogether a new page in the distributional history in comparison to the pre-WW1 political and social setting (e.g., Piketty 2014, Scheve and Stasavage 2016, Milanović 2016, Scheidel 2017).
The following six years, however, saw a continuous rise in the top percentile share and reached almost 11 per cent in 1930. The economy eventually stabilised in 1926, and the country experi-enced three years of steady growth, halted only by the advent of the Great Depression in 1929. The economic recovery brought better prospects for top incomes, which experienced an immediate improvement in 1926.40 One important external event was the strike of British miners in 1926,
35 For example, German army transferred complete factories from Łódź to Germany (Davies 2005, p. 130).
36 The top marginal rate of the income tax had equaled 5% in pre-WW1 Austria and 4% in Prussia (while in Russia
the income tax had never been introduced). In contrast, the top marginal rate on rate in interwar Poland was 40% on unearned income and 25% on earned income.
37 The cabinet of the Prime Minister Władysław Grabski (1923-1925) launched a whole set of stabilization policies
placing the largest burden of their financing on the wealthy.
38It was especially the industry of the former Russian partition, which exported as much as 90 per cent of its products
to Russia before WWI (Landau and Tomaszewski 1985, Tab. 1.1, 1.2). The Polish-Soviet war of 1919-1920 further disrupted the industrial production and broke the supply chains (Landau and Tomaszewski 1984).
39 However, there has been surprisingly little research done on the distributional effects of the Polish hyperinflation,
and its effects remain ambiguous (in particular between the post-war creeping inflation and the hyperinflation of 1923/4). As an exception see Van Thadden (1995), who sees Polish inflation as beneficial to the post-war reconstruc-tion via redistribureconstruc-tion of wealth towards industrialists, first from wage earners (1918-21) and then from agriculture (1921-23) (1995, pp.116-17).
40 The consensus of historians has been that the May coup in 1926 was not motivated by the class struggle (Landau
22
leading to the rise in coal prices, which stimulated Polish coal exports. Figure 3 shows the evolu-tion of the average income of three top income groups constituting the top percentile together with the total average income during the interwar period. It can be seen that the period between 1926 and 1929 was characterised by the substantial increase in top income shares which outstripped the overall income rise. While the economic growth saw an improvement of conditions for all income groups, the rich benefited proportionally more (Landau and Tomaszewski 1985, p. 81).
However, when the tax data become available in 1935, the series on top income shares re-emerge at 15 per cent, which corresponds to its secular peak in the time of peace. All top income groups saw rising shares in this period, suggesting a rising dispersion between the top and the rest of the distribution (e.g. P0-99), rather than within top income groups (see Table A2). Accordingly, it is plausible that this development indicates a deteriorating position of Polish farmers relative to other social groups. Almost two-thirds of the population was made of small farmers and peasants and it was agriculture that was most adversely affected by the Great Depression, in the first place due to a strong fall in agricultural prices. In contrast, the fall in industrial prices was much less steep due to rapid cartelization, which safeguarded industrial profits at the top.41 For example, prices of ag-ricultural products in 1935 were only 33 per cent of their 1928 level, those of industrial goods were 57 per cent, while prices of cartelized products stood at 82 per cent (Landau and Tomaszewski 1985, Tab. 2.6).Consequently, between 1929 and 1934, the rural population’s share in national income fell from 46.7 to 39.5 per cent (Landau 1963, p. 37). The deflationary trend was, on the other hand, beneficial to high-salaried employees that were able to keep their job due to rigid salaries, making this group relative winner behind this development (Landau 1933).42
As can be seen in Figure 3, the Great Depression led to differential income fall for different top groups. The top 0.1 per cent saw a proportionally stronger fall at the start of the crisis (1929-1931) than the lower groups in the top percentile – following on the higher relative growth of the top 0.1 in the late 1920s. Yet, in 1935 (unfortunately, there is no data for three years after 1931) we find
41 Rough estimates indicate that cartels controlled more than a half of the industrial output in the 1930s (Landau 1978). 42 Kalecki and Landau (1935, p. 450) estimated that between 1929 and 1933 incomes of manual workers halved, while
incomes of white-collar workers fell by 30 per cent. A rise of inequality is obvious if we take those recently unem-ployed as having zero wage income. For those that kept their job, we observe a sharp increase in the earnings disper-sion (see Figure 8 below).
23
that top groups had managed to retain its relative standing, coming out from the crisis unscratched. On the other hand, the average nominal income (P0-100) almost halved in the decade after 1925. The real mean income of top groups actually increased strongly during the crisis. Plausibly, the rapid cartelization should be identified as the main tool allowing top incomes to steer the crisis successfully, and the main beneficiaries should be searched among the capital income recipients, as we look next.
Figure 4 shows the composition of top income groups in 1929 between earnings and other sources of income (defined in the tax statistics as ‘unearned’ income, roughly corresponding to the broad definition of capital income). Groups below the top percentile, such as the top 5-1 per cent, were dominantly composed of earnings. The importance of earnings, however, decreases with income rank. For the top 0.1 per cent group, for example, unearned income made as much as 80 per cent of the income, while earnings accounted for only 20 per cent of the total income. Although the proportion of earnings increased for top groups during the Great Depression (Figure A7)—thus confirming our hypothesis that top salaries relatively benefited in the depression—top incomes still predominantly derived the bulk of their income from other-than-employment activities.
Further insights could be obtained by looking at the spatial distribution of county-level top income shares in Poland.43 Figure 5 presents the map of Polish counties in 1927 and county-level top 1% income shares (calculated using county control population and total county income). The dashed line marks the former borders between the partitions. The geographic distribution of top income shares has a donut-shape, with high levels at the edges of the interwar Poland and relatively low in the centre. The largest inequalities are in the former Prussian Partition (the west) and the eastern parts of the former Russian Partition (the east). The picture is less clear for the former Austrian Partition (the south and south-eastern parts), where there are no clusters of counties with high top income shares. Figure 6 displays a contribution of each county to the aggregate top 1% income. The map is almost a reverse of the previous one. The most developed counties from Silesia and the core of the former Russian Partition (Warszawa, Łódź) contribute the most to the aggregated top incomes. At the same time, these regions show comparatively lower top income shares.
24
Figure 3 : Evolution of average income of groups within the top percentile
Source: authors’ computations based on the income tax data.
Figure 4: The composition of the top 5 per cent, Poland in 1929
Source: authors’ computation based on income tax statistics and Wiśniewski (1934). 50 70 90 110 130 150 170 190 1925 1926 1927 1928 1929 1930 1931 1932 1933 1934 1935 1936 N om inal m ean inc om e (1925= 100) P99.9-100 P99.5-99.9 P99-99.5 P0-100 0% 10% 20% 30% 40% 50% 60% 70% 80% 90% 100% P95-99 P99-99.5 P99.5-99.9 P99.9-99.99 P99.99-100 Top income groups
25 Figure 5: County-level top 1% income share
Source: authors’ computation (see Appendix 1.4).
Figure 6: County-level contribution to the aggregate top 1% income.
26
Table 2: County-level regressions of the top 1% income share
Top 1% Income Share
Partition: All Prussian Russian Austrian
(1) (2) (3) (4) (5) (6) (7) (8)
Income per capita -1.79*** -3.17*** 2.25* 2.66* -0.50 -0.33 -4.59*** -4.15*** (0.61) (1.13) (1.13) (1.40) (0.64) (0.71) (0.70) (0.76) Urbanization 1.47*** 1.19*** 1.80*** 1.67** 0.19 0.17 2.61*** 0.80 (0.41) (0.41) (0.65) (0.81) (0.66) (0.74) (0.56) (0.95) Share of agr. workers 1.80*** 1.92*** 1.13* 1.29** 1.29** 1.55* -0.24 -0.30 (0.36) (0.36) (0.61) (0.53) (0.63) (0.80) (1.07) (1.02) Share of ind, workers 1.57*** 1.59*** -0.82 -1.39 0.95 1.11 1.99*** 2.05*** (0.47) (0.50) (1.07) (1.31) (0.69) (0.87) (0.71) (0.75) Literacy rate 0.23 0.08 -1.22 -1.69 1.23 1.27 0.03 0.07 (0.46) (0.52) (4.30) (4.00) (0.91) (0.96) (0.49) (0.54) Land Gini 0.44* 0.44** 1.44*** 1.39*** 1.13*** 1.16*** -0.37 -0.35 (0.23) (0.21) (0.47) (0.44) (0.35) (0.37) (0.30) (0.31) Unconditional mean 10.43 10.43 12.53 12.53 9.45 9.45 10.48 10.48 (3.57) (3.57) (3.65) (3.65) (3.24) (3.24) (3.39) (3.39) R-squared 0.47 0.49 0.62 0.67 0.32 0.34 0.56 0.60 Counties 245 245 52 52 119 119 74 74 Religious composition No Yes No Yes No Yes No Yes Regional FE Yes Yes Yes Yes Yes Yes Yes Yes
Note: the table shows correlations from a regression of county-level top 1% income share on income per capita, urbanization rate (share of population living in cities), share of agriculture workers in total employment, share of industrial workers in total employment, literacy rate (share of people who can read and write), Gini coefficient of land ownership, and shares of various religious groups (i.e. Catholics, Protestants, Judaists, Eastern Orthodox and Greek-Catholics). In addition, seventeen regional fixed effects (województwo) are included. See Appendix 1.4 for more on data sources. Robust standard errors in the parentheses. *** denotes significance at the 0.1% level, ** at the 1% level and * at the 5% level.
To shed light on the determinants of income inequalities in interwar Poland, we use the cross-sectional county-level data to regress the top 1% income share on a set of socio-economic variables, and controlling for 17 regional fixed effects. The analyzed counties were part of independent Poland in 1927, and thus were affected by the same country-level economic and political shocks, but had various institutional and legal heritage originating from the systems introduced by the pre-1918 Partition Empires. Table 2 presents correlations between the top 1% income share and income per capita, urbanization rate, the share of agriculture workers in total employment, the share of industrial workers in total employment, literacy rate and Gini of land
27
ownership; we run the regression for the total sample and separately for each partition. In addition, in some specifications we control for religious composition, as it is highly correlated with urbanization rate. In the total sample, we find that income per capita is negatively correlated with inequalities, however, the effect is heterogeneous across the former partitions: positive in the former Prussia, null in the former Russia and negative in the former Austria. One can interpret this pattern that the three regions were on different parts of the Kuznets’ curve, which is also in line with the positive effect of urbanization rate and the share of industrial workers in the Austrian parts. On the other hand, the positive effect of the share of agriculture workers in the Prussian parts, along with the positive effect of Gini of land ownership, are also consistent with the notion that capitalism in the Prussian parts of Poland was primarily connected with agriculture, and to lesser extent with industry. Interestingly, we do not find significant correlations between top 1% income share and literacy rates, conditional on other variables. Overall, the findings suggest that regional institutional heritage is important in shaping local inequalities.
3.3. World War II and the Communist accession to power
Right after the Second World War, in 1946-7, we find top income shares at the level of 9 per cent – a significant fall from the level of 14.6 per cent in 1936 (Figure 1). In order to understand the fall in top shares one needs again to ascertain a development at the ‘bottom’ of the distribution. The post-WW2 years saw thus a relative improvement in the living conditions of the rural population in comparison to the devastating experience of the Great Depression. This came about in the first place through rising prices of agricultural products, the large land redistribution, debt release and the new social legislation, such as the increased availability of education in the countryside (Landau and Tomaszewski 1985). In fact, the German occupation already brought about changes in the distribution of national income in favour of the rural population, primarily through the “reversal of price scissors” (ibid., p. 175).44
44 Of course, this relative improvement should not mislead us in idealizing the position of rural population during the
occupation. But, the rise in prices of farm products allowed certain surplus that implied a notable amelioration of farmers’ living standard in comparison to the 1930s. Further, Nazis also took measures in earnings equalisation, which basically implied a common immiseration and exploitation of all urban strata. Through the reduction of the skill dif-ferential, the Nazis also wanted to ensure higher accumulation funds (a policy later pursued by communists). The only evidence of top income patterns during the German Occupation is for the Protectorate of Bohemia and Moravia (No-vokmet 2018), pointing to a sharp rise of very top income shares (top 1% share and above), which was driven by a