HAL Id: hal-03095512
https://hal.archives-ouvertes.fr/hal-03095512
Submitted on 4 Jan 2021
HAL is a multi-disciplinary open access
archive for the deposit and dissemination of
sci-entific research documents, whether they are
pub-lished or not. The documents may come from
teaching and research institutions in France or
abroad, or from public or private research centers.
L’archive ouverte pluridisciplinaire HAL, est
destinée au dépôt et à la diffusion de documents
scientifiques de niveau recherche, publiés ou non,
émanant des établissements d’enseignement et de
recherche français ou étrangers, des laboratoires
publics ou privés.
Single-shot temporal characterization of ultrashort XUV
pulses
Charles Bourassin-Bouchet, Ludovic Chopineau, Cédric Bomme, Fabien
Quéré, Tatyana Sinyakova, Laila Dakroub, Denis Cubaynes, A Klisnick
To cite this version:
Charles Bourassin-Bouchet, Ludovic Chopineau, Cédric Bomme, Fabien Quéré, Tatyana Sinyakova,
et al.. Single-shot temporal characterization of ultrashort XUV pulses. X-Ray Lasers and Coherent
X-Ray Sources: Development and Applications XIII, SPIE Optics & Photnics, Aug 2019, San Diego,
United States. �10.1117/12.2533606�. �hal-03095512�
Single-shot temporal characterization of ultrashort XUV
pulses
Charles Bourassin-Bouchet
a, Ludovic Chopineau
b, C´edric Bomme
b, Fabien Qu´er´e
b, Tatyana
Sinyakova
c, Laila Dakroub,
c, Denis Cubaynes
c, and Annie Klisnick
ca
Laboratoire Charles Fabry, Institut d’Optique Graduate School, CNRS, Universit´e
Paris-Saclay, 91127 Palaiseau Cedex, France
b
LIDYL, CEA, CNRS, Universit´e Paris-Saclay, CEA Saclay, 91191 Gif-Sur-Yvette, France
cInstitut des Sciences Mol´eculaires d’Orsay (ISMO), CNRS, Univ. Paris-Sud, Universit´e
Paris-Saclay, F-91405 Orsay, France.
ABSTRACT
We report on the development and implementation of a diagnostic for the temporal characterization of ultra-short XUV pulses with a single-shot capability. The method which relies on laser-dressed photoionization in a home-made velocity map-imaging spectrometer was implemented on a HHG beamline based on a plasma mirror. Keywords: ultrashort pulses, extreme-ultraviolet, high-order harmonics generation, photoelectron spectroscopy, temporal metrology
1. INTRODUCTION
With the rapid development of ultrashort light sources in the extreme ultraviolet (XUV) spectral range, such as free-electron lasers,1 attosecond sources based on high-order harmonics generation (HHG),2,3 and XUV lasers
in the subpicosecond domain,4 the need for reliable, accurate and versatile characterization tools has increased
dramatically. The question of the characterization of the temporal pulse structure and duration is of particular importance as it constitutes the main advantage of these sources over conventional synchrotrons. Especially these ultrashort XUV sources are now widely used for fundamental studies in many di↵erent areas, and the XUV pulse temporal profile is an essential piece of information for understanding their interaction with matter. Moreover these sources can su↵er from shot-to-shot fluctuations or low repetition rates, forcing one to perform such a temporal characterization step in a single shot.
In the present proceeding, we report on the current progress in the development of a diagnostic for the temporal characterization of ultra-short XUV pulses with a single-shot capability. The method relies on laser-dressed photoionization in a home-made velocity map-imaging spectrometer. The diagnostic was implemented on a HHG beamline based on a plasma mirror.
2. THE SINGLE-SHOT APPROACH AND VMI 2.1 Laser-dressed photoionization
The chosen approach relies on a physical phenomenon called laser-dressed photoionization. This process is well-established for the temporal characterization of HHG-based attosecond sources, and is at the heart of tech-niques such as RABBIT (Reconstruction of Attosecond Beatings By Interference of Two-photon transitions),5
attosecond streaking,6 and FROG-CRAB (Frequency-Resolved Optical Gating for Complete Reconstruction of
Attosecond Bursts).7 Laser-dressed photoionization is also becoming more and more popular on free-electron
laser sources, see e.g. techniques like THz-streaking.8 The principle consists in focusing the XUV pulse to
char-acterize into a gas jet, which results in the photoionisation of the gas. Measuring the kinetic energy distribution of the photoelectrons provides a replica of the XUV spectrum. The spectral phase information, essential for
a complete temporal reconstruction of the pulse, is encoded in the photoelectron spectrum through the influ-ence of an external laser pulse synchronized with the XUV pulse. In historical techniques such as RABBIT or FROG-CRAB, this spectral phase information is encoded in a two-dimensional trace showing the evolution of the photoelectron spectrum with the laser/XUV delay. As changing the delay implies repeating the measurement with another XUV pulse, this approach must be excluded in the present case as we are seeking for single-shot XUV pulse reconstruction.
Instead, we have chosen to rely on the angular distribution of the photoelectrons. When photoionization occurs, electrons are emitted in all directions and form an expanding sphere of photoelectrons. Interestingly, the influence of the laser dressing field on these electrons varies with the scalar product between the electron momentum and the laser polarization axis. In other words, if a photoelectron is emitted perpendicularly to the laser polarization, it will feel almost no influence of the laser pulse, such that measuring its energy spectrum in this direction provides the laser-free spectrum. As the component of the electron momentum along the laser polarization increases, the influence of the laser dressing pulse becomes stronger. Therefore, measuring the photoelectron kinetic energy distribution in various directions almost amounts to scanning the laser intensity. Finally such measurement can be performed in one shot which makes it particularly suited to the present problem.
Sphere of photoelectrons
XUV pulse and laser pulse Gas jet 11 electrodes in "thick-lens" configuration Microchannel plates Repeller
Figure 1. Schematic (left) and picture (right) of the velocity map imaging spectrometer.
2.2 The Velocity map imaging spectrometer
Angular photoelectron distributions can be measured with an instrument called a velocity map imaging spec-trometer, the principle of which is summarized in Fig.1. The XUV and laser pulses are focused into a gas jet placed between two electrodes, called the repeller and the extractor, that are part of a 11 electrode assembly. The gas is injected by a polarized needle going through a 3 mm hole in the repeller. When photoionization occurs in the gas jet, the intense electrostatic field produced by the electrodes projects the sphere of photoelectrons onto a position sensitive detector, which provides an image of the photoelectron angular distribution. The detector is composed of a single microchannel plate (MCP), or a stack of two MCPs, coupled to a phosphor screen to amplify and convert the electron signal into visible light which is finally observed by a CCD camera. The 11 electrode assembly was mounted in “thick lens” configuration.9 in order to maintain a good energy resolution over a broad
kinetic energy range (⇠ 0 - 100 eV in our case). The VMI was designed using a trajectory simulation of charged particles with the SIMION software. It was assembled at ISMO in 2018 and commissioned with a plasma-based XUV laser (LASERIX facility, LUMAT, Universit´e Paris-Sud). This instrument is intended to become a mobile diagnostic that can be mounted on existing XUV beamlines to characterize the temporal properties of their pulses.
3. EXPERIMENT ON A HIGH-HARMONIC SOURCE BASED ON A PLASMA MIRROR
3.1 High harmonic generation on a plasma mirror
We implemented the VMI on a high-order harmonics source based on a plasma mirror. In these sources, a prepulse first creates a plasma at the surface of a solid target, then the interaction of the plasma with a second more intense laser pulse results in the emission of odd and even high-harmonics in the specular direction. The exact generation mechanism depends on the laser intensity at focus. For intensities comprised between 1016and
1018W/cm2, harmonics are obtained through a process called coherent wake emission. Beyond 1019W/cm2,
another mechanism called the relativistic oscillating mirror dominates. In theory both of these processes can deliver attosecond pulses. However no clear experimental demonstration has ever been performed, the most complete temporal measurement to date being reported in Ref.10
3.2 Experimental setup
Image of the laser focal spot in the center of the VMI
100 µm
Objective
Figure 2. Experimental setup.
The experiment took place on the UHI100 laser of the LIDYL laboratory in CEA Saclay. This laser delivers pulses with an energy of 3 J/pulse and a duration of 25 fs, see Fig.2. The laser beam was first split into a driving beam for the generation of the high-order harmonics and the dressing beam for the photoionization measurement. As an additional constraint, the delay between the XUV and laser dressing pulses needed to be accurately controlled. Therefore we decided that both beams had to be reflected o↵ the same optical elements. Doing so, one limits the influence of the mechanical instabilities of the mountings on the laser/XUV delay. A mirror was manufactured with a step in its center in order to delay the outer part of the beam with respect to the inner part. These outer and inner beams were respectively dedicated to the generation of the high-order harmonics and to the laser dressing of the photoionisation. A CaF2 plate was placed on the path of the inner
beam, so that tilting the plate enabled one to vary the relative delay between the beams. Both beams were then focused onto the solid target with the help of an o↵-axis parabola.
After the generation of the XUV radiation, the intensity of the driving beam had to be reduced as much as possible without blocking the produced XUV beam nor the laser dressing beam. First a pinhole was used to block the most diverging part of the driving beam. An aluminum foil placed behind the pinhole filtered out the remaining part of the driving beam, while a small hole in the filter allowed the transmission of the laser dressing beam. A grazing incidence ellipsoidal mirror then refocused the XUV and dressing pulses inside the sensitive region of the VMI. Finally an optical system was used to obtain an image of the laser focal spot onto a CCD. This system allowed us to control the spatial overlap between the XUV and laser beams in the interaction region of the VMI. It also enabled us to verify the temporal overlap between the dressing beam and the unblocked driving beam by observing the interference between the two beams when scanning the delay. From this measurement, we estimated that this relative delay could be controlled with an accuracy of the order of 100 as.
4. EXPERIMENTAL RESULTS 4.1 Results without the dressing laser pulse
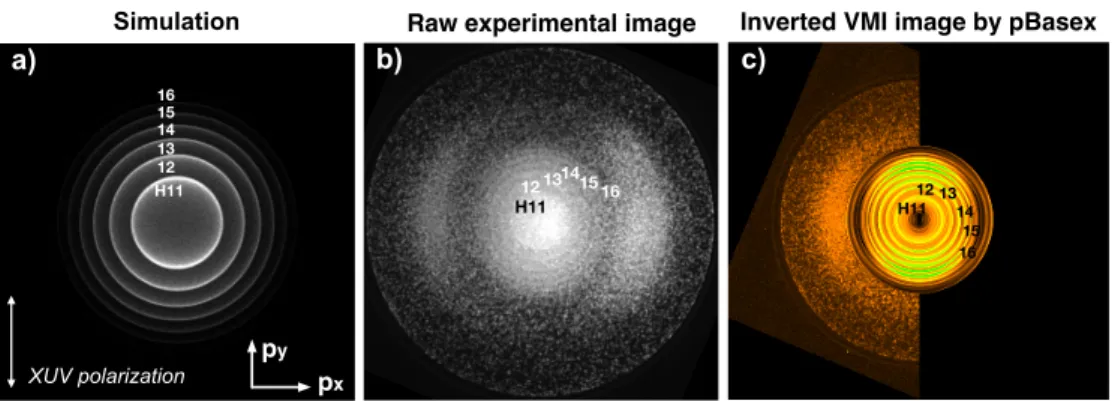
Raw experimental image Inverted VMI image by pBasex
H1112 13 1415 H1112 1314 15 16 16 Simulation H11 12 13 14 15 16 XUV polarization a) b) c) px py
Figure 3. a) Simulation of the expected projection of the angular photoelectron distribution. The concentric rings correspond to harmonics 11 to 16. b) Experimental image obtained in the same conditions as a). c) Central slice of the sphere of photoelectrons retrieved from the projected distribution in b) with the pBasex software.
As a first step, only the XUV beam was sent into the VMI. Figure3a) shows the projection of the photo-electron angular distribution expected in the VMI using an argon gas jet. It is composed of concentric rings corresponding to harmonics H11 to H16. These rings are also visible on the experimental image, which confirms the efficient transport of the XUV beam to the VMI. As this is a projection of the sphere of photoelectrons, it needed to be processed to recover the corresponding central slice of the sphere of photoelectrons. Using the pBasex algorithm11, the image shown in Fig.3c) was obtained where the high-harmonics become clearly visible.
Remarkably, this experimental image was obtained in a single XUV shot. The ability of the VMI to capture angular distributions in a single shot was a matter of concern during the design of the device. Especially the level of signal required to make an image constituted the main uncertainty. Therefore the image shown in Fig.3c) represents an achievement in itself.
4.2 Results with the dressing laser pulse
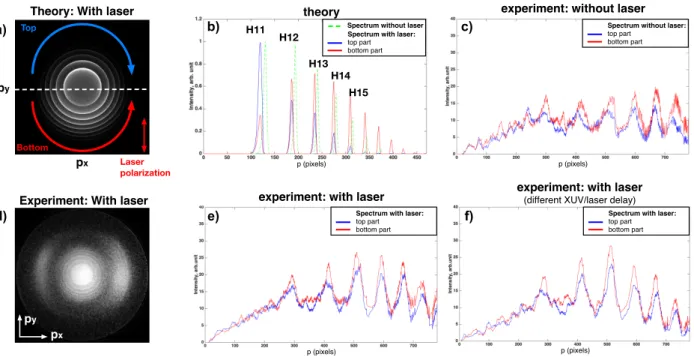
Figure4a) shows a simulation of the projected sphere of photoelectrons in argon in the presence of the dressing pulse with an intensity of 4 TW/cm2. An asymmetry is clearly visible between the upper and lower parts of the
image for the chosen XUV/laser delay. This is confirmed if integrating angularly each half image, as illustrated by the red and blue arrows. Indeed the resulting angularly-averaged spectrum from the top part becomes narrower while its bottom counterpart broadens, see Fig.4b). This trend reverses when the laser/XUV delay is scanned over a period of 1.3 fs, that is half of the period of the laser electric field, and comes back to the distribution shown in Fig.4b) when the delay reaches 2.6 fs. Moreover one can notice that the harmonics are slighted shifted toward lower momentum values compared the spectrum obtained in the absence of the dressing pulse. This shift
Experiment: With laser
px
py
experiment: without laser Spectrum without laser:
top part bottom part
experiment: with laser Spectrum with laser:
top part bottom part
experiment: with laser
(different XUV/laser delay) Spectrum with laser:
top part bottom part
Laser polarization Theory: With laser
px
py
Bottom
Top H11
theory
Spectrum without laser Spectrum with laser:
top part bottom part H12 H13 H14 H15 a) b) c) d) e) f) p (pixels) p (pixels) p (pixels) p (pixels)
Figure 4. a) Simulation of the expected projection of the angular photoelectron distribution in the presence of the dressing pulse. Each half image is averaged angularly, resulting in the red and blue spectra in b) where p denotes the radial momentum. The green curve represents the simulated spectrum without dressing pulse. c) Spectra obtained through angular integration of the experimental image without dressing pulse. d) Experimental image obtained with dressing laser pulse and e) the corresponding angularly averaged spectra. e) For comparison, the spectra are also shown for another laser/XUV delay.
is due to the ponderomotive e↵ect induced by the intense dressing field on the electrons. The angular integration procedure is applied to the experimental image obtained without dressing pulse and previously shown in Fig.3, which provides the two reference spectra in Fig.4c). As no laser dressing pulse is used, the top and bottom spectra behave identically.
We then added the dressing laser pulse in the VMI. The intensity at focus was of the order of 2·1013TW/cm2,
which is five times larger than the intensity used for the previous simulations. This should in principle lead to an unambiguous influence of the dressing pulse on the photoelectron angular distribution. The obtained experimental image is depicted in Fig.4d) and the corresponding angularly integrated spectra for two di↵erent laser/XUV delays are shown in Fig.4(e-f). Although simulations predicted a clear broadening or narrowing of the spectra, no such behaviour can be noticed in practice. This conclusion may not be definitive as a careful analysis of the data is still in progress.
5. CONCLUSION
In conclusion, we have developed a diagnostic for characterizing the temporal structure of ultrashort XUV pulses in a single-shot. The technique relies on laser-dressed angularly-resolved photoionization spectroscopy in a home-made velocity map imaging spectrometer. The device was tested on high-order harmonics source based on a plasma mirror. Angular photoelectrons distributions were successfully measured in a single XUV shot. However the influence of the laser-dressing pulse could not be observed, preventing so far a complete temporal measurement.
REFERENCES
[1] P. Emma et al. First lasing and operation of an ¨angstrom-wavelength free-electron laser Nat. Photon. 4, 641-647 (2010).
[2] Mc Pherson et al. Studies of multiphoton production of vacuum-ultraviolet radiation in the rare gases J. Opt. Soc. Am. B 4, 595-601 (1987).
[3] C. Thaury et al. Plasma mirrors for ultrahigh-intensity optics Nat. Phys. 3, 424-429 (2007).
[4] A. Depresseux et al. Table-top femtosecond soft X-ray laser by collisional ionization gating Nat. Photon. 9, 817-821 (2015).
[5] P. Paul et al. Observation of a train of attosecond pulses from high harmonic generation Science 292, 1689-1692 (2001).
[6] M. Hentschel et al. Attosecond metrology Nature 414, 509-513 (2001).
[7] E. Goulielmakis et al. Single-cycle nonlinear optics Science 320, 1614-1617 (2008).
[8] I. Grguras et al. Ultrafast X-ray pulse characterization at free-electron lasers Nat. Photon. 6, 852-857 (2012). [9] N.G. Kling et al. Thick-lens velocity-map imaging spectrometer with high resolution for high-energy charged
particles J. Inst. 9, P05005 (2014).
[10] Y. Nomura et al. Attosecond phase locking of harmonics emitted from laser-produced plasmas Nat. Phys. 5, 124-128 (2009).
[11] Gustavo A. Carcia, Laurent Nahon and Ivan Powis Two-dimensional charged particle image inversion using a polar basis function expansion Rev. Sci. Inst. 75, 4989-4996 (2004).