HAL Id: hal-00298099
https://hal.archives-ouvertes.fr/hal-00298099
Submitted on 6 Feb 2008
HAL is a multi-disciplinary open access
archive for the deposit and dissemination of
sci-entific research documents, whether they are
pub-lished or not. The documents may come from
teaching and research institutions in France or
abroad, or from public or private research centers.
L’archive ouverte pluridisciplinaire HAL, est
destinée au dépôt et à la diffusion de documents
scientifiques de niveau recherche, publiés ou non,
émanant des établissements d’enseignement et de
recherche français ou étrangers, des laboratoires
publics ou privés.
On the quality of climate proxies derived from
newspaper reports ? a case study
D. Gallego, R. García-Herrera, R. Prieto, C. Peña-Ortiz
To cite this version:
D. Gallego, R. García-Herrera, R. Prieto, C. Peña-Ortiz. On the quality of climate proxies derived
from newspaper reports ? a case study. Climate of the Past, European Geosciences Union (EGU),
2008, 4 (1), pp.11-18. �hal-00298099�
www.clim-past.net/4/11/2008/
© Author(s) 2008. This work is licensed under a Creative Commons License.
of the Past
On the quality of climate proxies derived from newspaper reports –
a case study
D. Gallego1, R. Garc´ıa-Herrera2, R. Prieto3, and C. Pe ˜na-Ortiz1
1Dpto. de Sistemas F´ısicos, Qu´ımicos y Naturales. Universidad Pablo de Olavide. Ctra. de Utrera Km 1, 41013 Sevilla, Spain 2Departamento de F´ısica de la Tierra, Astronom´ıa y Astrof´ısica II, Facultad de Ciencias F´ısicas, Universidad Complutense de Madrid, Ciudad Universitaria, 28040 Madrid, Spain
3CRICYT Instituto de Nivolog´ıa, Glaciolog´ıa y Ciencias Ambientales (IANIGLA), Calle Bajada del Cerro s/n, Parque Gral. San Mart´ın, Mendoza, Argentina
Received: 6 August 2007 – Published in Clim. Past Discuss.: 13 August 2007
Revised: 13 November 2007 – Accepted: 28 November 2007 – Published: 6 February 2008
Abstract. One of the main problems in climate
reconstruc-tion from documentary sources is the evaluareconstruc-tion of the qual-ity of non instrumental meteorological records in absence of instrumental observations to perform a calibration. In these cases it is mandatory to envision different approaches to as-sess the climatic signal in a reconstruction. This work is aimed to test the consistency of a snow frequency recon-struction in the central Argentinean Andes by studying the synoptic patterns related to the occurrence of precipitation in this area. While the original reconstruction covers the period between 1885 and 1996, the insufficiency of over-lapping instrumental data limited the calibration to a short 15-year interval. In this paper we evaluate the performance of the reconstructed series for the entire 45-year period be-tween 1958 and 1996 by analyzing the displacement in the jet stream and the patterns of geopotential height related to anomalies in the reconstructed snow frequency series. Previ-ous works have linked the precipitation in the central Andes to the ENSO through the Pacific South American mode. We also have found this connection between ENSO and the re-constructed precipitation. Finally, it is shown that the ENSO relationship is the cause of a significant link between the pre-cipitation anomalies in the central Argentinean Andes and the ice extent around the Antarctic Peninsula.
Correspondence to: C. Pe˜na-Ortiz
1 Introduction
It is widely accepted that documentary sources can provide high quality information on past climate (Brazdil et al., 2005; Bradley and Jones, 1992). Newspapers can be an excellent source of early high-resolution data due to its periodic nature (Gallego et al., 2007). In addition, they usually give spe-cial treatment to extreme events with a big economic or so-cietal impact, such as the occurrence of hurricanes, droughts or floods (Chenoweth, 2006; Garcia-Herrera et al., 2005). However, despite this potential, the use of the information contained in newspapers has some potentially serious draw-backs. The transcribed data are usually taken and handled by nonprofessional meteorologist and they can be difficult or even impossible to calibrate with independent contemporary sources. Additionally, non climatic biases due to undocu-mented changes in location, observer or simply changes in the editorial board can occur in long series. Currently, the use of newspaper reports is still marginal in climate studies and the experience accumulated for this kind of proxy data is still short. In consequence, the quality of the resulting prox-ies is still subject to a close scrutiny.
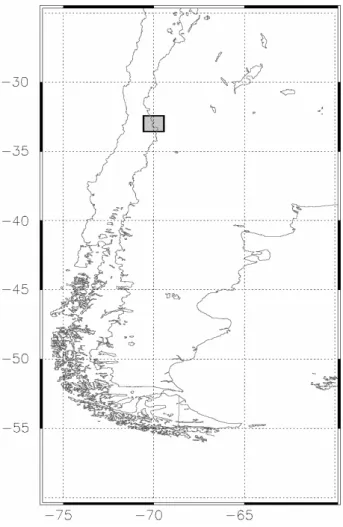
One of the longer meteorological records extracted from newspaper up to date was developed in 2001 by Prieto et al. (2001a) The series provides information since 1885 on snow episodes blocking the transandean road traffic (a proxy of precipitation) in the central Andes at the Argentinean side of the Chile-Argentina frontier close to the 33◦S latitude
(Fig. 1). The area is especially relevant from a climatic point of view. First, the series is representative of the occurrence of precipitation in an area larger than that limited by the square on Fig. 1, due to the homogeneity of the precipitation regime
12 D. Gallego et al.: On the quality of climate proxies
Fig. 1. Location of the snow frequency series. The rectangle comprises the four different sites where the snow occurrence was recorded.
along the South American band between 30◦S and 40◦S
(Vargas and Compagnucci, 1985). Second, the precipitation in this part of the world is known to be strongly linked to the El Ni˜no / Southern Oscillation (ENSO) with large precipita-tion increases during warm events (Aceituno, 1988; Rutllant and Fuenzalida, 1991; Montecinos et al., 2000; Haylock et al., 2006). And finally, the shortage of continuous precipi-tation instrumental records at daily scale in the area makes particularly interesting the finding of new sources of infor-mation for this variable and site.
The lack of comparable precipitation records in the area adds interest to the Prieto et al. (2001a) reconstruction, but it made nearly impossible its direct calibration, which orig-inally had to be limited to a comparison with instrumental precipitation for a short 15-year period. The result of the cal-ibration was very promising (correlation of +0.84; p<0.01) but testing the consistency of the series over longer periods would be desirable. During the last six years, no new instru-mental data suitable to perform a new calibration have
become available in the area, but the general understanding of several structures related to precipitation in South Amer-ica have experienced notable advances. Locally, a better knowledge of the large scale atmospheric influences for the snow variations in the central Argentinean Andes have been achieved (Masiokas et al., 2006; Falvey and Garreaud, 2007). From a global point of view, new databases concerning the dynamics of the Southern Hemisphere (SH) have been re-leased as is the case of a daily climatology of the SH jet streams (Gallego et al., 2005) or a comprehensive ice cov-erage database around Antarctica (Raynier et al., 2003). In addition, a significant advance in the SH climatology and in particular in the global ENSO impacts over the Southern Oceans has been made (Yuan, 2004; Simmonds and King, 2004; Liu et al., 2004; Campetella and Possia, 2007), open-ing new possibilities to test the performance of the Prieto et al. (2001a) reconstruction not by using a direct comparison with precipitation, but indirectly though the assessment of the expected atmospheric patterns related to ENSO and pre-cipitation occurrence.
The main objective of this paper is to test the consistency of the reconstruction of Prieto et al. (2001a) for a longer pe-riod than the original calibration by studying the synoptic patterns related to the occurrence of precipitation. In ad-dition, the progress made during the last years in the con-ceptual model of the ENSO signature in several SH fields is used to explain a significant relationship found between the precipitation in the central Argentinean Andes and the exten-sion of the ice around the Antarctic Peninsula. The paper is organized as follows. Section 2 shows the details of the re-constructed precipitation series. Sects. 3, 4 and 5 describe the patterns related to anomalous precipitation for the tropo-spheric jet stream, sea level pressure (SLP) and the Antarctic sea ice extent respectively. Section 6 integrates the results from the different variables comparing them with similar re-sults found in the literature. Finally, Sect. 7 briefly discusses the importance of the study in the frame of the current ef-forts to better characterize the SH climate in preinstrumental times.
2 The reconstructed precipitation series
Because of the importance of the snow occurrence in the Pan-American Route connecting Santiago de Chile (Chile) and Buenos Aires (Argentina), since the late 19th century the snow frequency was carefully documented on a daily basis in a local newspaper called “Diario Los Andes”. Between 1885 and 1950 this newspaper published the meteorological in-formation supplied by the Trans-Andean Railway Company. Since the 1940’s, data from the Argentinean Weather Ser-vice and other official national serSer-vices were also included. The information published corresponds to snow occurrence at four nearby sites named “Las Cuevas”, “Puente del Inca”, “Punta de Vacas” and “Polvaredas” (all these locations are
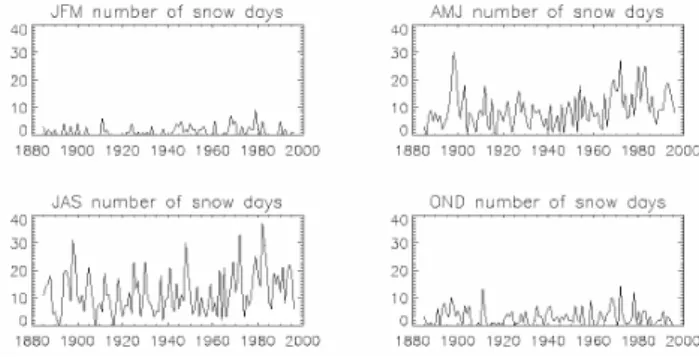
located inside the grey rectangle of Fig. 1). Their great ele-vation, above 3000 m a.s.l., causes that virtually all the pre-cipitation is recorded as snow, so the reconstructed series can be considered as a proxy for the precipitation frequency. The reconstructed snow frequency series (SF from now on) spans from 1885 to 1996 with no major gaps along the entire pe-riod. As stated in Sect. 1, the SF series is not the only source of meteorological information in the area. Instrumental data can be found, but they are extremely sparse and discontinu-ous. The first meteorological stations were installed in 1942 but they were removed in 1977. Moreover, the 1942–1960 data are very incomplete, and the only relatively continuous instrumental record spans from 1961 to 1976 which was the period used for the original calibration (Prieto et al., 2001a). Figure 2 shows the seasonal distribution of precipitation events along the study period. The area exhibits a rather dry climate with an average of 25 snow days per year. The pre-cipitation is largely seasonal, with a greater number of snow days recorded during autumn (AMJ) and winter (JAS), with 36.6% and 47.1% of the total snow days, respectively. Only 5.1% of the snow days occur during summer (JFM) while 11.2% are recorded during spring (OND). The large interan-nual variability is also evidenced in Fig. 2. A statistically significant trend toward more frequent snow days has been found (not shown), with an increment about 11 snowfall days per century (p<0.01) in the annual series, mainly due to in-crements of 5 snowfall days per century in the AMJ and JAS series (p<0.01 and p<0.05, respectively). After removing the seasonal cycle of the raw SF series, seasonal correlations between the SF anomalies and the SO index of Ropelewski and Jones (1987) for the 1885–1996 period yields a signif-icant negative correlations of −0.37 (p<0.01), peaking at
−0.42 (p<0.01) for winter (JFM), confirming the consistent
relationship between SF and the ENSO cycle described by Prieto et al. (2001b) for some extreme ENSO episodes based on the classical Quinn et al. (1987) ENSO chronology. In the following sections the synoptic implications of this relation for the precipitation season is investigated.
3 Observed changes in the tropospheric jet streams as-sociated to the SF
The role of the atmospheric upper level dynamics in the gen-eration of precipitation in subtropical South America has been well documented (Vuille and Ammann, 1997). In gen-eral, atmospheric instability in the region arises when anoma-lous cold air is advected toward subtropical latitudes at mid-and upper tropospheric levels. A number of cases correspond to the presence of a cut-off low aloft, but the recent climatol-ogy of Campetella and Possia (2007) found that the individ-ual number of these situations is very small over any par-ticular area of South America. From a more general point of view, the main driver of atmospheric instability leading to precipitation in subtropical to mid latitudes of South America
1 Fig. 2. Seasonal snowfall frequency (number of events).
is linked to the development of troughs in the subtropical jet stream (STJ) that only occasionally develop cut-off lows. In this regard, recently Gallego et al. (2005) built a climatology of the jet stream in the SH developing the first database both for the STJs and polar front jets (PFJ) location and strength at daily scale. The database covers the period from 1958 to 2002, thus providing a 39-year overlapping period (1958– 1996) with the SF series.
A complete description of the foundations of the jet cli-matology of Gallego et al. (2005) is beyond the scope of this paper but, briefly, the jet trajectory is related to the geostrophic streamline of maximum wind velocity at 200-hPa encircling the entire SH, providing its average velocity is at least 30 m·s−1. The 200-hPa NCEP-NCAR reanalysis
geopotential height (Kalnay et al., 1996) was used to com-pute the streamlines. Once these streamlines have been lo-cated, their path is assimilated to the jet stream current, be-ing denoted as STJ or PFJ dependbe-ing of its average latitude. The apparent hard restrictions of the assimilation of the jet stream to geostrophic streamlines proved to be not a strong limitation when describing the highly zonal SH circulation and the method provides similar results when compared with the usual jet definition based on the average zonal wind ve-locity. In particular, the split jet structure over the Southern Pacific (Bals-Elsholz et al., 2002; Orlansky et al., 1991) is very precisely described, yielding a direct estimation of the latitude and wind strength associated to each jet at every lon-gitude at a daily scale. Therefore, this climatology consti-tutes a very powerful tool to compare the subtle jet changes characterizing different atmospheric conditions related to the occurrence of precipitation in the SH.
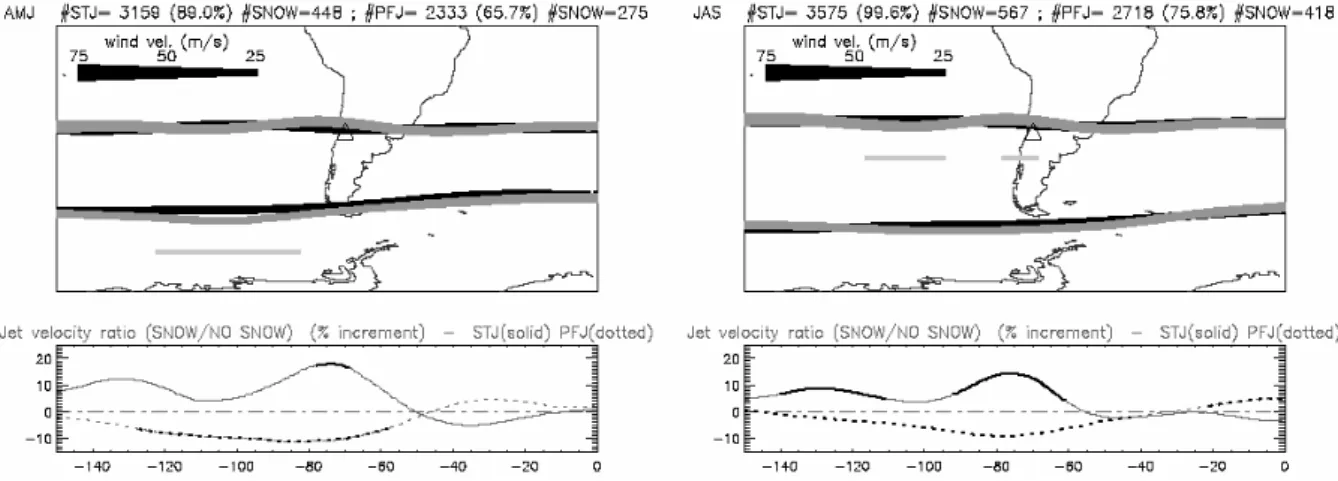
Figure 3 shows the differences in the jet path and velocity for snow (grey line) / no snow (black line) days from the SF series during winter and autumn over the Pacific and the West Atlantic sectors for 1958–1996. The significance of the dif-ferences in latitude and strength of the jet stream have been assessed by a Montecarlo test based in the use of 2500 ran-domly generated series of snow occurrence forced to follow the same observed distribution. The STJ clearly exhibits a northward displacement of its average latitude during
14 D. Gallego et al.: On the quality of climate proxies
2
Fig. 3. Autumn (AMJ) and winter (JAS) jet path for the complete period 1958–1996 (black jets) and average jet path only for snow days
(gray jets). Gray line below each jet indicates 95% significant latitude differences between samples. The width of the jet line indicates its local velocity. Graphics below each map show the ratio between the jet velocity during snow days /all days for the STJ (solid line) and PFJ (dotted line) expressed as % of the average value for all days. Significant differences in this ratio are indicated by a broader line. The #STJ and #PFJ above each map indicates the number of detected jets in the study period (the percentage over the total of days expressed in brackets), while the number of snow days in the sample is indicated by the # SNOW number.
snow days, with the maximum displacement located slightly westward of the SF site. The changes in the average latitude are detectable but rather subtle. So, the average northward shift of the STJ reaches at most 1.9◦ in latitude at 75◦W
during AMJ and 1.1◦ during JAS. The latter displacement,
though lower, being statistically significant (p<0.05) due to the smaller variability of the STJ position during winter. Re-garding the PFJ, the snowfall days are characterized by a general poleward displacement of this jet over the east Pa-cific with maximum value, noticeable along its entire path but attaining its greater value upstream of the South Ameri-can continent, around 100◦W. The poleward displacements
of the PFJ reach up to 2.9◦in latitude during AMJ, while is
restricted to no more than 1.3◦during JAS at this longitude.
In addition to the deviations in the location of both jets, the results show important anomalies related to changes in the velocity of the jet core. The velocity increment for snow days expressed as percentage over the average value has been represented below the corresponding maps at each longitude. The larger anomalies are found over the central Argentinean Andes for the STJ. This jet reaches significant increments in its velocity up to 15% over the area during autumn and win-ter. A secondary maximum in the STJ velocity change can be seen about 130◦W. On the other hand, the PFJ exhibits
lower but significant changes of contrary sign relative to the STJ. The snowfall events occur under lower than average PFJ velocities, with the maximum signal around 75◦W and PFJ
velocities about 10% lower than average.
4 Geopotential height anomalies related to the SF
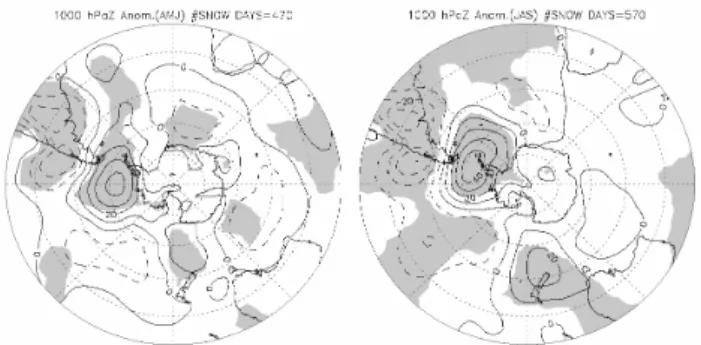
Figure 4 shows the geopotential height anomalies related to snow occurrence in autumn and winter based on the NCEP-NCAR reanalysis data for the same 1958–1996 period used to compute the jet stream changes described in Sect. 3. The significance of the differenced is based in the same Monte-carlo procedure used to test the jet stream differences. In gen-eral, the snowfall appears clearly related to a strongly nega-tive anomaly over the South Pacific with two main neganega-tive centers over the Central Pacific and the SF site in the cen-tral Argentinean Andes. On the other hand, it is evident a strong positive anomaly centered at 65◦W over the latitude
of the Antarctic Peninsula. This pattern of anomalies arching the South Pacific closely resembles the Pacific South Ameri-can (PSA) pattern (Carleton, 2003) but as expected, slightly biased toward the conditions most related to atmospheric in-stability in the SF site. Over the central Argentinean Andes, the 1000 hPa geopotential height anomaly reach −30 gpm in the winter averages while the anomalous anticyclonic cen-tre, located westward of the Antarctic Peninsula shows up to +40 gpm in excess of the average value during the entire cold season. The dipolar configuration of the geopotential height anomaly is significantly different of the average pat-tern (p<0.01).
5 Changes in the Antarctic Sea Ice related to the SF
During the last years, several papers have related the atmo-spheric temperatures and changes in the sea ice concentra-tion/formation around Antarctica with the atmospheric circu-lation in this area (Jacobs and Comiso, 1997; Renwick, 2002;
Raphael, 2007). In particular the area around the Antarctic Peninsula usually shows the larger and most consistent links with the atmosphere, especially those related to the ENSO (Harangozo, 2000; Liu, 2004). The same ENSO-related an-ticyclonic circulation around the Antarctic Peninsula associ-ated with ice edge anomalies is displayed during precipita-tion episodes in the SF series shown in Sect. 4. This fact strongly suggests the possibility of a teleconnection between the precipitation in this part of South America and the ice extent around large areas of the Antarctic coast through the combination of the anomalous surface heat flux and ice ad-vection. It must be pointed out that in this context, this tele-connection does not imply the influence of the Antarctic ice extent in the SF series but the simultaneous response of the ice edge and the SF to the same atmospheric ENSO forc-ing. This possibility has been addressed by using the 1.1 release of the Hadley Centre sea ice and sea surface tempera-ture database HadISST1.1 (Rayner et al., 2003). This dataset provides the percentage of sea surface covered by ice on a 1◦
×1◦global grid. Sea ice data in the SH crucially depend
on satellite retrievals and there are not continuous temporal series prior to 1973 in the Southern Ocean, apart of two at-las climatologies for the periods 1929–1939 and 1947–1962 which have not been used in this work. Sea ice concentration has been used to find, at each longitude, the limit of the sea ice or ice edge (IE), defined as the latitude of the northern-most 1◦
×1◦box with at least 15% of sea ice concentration
(White and Peterson, 1996; Jacobs and Comiso, 1997). A monthly series of the IE for each longitude at 1◦resolution
has been constructed for the 24-years long period between 1973 (the beginning of the IE series) and 1996 (the end of the SF series).
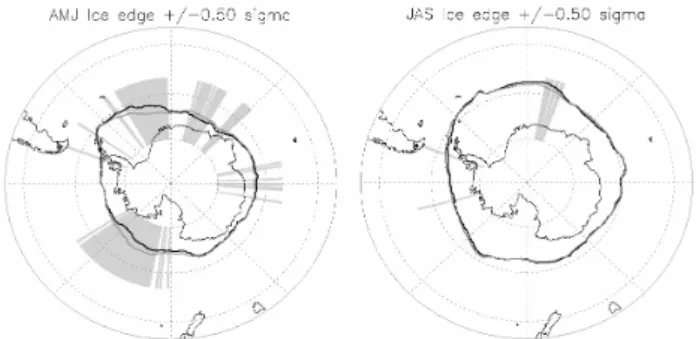
Figure 5 shows the IE composites for the years character-ized by low/high snowfall frequency, defined as those years below/above 0.5 standard deviation of the SF series for au-tumn and winter. As in previous sections, significance is based in a Montecarlo test. The SF series was randomly disarranged 10 000 times, comparing the corresponding IE anomalies with the true value at each longitude. A strong and distinctive signal around the Antarctic Peninsula is clearly displayed during autumn. The IE over the Weddell Sea is clearly northward displaced (up to 250 km) when a higher than average number of snow days are recorded in the SF site. On the contrary, along the Ross and Amundsen seas the IE anomaly shows opposite sign, with clear ice retreats on the more snowy years in the central Argentinean Andes. No significant anomalies in IE have been found over the Belling-shausen Sea. The possibility of a retarded ice formation re-sponse to the atmospheric circulation was assessed through seasonally lagged composites. The maximum response was always observed for the in-phase series, although a weaker but still significant IE response during JAS over the Amund-sen Sea to the SF of the previous season (AMJ) was detected (not shown).
2 Fig. 4. Autumn (AMJ) and winter (JAS) 1000-hPa geopotential
height anomalies (gpm) during snowfall days for the 1958–1996 riod relative to the corresponding seasonal average for the same pe-riod at 10 gpm intervals. Positive/negative anomalies are displayed with continuous/dashed lines. 99% significant differences with re-spect to the seasonal geopotential height average are shaded. The total number of snowfall days in the sample is displayed above each graph.
6 Summary and comparison with earlier works
The SF appears definitively linked to a noticeable northward shift of the STJ over the central Argentinean Andes. This as-sociation is a direct consequence of the ENSO signature in the subtropical latitudes of the Pacific described by Yuan et al. (2004). During a positive ENSO phase the enhanced con-vection in the Tropical Pacific increases and contracts the SH Hadley Cell over the Eastern Pacific, strengthening the STJ in the process, which at the same time, should be slightly but noticeably displaced equatorward. The shift in the jet drives the average storm track toward the equator, originating changes in precipitation related to El Ni˜no over several areas of South America (Aceituno, 1988; Montecinos et al., 2000). We found exactly this signal for the anomalously wet years described by the SF series. The STJ displacement is moder-ate but significant, with values in the order of 1.5◦of latitude,
being larger during autumn. In addition, the STJ shows con-siderably higher wind speeds during precipitation days, with increments of up to 15% relative to its average value over the precipitation site. The impacts of ENSO over poleward latitudes and the mechanisms modifying the polar jet are not as clearly established in the literature but apparently, the Fer-rel Cell is also enhanced in the eastern South Pacific during El Ni˜no, increasing in this area the heat transport toward the pole (Liu et al., 2002) and resulting in a poleward displace-ment and slight weakening of the PFJ over the Pacific. In consequence the ENSO related PFJ anomalies should be op-posite to that of the STJ (Chen et al., 1996). As in the previ-ous case, this behavior has been also found for the PFJ during the wet years described by the SF series.
One of the most widely accepted extratropical atmospheric patterns related to ENSO is the PSA mode (Mo and Ghil, 1987; Carleton, 2003). During an El Ni˜no Phase, lower
16 D. Gallego et al.: On the quality of climate proxies
2 Fig. 5. Autumn (AMJ) and winter (JAS) seasonal composites for the
IE during years of SF above/below the +0.5/−0.5 standard deviation (black/grey). Sectors with 95% significant difference are shadowed.
than average SLP values over subtropical South America and large areas of the Central Pacific are found due to the greater cyclone activity triggered by the changes in the STJ. This implies an enhanced blocking activity in the South Pa-cific around 60◦S (Renwick, 1998; Ribera and Mann, 2003),
being the SE Pacific area close to the Antarctic Peninsula one of the more actively blocked (Rutllant and Fuenzal-ida, 1991). The PSA signature in the SLP is evidenced as an arching negative-positive-negative pattern of SLP anoma-lies sustained by Rossby waves and expected to be related to increases in precipitation in the central Argentinean An-des. When computing the SLP patterns related to positive SF anomalies a signal very similar to the PSA is found. A dual low pressure center with the greater negative anomalies over the Central Pacific and the Andes is evidenced. On the contrary, the expected positive SLP anomaly related to the enhancement of the blocking episodes is also found centered at 60◦S and slightly westward of the Antarctic Peninsula.
The anomalous circulation at low levels around the Antarctic Peninsula linked to the blocking should imply the existence of a teleconnection between the precipitation in subtropical South America and the ice dynamics around the Antarctic Peninsula. Our results largely confirm this teleconnection, with positive precipitation anomalies in subtropical South America significantly linked to ice expansion/retreats to the east/west of the Antarctic Peninsula. The link is only signif-icant during autumn, suggesting that the effect of sensible heat fluxes related to the anomalous advection determines mainly the process of ice formation instead of its final ex-tension.
7 Discussion
Calibrating reconstructed meteorological series in absence of instrumental data is one of the most challenging tasks in pa-leoclimatology and usually makes necessary to envision new approaches to perform the evaluation of a reconstruction by alternative ways. When the original SF series was first pub-lished, the calibration had to be performed by using a very
short period. The nature of the original documents used to obtain the SF data, which rely on disperse information com-piled among local papers, recommended to extend the cali-bration period as much as possible.
Currently the studies based on instrumental records in South America have provided a comprehensive view of the dominant modes of atmospheric circulation and its implica-tions (Aceituno, 1988; Garreaud and Aceituno, 2001; Hay-lock et al., 2006; Mo, 2000; Renwick, 2002; Venegas et al., 2001; Renwick, 1998; Vera, 2003, among many oth-ers). In this way, while during the last years, no new in-strumental data for precipitation have become available to directly calibrate the SF series, the general understanding of several structures related to precipitation in this part of the world have experienced notable advances which have been exploited in this paper to evaluate how the SF responds to the main physical mechanisms leading to the precipitation variability. Though the method can not be regarded as a cal-ibration, it adds confidence to the reliability of the SF se-ries and, in addition, it provides a physical link between the reconstructed precipitation anomalies and the atmospheric variability.
Due to the secular shortage of climatological data in the SH the search for non instrumental proxy series in South America is especially relevant. A number of studies have produced long and reliable proxy records based on the estimated effects of climatic fluctuations over variables of the SH such as the tree growth rate (Villalba, 1994; Villalba et al., 2003; Bonisegna, 1988; Roig et al., 2000), oxygen isotope variations in ice cores (Bradley et al., 2003), lake sediments (Abbott et al., 2003; Marwan et al., 2003), among others. However higher resolution proxies as the SF series help to evaluate details hardly accessible otherwise. Proba-bly the best example is the subtle but significant changes in the STJ associated to precipitation events shown in Fig. 3. While this figure shows seasonal aggregates, the anomalies are computed at daily scale, otherwise the subtle signal would be lost in the process. Presently, the only source of meteorological reconstructions at daily or sub daily timescales are the documentary sources (Garcia-Herrera et al., 2003; Prieto et al., 1999; Prieto et al., 2000; Prieto, 2007). In this context the testing of the very scarce high frequency proxies available in South America is important because of their potential to be used jointly with natural proxies of lower resolution to build better multiproxies in the future. The result of this paper constitutes not only an exigent test of consistency of an existing series but an advance in understanding of the complex atmospheric mechanisms involved in its variability.
Edited by: H. Goosse
References
Abbott, M. B., Wolfe, B. B., Wolfe, A. P., Seltzer, G. O., Aravena, R., Mark, B. G., Polissar, P. J., Rodbell, D. T., Rowe, H. D., and Vuille, M.: Holocene paleohydrology and glacial history of the central Andes using multiproxy lake sediment studies, Palaeo-geogr. Palaeocl., 194, 123–138, 2003.
Aceituno, P.: On the functioning of the Southern Oscillation in the South American sector. Part I: Surface climate, Mon. Weather Rev., 116, 505–524, 1988.
Bals-Elsholz, T. M., Atallah, E. H., Bosart, L. F., Wasula, T. A., Cempa, M. J., and Lupo, A. R.: The wintertime Southern Hemi-sphere split jet: Structure, variability, and evolution, J. Climate, 14, 4191–4215, 2001.
Boninsegna, J. A.: Santiago de Chile winter rainfall since 1220 as being reconstructed by tree rings, Quaternary of South America and Antarctic Peninsula, 6, 67–87, 1988.
Bradley, R. S. and Jones, P.D. (eds): Climate Since A. D. 1500, Routledge, London, 679 pp., 1992.
Bradley, R. S., Vuille, M., Hardy, D., and Thompson, L. G.: Low latitude ice cores record Pacific sea surface temperatures, Geo-phys. Res. Lett., 30, 1174, doi:10.1029/2002GL016546, 2003. Brazdil, R., Pfister, C., Wanner, H., von Storch, H., and Luterbacher,
J.: Historical climatology in Europe – The state of the art, Cli-matic Change, 70, 363–430, 2005.
Campetella, C. M. and Possia, N. E.: Upper-level cut-off lows in southern South America, Meteorol. Atmos. Phys., 96, 181–191, 2007.
Carleton, A. W.: Atmospheric teleconnections involv-ing the Southern Ocean, J. Geophys. Res., 108, 8080, doi:10.1029/2000JC000379, 2003.
Chen, B., Smith, S. R., and Bromwich, D. H.: Evolution of the tro-pospheric split jet over the South Pacific Ocean during the 1986– 1989 ENSO cycle, Mon. Weather Rev., 124, 1711–1731, 1996. Chenoweth, M.: A reassessment of historical Atlantic basin
tropi-cal cyclone activity, 1700–1855, Climatic Change, 76, 169–240, 2006.
Falvey, M. and Garreaud, R.: Wintertime Precipitation Episodes in Central Chile: Associated Meteorological Conditions and Oro-graphic Influences, J. Hydrometeorol., 8, 171–193, 2007. Gallego, D., Ribera, P., Garc´ıa, R., Gimeno, L., and Hernandez,
E.: A new look for the Southern Hemisphere jet stream, Clim. Dynam., 24, 607–621, 2005.
Gallego, D., Garc´ıa-Herrera, R., Calvo, N., and Ribera, P.: A new meteorological record for Cadiz (Spain) 1806–1852: Im-plications for climatic reconstructions, Geophys. Res. Lett.,112, D12108, doi:10.1029/2007JD008517, 2007.
Garc´ıa-Herrera, R., Garc´ıa, R. R., Hern´andez, E., Prieto, M. R., Gi-meno, L., and D´ıaz, H. F.: Using Spanish archives to reconstruct climate variability, B. Am. Meteorol. Soc., 84, 1025–1035, 2003. Garc´ıa-Herrera, R., Gimeno, L., Ribera, P., and Hern´andez, E.: New records of Atlantic hurricanes from Spanish documen-tary sources, J. Geophys. Res.–Atmos., 110, D03109, doi: 10.1029/2004JD005272, 2005.
Garreaud, R. D. and Aceituno, P.: Interannual rainfall variability over the South American Altiplano, J. Climate, 14, 2779–2789, 2001.
Harangozo, S. A.: A search for ENSO teleconnections in the west Antarctic Peninsula climate in austral winter, Int. J. Climatol., 20, 663–679, 2000.
Haylock, M. R., Peterson, T. C., Alves, L. M., et al.: Trends in to-tal and extreme South American rainfall in 1960–2000 and links with sea surface temperature, J. Climate, 19, 1490–1512, 2006. Jacobs, S. S. and Comiso, J. C.: Climate variability in the
Amund-sen and BellingshauAmund-sen seas, J. Climate,10, 697–709, 1997. Kalnay, E., Kanamitsu, M., Kistler, R., et al.: The NCEP/NCAR
40-year Reanalysis Project, B. Am. Meteorol. Soc., 77, 437–471, 1996.
Liu, J., Yuan, X., Rind, D., and Martinston, D. G.: Mech-anism study of the ENSO and southern high latitude climate teleconnections, Geophys. Res. Lett., 29, 1679, doi:10.1029/2002GL015143, 2002.
Liu, J., Curry, J. A., and Martinson, D. G.: Interpretation of recent Antarctic sea ice variability,Geophys. Res. Lett., 31, L02205, doi:10.1029/2003GL018731, 2004.
Marwan, N., Trauth, M. H., Vuille, M., and Kurths, J.: Comparing modern and Pleistocene ENSO-like influences in NW Argentina using nonlinear time series analysis methods, Clim. Dynam.,21, 317–326, 2003.
Masiokas, M. H., Villalba, R., Luckman, B. H., Quesne, C., and Aravena, J, C.: Snowpack variations in the central Andes of Ar-gentina and Chile, 1951–2005: Large-scale atmospheric influ-ences and implications for water resources in the region, J. Cli-mate, 19, 6334–6352, 2006.
Mo, K. C.: Relationships between low-frequency variability in the Southern Hemisphere and sea surface temperature anomalies, J. Climate, 13, 3599–3610, 2000.
Mo, K. C. and Ghil, M. : Statistics and dynamics of persistent anomalies, J. Atmos. Sci., 44, 877–901, 1987.
Montecinos, A., D´ıaz, A., and Aceituno, P.: Seasonal diagnostic and predictability of rainfall in subtropical South America based on tropical Pacific SST, J. Climate, 13, 746–758, 2000.
Orlanski, I., Katzfey, J., Menendez, C., and Marino, M.: Simulation of an extratropical cyclone in the Southern Hemisphere: Model sensitivity, J. Atmos. Sci., 48, 2293–2311, 1991.
Quinn, H., Neal, V. T., and Antunez de Mayolo, S. E.: El Ni˜no occurrences over the past four and a half centuries, J. Geophys. Res., 92, 14 449–14 461, 1987.
Prieto, M. R., Herrera, R., and Dussel, P.: Historical Evidences of the Mendoza River Streamflow Fluctuations and their Relation-ship with ENSO, Holocene, 9, 473–481, 1990.
Prieto, M. R., Herrera, R., and Dussel, P.: Archival evidence for some aspects of historical climate variability in Argentina and Bolivia during the 17th and 18th centuries, Southern Hemisphere Paleo- and Neoclimates, edited by Volkheimer, W. and Smolka, P., Springer–Verlag, Berlin-Heidelberg, 381 pp., 2000.
Prieto, M. R., Herrera, R., Castrillejo, T., and Dussel, P.: Varia-ciones clim´aticas recientes y disponibilidad h´ıdrica en los Andes Centrales Argentino-chilenos (1885–1996), El uso de datos pe-riod´ısticos para la reconstituci´on del clima, Meteorol´ogica, 25, 27–43, 2001a.
Prieto, M. R., Herrera, R., Dussel, P., Gimeno, L., Ribera, P., Garcia-Herrera, R., and Hernandez, E.: Interannual oscillations and trend of show occurrence in the Andes region since 1885, Aust. Meteorol. Mag., 50, 164–168, 2001b.
Prieto, M. R.: ENSO Signals in South America: Rains and Floods in the Parana River during Colonial Times, Climatic Change, 83, 39–54, 2007.
Raphael, M. N.: The influence of atmospheric zonal wave three
18 D. Gallego et al.: On the quality of climate proxies
on Antarctic sea ice variability, J. Geophys. Res., 112, D12112, doi:10.1029/2006JD007852, 2007.
Rayner, N. A., Parker,D. E., Horton, E. B., Folland, C. K., Alexan-der, L. V., Rowell, D. P., Kent, E. C., and Kaplan, A.: Global analyses of sea surface temperature, sea ice, and night marine air temperature since the late nineteenth century, J. Geophys. Res., 108, 4407, doi:10.1029/2002JD002670, 2003.
Renwick, J. A.: ENSO-Related variability in the frequency of South Pacific Blocking, J. Climate, 126, 3117–3123, 1998.
Renwick, J. A.: Southern Hemisphere circulation and relations with sea ice and sea surface temperature, J. Climate, 15, 3058–3068, 2002.
Ribera, P. and Mann, M. : ENSO related variability in the South-ern Hemisphere, 1948-2000, Geophys. Res. Lett., 30, 1006, doi:10.1029/2002GL015818, 2003.
Roig, F., Quesne, C., Bonisegna, J. J., Briffa, K., Lara, A., Grudd, N., Jones, P., and Villagran, C.: Climate variability 50 000 years ago in mid-latitude Chile as reconstructed from tree rings, Na-ture, 410, 567–570, 2000.
Ropelewski, C. F. and Jones, P.D.: An extension of the Tahiti-Darwin Southern Oscillation Index, Mon. Weather Rev., 115, 2161–2165, 1987.
Rutllant, J. and Fuenzalida, H.: Synoptic aspects of the central Chile rainfall variability associated with the Southern Oscillation, Int. J. Climatol., 11, 63–76, 1991.
Simmonds, I. and King, J. C.: Global and hemispheric climate vari-ations affecting the Southern Ocean, Antarct. Sci., 16, 401–413, 2004.
Vargas, W. and Compagnucci, R.: Relaciones del regimen de pre-cipitacion entre Santiago de Chile y las series de la region Cordillerana, Geoacta, 13, 81–93, 1985.
Venegas, S. A., Drinkwater, M. R., and Shaffer, G.: Coupled oscil-lations in Antarctic sea ice and atmosphere in the South Pacific sector, Geophys. Res. Lett., 28, 3301–3304, 2001.
Vera, C.: Interannual and interdecadal variability of atmospheric synoptic-scale activity in the Southern Hemisphere, J. Geophys. Res., 108, 8077, doi:10.1029/2000JC000406, 2003.
Villalba, R.: Medieval warm epoch and the little Ice Age in South-ern South America, Climatic Change, 26, 183–197, 1994. Villalba, R., Lara, A., Boninsegna, J. A., Masiokas, M., Delgado, S.,
Aravena, J. C., Roig, F. A., Schmelter, A., Wolodarsky, A., and Ripalta, A.: Large-scale temperature changes across the South-ern Andes: 20th century variations in the context of the past 400 years, Climatic Change, 59 ,177–232, 2003.
Vuille, M. and Ammann, C.: Regional snowfall patterns in the high, arid Andes, Climatic Change, 36, 413–423, 1997.
White, W. B. and Peterson, R. G.: An Antarctic circumpolar wave in surface pressure, wind, temperature and sea ice extent, Nature, 380, 699–702, 1996.
Yuan, X.: ENSO-related impacts on Antarctic sea ice: a synthesis of phenomenon and mechanisms, Antarct. Sci., 16, 415–425, 2004.