Identification of quantitative trait loci for cold‐tolerance of photosynthesis in maize (Zea mays L.)
11
0
0
Texte intégral
(2) 1968 Fracheboud et al.. Fig. 1. RFLP linkage map based on the cross Ac76433Ac7729 and the allelic segregation of 132 loci in 233 S5 recombinant inbred lines. Loci names are on the right and cumulative distances in centimorgans on the left.. the cold tolerance of photosynthesis at the genetic level. Information about the number and the characteristics of the genomic regions responsible for cold-tolerance will be useful for future germplasm improvement. QTL analysis also allows the investigation, to some extent, of the causal relationships between different traits (Lebreton et al., 1995). This could provide useful information about the physiological responses of maize to low temperature. Materials and methods Plant material and growth conditions By crossing a drought-tolerant with a drought-susceptible line (Ac7643 and Ac7729/TZSRW) two segregating populations for drought tolerance were developed at the second and sixth inbreeding levels at CIMMYT. Genetic dissection for drought tolerance has already been conducted using phenotypic data obtained from the F3 families (Ribaut et al., 1996, 1997) and the recombinant inbred lines (RILs) (Fracheboud et al., unpublished data) derived by single seed descent from F2 plants. First measurements on the two parental lines indicated that the families derived from this speci®c cross were also segregating for cold tolerance of photosynthesis. Therefore, an analysis for cold tolerance was performed on the 233 RILs. One seedling of each line was grown in a growth chamber (PGW36, Conviron, Winnipeg, Canada) in 10310310 cm pots containing a. commercial mixture of soil, peat and compost (Topf und Pikiererde 140, Ricoter, Aarberg, Switzerland). The plants were ®rst developed for 6 d at 25/22 °C (day/night) under a photoperiod of 12 h at 450 mmol quanta m±2 s±1 at a relative humidity of 60/70% (day/night). The temperature was then switched to 15/13 °C (day/night). If not otherwise speci®ed, all measurements were performed on fully expanded third leaves after 18±21 d culture at 15 °C. Six plants of each parent line were grown together with the population. The whole experiment was performed twice. Samples were harvested for pigment analysis at the end of the ®rst experiment (see below). In the second experiment, the quantum yield of electron transport at photosystem II (FPSII, see below) was monitored over time, from 2.5 h before exposure to low temperature on leaf 1, until 26 d at 15 °C on leaf 4. In a control experiment, the RIL population and the two parents were grown under the same conditions, except that the temperature was kept at 25/22 °C (day/night) during the whole growth period. The control experiment was performed once, and the measurements of photosynthetic traits were made on fully expanded third leaves 13±15 d after sowing. Photosynthesis and chlorophyll ¯uorescence Photosynthesis and stomatal resistance were measured under growth conditions using a LI-6200 (Li-Cor, Lincoln, USA) instrument. Chlorophyll ¯uorescence was recorded with a pulse-amplitude modulation ¯uorometer (PAM-2000, Walz, Effeltrich, Germany), equipped with a leaf clip holder 2030-B. The maximum quantum.
(3) QTLs for cold-tolerance in maize 1969 ef®ciency of PSII primary photochemistry (Fv/Fm) was measured by applying a 1 s saturating ¯ash (>8000 mmol m±2 s±1) after about 1 h dark adaptation. The quantum yield of electron transport at PSII (FPSII) was measured under growing conditions according to Genty et al. (1989). Pigments analysis At the end of the ®rst experiment (after 21 d at low temperature), leaf discs were punched from the third leaf, frozen in liquid N2 and stored at ±80 °C until analysis. Pigments were analysed by HPLC according to the method of Gilmore and Yamamoto (1991) and the modi®cations described in Leipner et al. (2000). Linkage map and QTL identi®cation According to the protocols of Hoisington et al. (1994), DNA from a bulk of 10 leaf samples was extracted for each RIL. The DNA was quanti®ed and then digested with the restriction enzymes EcoRI or Hind III; the fragments were separated according to size on agarose gel and the digested DNA was transferred to a nylon membrane by the Southern blotting process. Labelled RFLP probes (digoxigenindUTP) were then hybridized to the complementary sequences on the immobilized fragment DNA sample in the membranes to detect polymorphism. Using 132 RFLP probes, a linkage map of a total length of 2250 cM with an average density of 17 cM was constructed (Fig. 1) using Mapmaker 3.0 (Lander et al., 1987). The longest distance between two consecutive markers (72.2 cM) was located on chromosome 4, between 12.3 and 84.5 cM. Apart from this large gap, ®ve other gaps of 40±50 cM were identi®ed on chromosomes 3 (two of them), 5, 6 and 10. The QTL identi®cation was conducted using the composite interval mapping (CIM) software developed by Zeng (1994). This approach is based on mixture models and maximum likelihood techniques and enables an accurate evaluation of QTL characteristics by reducing QTL interaction when using markers as cofactors. For more details related to the practical procedure of CIM see Ribaut et al. (1997). The presence of a QTL was declared signi®cant if the likelihood of odds (LOD) value was >2.5 for a single trait analysis or in the joint analysis of data from the two different experiments at low temperature. Additivity at each signi®cant QTL was obtained directly from the output of the program. A joint analysis of phenotypic data from the two experiments enabled the evaluation of the effects of environmental interaction on QTL identi®cation (Jiang and Zeng, 1995). Multiple regressions were used to evaluate the total percentage of phenotypic variation accounted for by the identi®ed QTLs.. Results Photosynthetic parameters The rate of carbon ®xation was well correlated with the quantum yield of electron transport at PSII both in leaves developed at 25 °C and 15 °C. (Fig. 2A). Compared with leaves developed at 25 °C leaves developed at 15 °C showed an average reduction of photosynthesis of 66% and a higher variation between lines, suggesting a large genetic variation in the cold-tolerance of the population. There was also a non-linear correlation between CO2 ®xation and the maximum quantum ef®ciency of PSII primary photochemistry, Fv/Fm in leaves developed at 15 °C but not in leaves developed at 25 °C (Fig. 2B). A decrease in Fv/Fm of 15 °C-grown leaves was clearly associated with a low rate of photosynthesis, but only when lower than 0.4±0.5.. Above a threshold of 0.5, the maximum quantum ef®ciency of PSII primary photochemistry was suf®cient to sustain photosynthesis; the variation in CO2 ®xation among lines was due to other factors. Although photosynthesis and stomatal resistance showed some correlation in both leaf types (Fig. 2C), in leaves developed at 15 °C, it was lower than the correlation between CO2 ®xation and FPSII (Fig. 2A), indicating that stomatal closure was not the main factor that controlled the rate of photosynthesis. In these leaves, the rate of CO2 ®xation was also inversely correlated with Fo, the ¯uorescence yield emitted by the leaf in the absence of actinic illumination used to calculate Fv/Fm, whilst Fo in leaves developed at 25 °C showed little variation and was not correlated with the rate of CO2 ®xation (Fig. 2D). The correlation between Fo and Fv/Fm of leaves developed at 15 °C was moderate (r2=0.37, data not shown) while the correlation between Fm and Fv/Fm was not signi®cant (r2=0.05, data not shown), indicating that a low Fv/Fm was due to a high Fo rather than a low Fm. According to the value of the two parental lines for the different traits presented in Fig. 2, it appears that all the traits in leaves developed at 15 °C presented a transgressive segregation in this RIL population due to the presence of favourable alleles in the susceptible parental line. The QTL analysis (Table 1) detected four QTLs for CO2 ®xation measured on the third leaf of the segregating families grown at 15 °C. Those QTLs were located on chromosomes 1 (146 cM), 2 (137 cM), 3 (70 cM), and 9 (62 cM). For three of these QTLs, located on chromosomes 1, 2 and 3, an increase in CO2 ®xation was due to the allelic contribution of the drought-tolerant parent (P1), as demonstrated by the positive value of the mean additivity at those QTLs. By contrast, for the QTL on chromosome 9, an increase in the CO2 ®xation was due to the allelic contribution of the drought-susceptible parent (P2). All four QTLs were also detected for the expression of FPSII, con®rming at the genetic level the tight phenotypic correlation observed between the two traits in Fig. 2. The two QTLs on chromosomes 1 and 9 were also probably detected for CO2 ®xation and FPSII in leaves developed at 25 °C at, respectively, 157 and 73 cM, indicating that these QTLs are not speci®c to low temperature. By contrast the two QTLs on chromosomes 2 (137±138 cM) and 3 (70 cM), only detected in leaves developed at 15 °C for these traits, were speci®c to low growth temperature. From the QTL data presented in Table 1, several QTLs detected consistently across the different target traits can be identi®ed in leaves developed at 15 °C. The most obvious is the QTL on chromosome 3 (70 cM) which was detected for all traits investigated between 67 and 80 cM. This QTL explained the highest proportion of the phenotypic variance for almost all the traits and resulted in the highest LOD score compared to the other QTLs. This QTL was perhaps also detected for Fo in leaves developed at 25 °C (at 83 cM). The QTL on chromosome 1 at 146 cM for CO2.
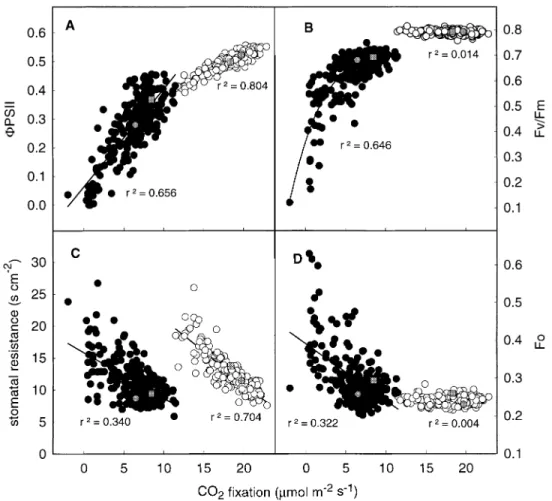
(4) 1970 Fracheboud et al.. Fig. 2. Relationship between the rate of carbon ®xation and the quantum yield of electron transport at PSII (A), the maximum quantum ef®ciency of PSII primary photochemistry (B), the stomatal resistance (C) and the `dark' level of chlorophyll ¯uorescence (D) of the third leaf of maize seedlings grown at 25 °C or 15 °C. White circles: recombinant inbred lines grown at 25 °C (single values); black circles: recombinant inbred lines grown at 15 °C (average of two independent experiments); grey circles: parent P1 (average of six replicates); grey squares: parent P2 (average of six replicates). Lines represent linear regressions except for Fv/Fm of leaves developed at 15 °C, where line represents cubic regression.. ®xation and FPSII was also probably detected for Fv/Fm (at 158 cM) in leaves developed at 15 °C. Besides the four QTLs involved in CO2 ®xation and FPSII, leaves grown at 15 °C showed additional QTLs for individual parameters on chromosomes 3 (289 cM) for FPSII, 6 (24 cM) for Fv/ Fm, and 4 (202 and 239 cM) for stomatal resistance. Leaves developed at 25 °C showed additional QTLs on chromosomes 1 (106 cM) for FPSII, 2 (164 cM) for Fv/Fm and 8 (161 cM) for Fo. None of the QTLs identi®ed for leaves developed at 15 °C presented a signi®cant interaction with the environment (Q3E in Table 1, threshold at 3.84), meaning that their expression was quite stable across the two experiments. This result is important because it demonstrates the reliability of the single measurement per genotype. The QTLs identi®ed both for CO2 ®xation and FPSII of leaves developed at 15 °C on chromosomes 2, 3 and 9 are quite consistent because they were signi®cant for both traits in both experiments. When considering the effects of the QTLs together, 24% and 31% of phenotypic variance. are expressed for CO2 ®xation and FPSII in the second experiment at low temperature. In leaves developed at 25 °C, 16.1% and 19.3% of the phenotypic variance was explained by the sum of the detected QTLs for CO2 ®xation and FPSII, respectively. The QTL on chromosome 3 alone accounted for most of this phenotypic expression in leaves developed at 15 °C, whilst the QTL on chromosome 9 seemed the most important in leaves developed at 25 °C. Considering all the QTLs presented in Table 1, the QTL on chromosome 3 (70 cM) is considered to be a major QTL, and key gene(s) for the tolerance of photosynthesis to low temperature are assumed at this genomic location. Leaf pigment composition Figure 3 shows the relationship between CO2 ®xation and pigment composition in the third leaf developed at 15 °C in Exp.1. There was a weak, but signi®cant, positive linear relationship between the rate of carbon ®xation and the accumulation of chlorophyll on a leaf area basis (Fig. 3A)..
(5) QTLs for cold-tolerance in maize 1971 Table 1. Genetic characteristics of QTLs involved in photosynthetic traits of the third leaf of maize seedlings developed at 15 °C or 25 °C with a LOD score above a threshold of 2.5 T°, growth temperature; Chr, chromosome number; cM, position of the peak of the QTL in centimorgans; Joint, LOD score in the joint analysis of experiment 1 (Exp. 1) and 2 (Exp. 2) for leaves developed at 15 °C; Q3E, LOD score value for QTL±environment interaction in the joint analysis of Exp. 1 and Exp. 2; V(%), % of phenotypic variance explained by the QTL; A, additivity expressed in the unit of the trait. Trait. CO2 ®xation (mmol m. T°. ±2. ±1. s ). 15. 25. Chr. 1 2 3 9. 1 9. cM. 146 137 70 62. 157 73. Nearest marker. bnl5.59 umc98 umc10 bnl3.06. umc119 umc114. LOD score. V (%). A. Exp. 1. Exp. 2. Joint. Q3E. Exp. 1. 2.12 3.35 3.54 2.06. 0.08 1.81 8.42 2.05. 2.75 3.91 9.31 3.13. 2.60 0.70 0.10 0.12. 4.2 7.9 7.6 1.7. 0.1 5.7 18.8 1.4. 19.6. 24.4. 2.90 4.96. Exp. 2. 1.5 14.1. 0.13 0.68 1.24 ±0.66. 0.75 ±1.08. 16.1 FPSII. 15. 1 2 3 9. 25. 1 9. 146 138 70 289 62. 106 74. bnl5.59 umc98 umc10 umc317 bnl3.06. umc185 umc114. 2.94 2.83 3.09 0.06 2.55. 0.71 1.57 9.97 3.01 1.65. 3.04 3.35 10.47 3.66 3.23. 0.27 0.01 3.55 3.29 0.00. 3.50 7.63. 6.0 6.5 7.9 0.1 2.4. 1.8 5.8 20.4 3.8 1.4. 20.7. 31.3. 3.4 13.8. 0.024 0.028 0.044 ±0.009 ±0.028. ±0.013 ±0.015. 19.3 Fv/Fm. Fo (rel.). 15. 1 3 6. 158 70 24. umc119 umc10 bnl3.06. 2.87 3.02 2.71. 25. 2. 164. bnl6.29. 6.93. 15. 3. 67. npi114. 3.34. 25. 3 8. 83 161. csu30 umc30. 3.69 3.55. 0.09 5.33 0.11. 3.01 6.21 2.81. 1.93 0.09 1.69. 6.2 7.2 2.6. 0.2 13.0 0.0. 16.2. 13.2. 17.0 5.87. 7.28. 0.58. 4.6. 0.014 0.039 ±0.015. 0.004 13.9. 8.0 7.4. ±0.028 0.004 ±0.004. 15.3 Stomatal resistance (s cm±2). 15. 25. 3 4. 9. 80 202 239. 74. umc10 umc133 umc326. umc114. As mentioned above for stomatal resistance, the weakness of the correlation indicated that the rate of carbon ®xation is only marginally in¯uenced by the amount of chlorophyll in the leaf. Similarly, the rate of CO2 ®xation was also correlated linearly with the chlorophyll a/b ratio (Fig. 3B) and with the ratio between b-carotene and lutein (Fig. 3C). Furthermore, there was an inverse linear relationship between the rate of carbon ®xation and the accumulation of. 0.65 2.29 0.73. 4.42. 3.83 0.45 2.84. 4.10 2.54 3.24. 2.47 0.00 1.66. 0.9 2.2 0.4. 7.2 0.0 4.4. 4.6. 12.4. 11.1. ±0.55 0.60 ±0.48. ±1.08. the xanthophyll zeaxanthin on a chlorophyll basis (Fig. 3D). As for photosynthetic traits, the QTL analysis of leaf pigment composition (Table 2) revealed the presence of a very consistent QTL around 68±80 cM on chromosome 3 because it was detected for 7 of the 11 traits investigated. The sign of the additivity parameter (A in Table 2) indicated that a positive allele at this QTL contributed to an.
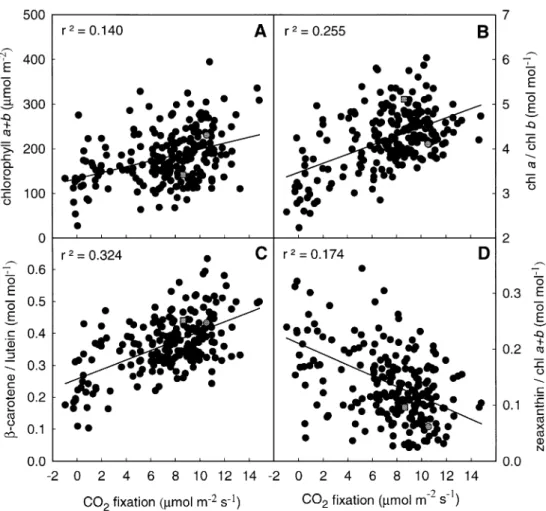
(6) 1972 Fracheboud et al.. Fig. 3. Relationship between the rate of carbon ®xation and the chlorophyll content (A), the ratio between chlorophyll a and b (B), the ratio between b-carotene and lutein (C) and the amount of zeaxanthin per chlorophyll (D) of the third leaf of maize seedlings grown at sub-optimal temperature (Exp. 1). Black circles: recombinant inbred lines (single values), grey circles: parent P1 (average of six replicates); grey squares: parent P2 (average of six replicates).. increase in the amount of chlorophyll per leaf area and to maintain a higher ratio of b-carotene/lutein. It also prevented the accumulation of lutein, xanthophyll cycle pigments pool (indicated by V+A+Z/chl a+b) and zeaxanthin (indicate by Z/chl a+b and Z/V+A+Z). These observations con®rm the presence of a key gene at this genomic location. Besides this locus, the analysis revealed only two additional QTLs on chromosome 7 at 118 cM for the ratio b-carotene/lutein and on chromosome 3 (289 cM) for the accumulation of chlorophylls. Time-course of FPSII. During the second experiment at low temperature, FPSII was monitored on different leaves, from leaf 1 c. 2.5 h before exposure to 15 °C until 26 d at 15 °C on leaf 4. Based on the results of the ®rst experiment, special attention was paid to the kinetics of the genetic effects at the four loci detected for CO2 ®xation and FPSII. In the ®rst leaf, which was fully developed prior to exposure to low temperature, no signi®cant QTL were identi®ed and the LOD score at the four selected loci was low (Table 3).. In the second leaf, which was partially developed before exposure to low temperature, the LOD score for the QTLs on chromosomes 1, 2 and 3 was higher compared to the values obtained on the ®rst leaf, although none of them reached the LOD threshold of 2.5. In leaf 3, which developed entirely at low temperature, the QTL on chromosome 3 became highly signi®cant and remained at a very signi®cant level at all developmental stages of the leaf. By contrast, the QTL on chromosome 1 was most signi®cant at early stages of the leaf development (days 8 and 12) and became less involved in the expression of FPSII thereafter. The QTL on chromosome 2 was not very signi®cant in this experiment and seemed to be more important at the late stage of leaf 2 (day 12) and intermediate stages of leaf 3 (days 12 and 19). The QTL on chromosome 9 showed the lowest LOD values, because it was less important in this experiment than in the ®rst one (Table 1). The importance of the QTLs on chromosomes 1, 2 and 9 of leaf 4 tended to decrease in favour of the QTL on chromosome 3, which alone explained more than 25% of the phenotypic variance of the population. Besides these.
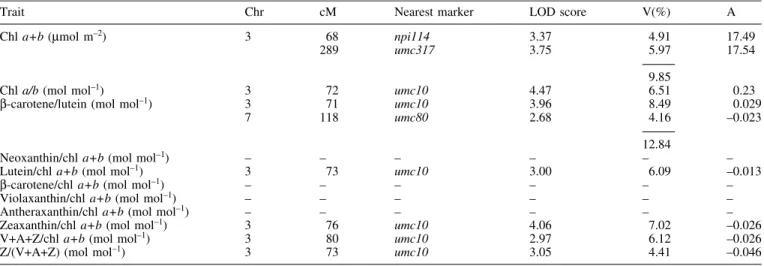
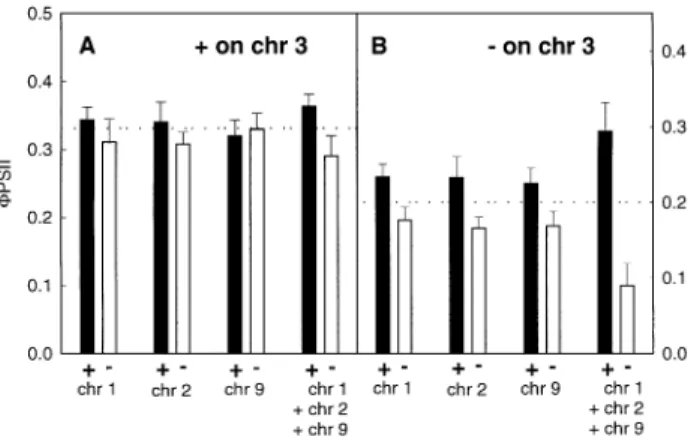
(7) QTLs for cold-tolerance in maize 1973 Table 2. Genetic characteristics of QTLs involved in the pigment composition of the third leaf of maize seedlings developed at sub-optimal temperature (Exp. 1) and detected above a LOD threshold of 2.5 Chr, chromosome number; cM, position of the peak of the QTL in centimorgans; V(%), % of phenotypic variance explained by the QTL; A, additivity expressed in the unit of the trait; V+A+Z, xanthophyll cycle pool (violaxanthin+antheraxanthin+zeaxanthin); Z/(V+A+Z), proportion of the xanthophyll cycle pool in the form of zeaxanthin. Trait. Chr. cM. Nearest marker. LOD score. Chl a+b (mmol m ). 3. 68 289. npi114 umc317. 3.37 3.75. 4.91 5.97. 17.49 17.54. Chl a/b (mol mol±1) b-carotene/lutein (mol mol±1). 3 3 7. 72 71 118. umc10 umc10 umc80. 4.47 3.96 2.68. 9.85 6.51 8.49 4.16. 0.23 0.029 ±0.023. Neoxanthin/chl a+b (mol mol±1) Lutein/chl a+b (mol mol±1) b-carotene/chl a+b (mol mol±1) Violaxanthin/chl a+b (mol mol±1) Antheraxanthin/chl a+b (mol mol±1) Zeaxanthin/chl a+b (mol mol±1) V+A+Z/chl a+b (mol mol±1) Z/(V+A+Z) (mol mol±1). ± 3 ± ± ± 3 3 3. ± 73 ± ± ± 76 80 73. ± umc10 ± ± ± umc10 umc10 umc10. ± 3.00 ± ± ± 4.06 2.97 3.05. 12.84 ± 6.09 ± ± ± 7.02 6.12 4.41. ± ±0.013 ± ± ± ±0.026 ±0.026 ±0.046. ±2. four loci, no other QTL was detected with a LOD threshold of 2.5 in leaves 1, 2, 3, and 4 at all developmental stages. Figure 4 shows the impact of the presence of positive or negative alleles at the four target QTLs on the phenotype of the RILs grown at 15 °C. As suggested from the results presented in Table 3, the allelic composition at the QTLs had little in¯uence on the FPSII of leaves 1 and 2. By contrast, leaves 3 and 4 of lines carrying favourable alleles at all four loci had a quantum yield of electron transport at PSII up to four times higher than leaves of lines carrying unfavourable alleles. The data presented in Fig. 4 also indicate that the effect of positive alleles on the plant phenotype was weaker than the effect of negative alleles when compared to the mean value of the RIL population. This result may be due to a sampling effect or may indicate genetic interactions between the QTLs, epistasis. The second hypothesis was investigated by comparing FPSII in lines with different allelic combinations. The most signi®cant interaction was observed between the QTL on chromosome 3 and the other QTLs (Fig. 5). The average FPSII of leaves 3 and 4 from lines carrying a positive allele at the QTL on chromosome 3 (dotted line in Fig. 5A) was substantially higher than the FPSII of leaves from lines carrying a negative allele at this locus (dotted line in Fig. 5B). Adding positive or negative alleles at the loci on chromosomes 1, 2 and 9 had only a marginal effect on the FPSII of lines with a positive allele at the QTL on chromosome 3 (Fig. 5A). By contrast, the allelic composition at QTLs on chromosomes 1, 2 and 9 had a large in¯uence on the FPSII of lines with a negative allele at the locus on chromosome 3, especially when considering the effect of three QTLs together (Fig. 5B). In the latter case,. V(%). A. the simultaneous presence of positive alleles at the QTLs on chromosomes 1, 2 and 9 restored FPSII to a level close to what observed in lines with a positive allele at the QTL on chromosome 3. From those results it can be concluded that the QTL on chromosome 3 presents epistatic interactions with the other QTLs involved in the expression of the FPSII measured in leaves developed at low temperature. Discussion The RILs used in this study showed a large variation in cold-tolerance, as judged from their broad variation of CO2 ®xation (Fig. 2). When compared with tolerant lines, the more sensitive lines grown at low temperature were also characterized by an increase in photoinhibition (indicated by Fv/Fm, Fig. 2B), con®rming previous results obtained with different cultivars (Aguilera et al., 1999) and with lines bred for contrasting cold-tolerance using chlorophyll ¯uorescence (Fracheboud et al., 2000). Cold-tolerance was positively correlated with the content of chlorophyll and with the ratios chlorophyll a/b and b-carotene/lutein and inversely correlated with the amount of zeaxanthin on a chlorophyll basis (Fig. 3). This is in good agreement with the results of Haldimann (1998) on maize genotypes of different origin grown at sub-optimal temperature. Lightharvesting complexes are known to contain both chlorophyll a and b, whilst the reaction centre cores of PSI and PSII contain only chlorophyll a (Yamamoto and Bassi, 1996). Therefore, the lower chlorophyll a/b ratio of sensitive lines compared with tolerant lines may re¯ect a lower number of reaction centres per light-harvesting.
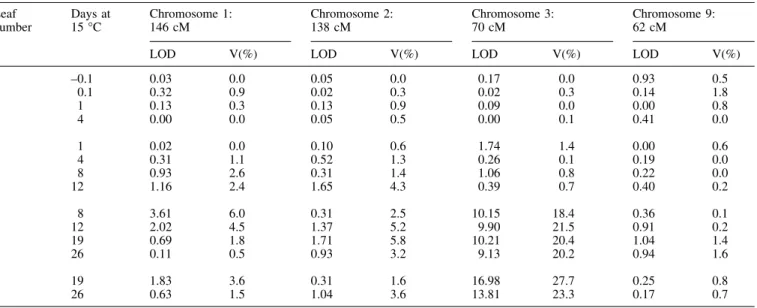
(8) 1974 Fracheboud et al. Table 3. Genetic characteristics at four loci detected for the quantum yield of electron transport at PSII in maize seedlings grown at sub-optimal temperature (Exp. 2) V(%), % of phenotypic variance explained by the QTL. Leaf number. Days at 15 °C. Chromosome 1: 146 cM. Chromosome 2: 138 cM. Chromosome 3: 70 cM. Chromosome 9: 62 cM. LOD. V(%). LOD. V(%). LOD. V(%). LOD. V(%). 1. ±0.1 0.1 1 4. 0.03 0.32 0.13 0.00. 0.0 0.9 0.3 0.0. 0.05 0.02 0.13 0.05. 0.0 0.3 0.9 0.5. 0.17 0.02 0.09 0.00. 0.0 0.3 0.0 0.1. 0.93 0.14 0.00 0.41. 0.5 1.8 0.8 0.0. 2. 1 4 8 12. 0.02 0.31 0.93 1.16. 0.0 1.1 2.6 2.4. 0.10 0.52 0.31 1.65. 0.6 1.3 1.4 4.3. 1.74 0.26 1.06 0.39. 1.4 0.1 0.8 0.7. 0.00 0.19 0.22 0.40. 0.6 0.0 0.0 0.2. 3. 8 12 19 26. 3.61 2.02 0.69 0.11. 6.0 4.5 1.8 0.5. 0.31 1.37 1.71 0.93. 2.5 5.2 5.8 3.2. 10.15 9.90 10.21 9.13. 18.4 21.5 20.4 20.2. 0.36 0.91 1.04 0.94. 0.1 0.2 1.4 1.6. 4. 19 26. 1.83 0.63. 3.6 1.5. 0.31 1.04. 1.6 3.6. 16.98 13.81. 27.7 23.3. 0.25 0.17. 0.8 0.7. Fig. 4. Quantum yield of electron transport in recombinant inbred lines of maize over time at 15 °C during experiment 2. Grey squares represents the mean values of the whole RIL population (n=218±229) while black and white circles correspond to the phenotypic mean of RILs homozygotes with the favourable (n=14±17) and non-favourable allele, respectively (n=12±17), at the nearest marker (see Table 1 for markers names) to the four QTL peaks detected for FPSII on chromosomes 1 (146 cM), 2 (138 cM), 3 (70 cM), and 9 (62 cM); Error bars represent standard deviation of lines with favourable and unfavourable alleles at theses QTLs.. complex. This hypothesis is con®rmed by the similar relationship between CO2 ®xation and the ratio between bcarotene and lutein (Fig. 3C), since b-carotene is mainly associated with the reaction centres of PSI and PSII while lutein is associated with light-harvesting complexes (Lee. and Thornber, 1995; Yamamoto and Bassi, 1996). The tolerant lines were also characterized by a lower accumulation of the xanthophyll zeaxanthin compared to the sensitive lines (Fig. 3D). Zeaxanthin, known to be involved in the dissipation of excess absorbed energy in various plant species (Demmig-Adams and Adams, 1996), has been shown to be of particular importance for the reduced photosynthetic ef®ciency of maize at low temperature (Fryer et al., 1995). Thus, as pointed out by Haldimann (1998), the higher zeaxanthin content of sensitive lines compared with tolerant lines may re¯ect a higher requirement for energy dissipation due to a lower photosynthetic rate. The phenotypic correlations between photosynthetic traits (Fig. 2) and the identi®cation of QTLs from measurements on leaf 3 (Table 1), were generally in good agreement. The best correlation was obtained for CO2 ®xation and FPSII (Fig. 2A) which showed essentially the same QTLs (Table 1) for both leaves developed at 15 °C and 25 °C. This provides additional genetic evidence of the tight relationship between the two traits, as observed in previous studies (Edwards and Baker, 1993; Leipner et al., 1999). The QTL on chromosome 3 around 70 cM was detected for most of the parameters in leaves developed at 15 °C and seems to be of major importance because it expresses a large percentage of the phenotypic variance. The phenotype resulting in a differential expression at this QTL might be due to a single or a cluster of genes. Interestingly, this QTL was the only QTL detected for Fo, the intrinsic ¯uorescence emitted by the leaf under the very weak modulated measuring beam and which, therefore, does not.
(9) QTLs for cold-tolerance in maize 1975. Fig. 5. The effect of allelic composition on FPSII in maize leaves developed at low temperature (experiment 2) from RILs homozygote from the parent carrying a favourable (A) or an unfavourable (B) allele at the nearest marker (see Table 1 for markers names) to the QTL on chromosome 3 combined with favourable (back bars) or unfavourable (white bars) alleles at the QTLs on chromosome 1 (chr 1), chromosome 2 (chr 2), chromosome 9 (chr 9) or the combined alleles on chromosomes 1, 2 and 9 (chr 1+chr 2+chr 9). The dotted lines represent the average FPSII of RILs with a favourable (A) or an unfavourable (B) allele at the QTL on chromosome 3. The data represent the average 6STD of all measurements of leaves 3 and 4.. involve any photochemical processes, but rather re¯ects modi®cations of the structure of the thylakoid membrane. In this respect, the susceptible lines with high Fo have a similar phenotype as a class of photosynthetic maize mutants, described as high chlorophyll ¯uorescence mutants (see Miles, 1994, for a review). Some of these mutants have been characterized and were shown to lack several polypeptides of PSI and PSII (Heck et al., 1999). In addition, the major QTL on chromosome 3 of leaves developed at 15 °C was the main QTL detected for pigment composition (Table 2) and a positive allele at this QTL is suf®cient to confer a relatively high level of tolerance, independent of the alleles present at the other signi®cant QTLs (Fig. 5A). Taken together, these observations suggest that the responsible gene(s) at this QTL is involved in the early development of the chloroplast at low temperature. An investigation of the maize genome database (www.agron.missouri.edu) indicated the presence of an interesting candidate gene for this QTL, tha1 (thylakoid assembly protein 1). The analysis indicates that the peak of the QTL for CO2 ®xation and FPSII is located 2.5 cM before the marker umc10 in the map, which is almost exactly the position of tha1, located 2.2, 2.3 and 2.6 cM before umc10 on the maps umc 96, umc 98 and Pioneer composite 1999, respectively. Interestingly, the tha1 mutation induces a reduction of the levels of PSII, PSI and cytochrome bf polypeptides (Barkan et al., 1995). The tha1 gene functions in the targeting of certain proteins into the thylakoid (Voelker and Barkan, 1995). This hypothesis is in agreement with the observation that some polypeptides encoded by the chloroplast genome are particularly affected by low growth temperature in maize (Nie and. Baker, 1991; Robertson et al., 1993). The QTL on chromosome 3 was also probably detected in leaves developed at 25 °C at 83 cM (Table 1). However, it is not relevant for the rate of photosynthesis in these leaves since Fo is not correlated with photosynthesis of leaves developed at 25 °C (Fig. 2) and since the LOD score at this loci for CO2 ®xation is very low (0.47). The effects of the QTLs detected for CO2 ®xation and FPSII on chromosomes 1, 2 and 9 in leaves developed at 15 °C were different in lines with a positive or negative allele at the QTL on chromosome 3 (Fig. 5). In combination, positive alleles at these QTLs can partially restore electron transport in lines with a negative allele at the QTL on chromosome 3 (Fig. 5B) implying that they might restore the development of functional chloroplasts at low temperature. Furthermore, their effect seemed to be cumulative, suggesting that they function on independent pathways. The second QTL for CO2 ®xation and FPSII which appeared to be speci®c to low temperature was located on chromosome 2 at 137±138 (Table 1). A possible candidate gene at this locus is ssu2 (ribulose bisphosphate carboxylase small subunit 2), found c. 3±4 cM before the marker umc98 on the map Pioneer composite 1999. The two additional QTLs detected on chromosomes 1 and 9 for CO2 ®xation and FPSII in leaves developed at 15 °C were also probably detected for these traits in leaves developed at 25 °C, implying that they are important for the rate of photosynthesis independently of growth temperature, although the QTL on chromosome 9 seemed more important in leaves developed at 25 °C than for leaves developed at 15 °C (Table 1). The maize database did not reveal a good candidate gene for these QTLs. Although the results of stomatal resistance indicate that there was no cold-induced water stress in these experiments, the QTLs on chromosomes 1, 2 and 9 correspond to QTLs associated with ¯owering and yield parameters that were identi®ed in F3 families of this material under drought conditions (Ribaut et al., 1996, 1997). This may indicate that certain genes are involved in the tolerance to both stresses as suggested by Hughes and Dunn (1996). These may, for example, be involved in the defences against oxidative damage, which were proposed to be important for cold-tolerance (Kingston-Smith et al., 1999) and water-stress tolerance (Dellongo et al., 1993) in maize. Additional experimentation is necessary to validate the presence of putative common mechanisms of plant defence under cold and drought stresses.. Acknowledgements We are very grateful to Damien Liberherr for his assistance in constructing the RFLP linkage map. Part of this work was supported by the Swiss National Science Foundation, grant No. 3100058910.99..
(10) 1976 Fracheboud et al.. References Aguilera C, Stirling CM, Long SP. 1999. Genotypic variation within Zea mays for susceptibility to and rate of recovery from chill-induced photoinhibition of photosynthesis. Physiologia Plantarum 106, 429±436. Austin DF, Lee M, Veldboom LR, Hallauer A. 2000. Genetic mapping in maize with hybrid progeny across testers and generations: grain yield and grain moisture. Crop Science 40, 30±39. Barkan A, Voelker R, Mendelhartvig J, Johnson D, Walker M. 1995. Genetic-analysis of chloroplast biogenesis in higher-plants. Physiologia Plantarum 93, 163±170. Dellongo OT, Gonzalez CA, Pastori GM, Trippi VS. 1993. Antioxidant defences under hyperoxygenic and hyperosmotic conditions in leaves of 2 lines of maize with differential sensitivity to drought. Plant and Cell Physiology 34, 1023±1028. Demmig-Adams B, Adams III W. 1996. Xanthophyll cycle and light stress in nature: uniform response to excess direct sunlight among higher plant species. Planta 98, 460±470. Edwards GE, Baker NR. 1993. Can CO2 assimilation in maize leaves be predicted accurately from chlorophyll ¯uorescence analysis? Photosynthesis Research 37, 89±102. Fracheboud Y, Haldimann P, Leipner J, Stamp P. 1999. Chlorophyll ¯uorescence as a selection tool for cold tolerance of photosynthesis in maize (Zea mays L.). Journal of Experimental Botany 50, 1533±1540. Fracheboud Y, Iannelli MA, Pietrini F, Massacci A. 2000. Photoprotection in maize at suboptimal temperature. In: Parente G, Frame J, eds. COST action 814: crop development for the cool and wet regions of Europe. Brussels: Of®ce for the Of®cial Publications of the European Communities, 115±120. Fryer MJ, Andrews JR, Oxborough K, Blowers DA, Baker NR. 1998. Relationship between CO2 assimilation, photosynthetic electron transport, and active O2 metabolism in leaves of maize in the ®eld during periods of low temperature. Plant Physiology 116, 571±580. Fryer MJ, Oxborough K, Martin B, Ort DR, Baker NR. 1995. Factors associated with depression of photosynthetic quantum ef®ciency in maize at low growth temperature. Plant Physiology 108, 761±767. Genty B, Briantais JM, Baker NR. 1989. The relationship between the quantum yield of photosynthetic electron transport and quenching of chlorophyll ¯uorescence. Biochimica et Biophysica Acta 990, 87±92. Gilmore AM, Yamamoto HY. 1991. Resolution of lutein and zeaxanthin using a non-endcapped, lightly carbon-loaded C18 high-performance liquid chromatographic column. Journal of Chromatography 543, 137±145. Haldimann P. 1998. Low growth temperature-induced changes to pigment composition and photosynthesis in Zea mays genotypes differing in chilling sensitivity. Plant, Cell and Environment 21, 200±208. Haldimann P. 1999. How do changes in temperature during growth affect leaf pigment composition and photosynthesis in Zea mays genotypes differing in sensitivity to low temperature? Journal of Experimental Botany 50, 543±550. Haldimann P, Fracheboud Y, Stamp P. 1995. Carotenoid composition in Zea mays developed at sub-optimal temperature and different light intensities. Physiologia Plantarum 95, 409± 414. Heck DA, Miles D, Chitnis PR. 1999. Characterization of two photosynthetic mutants of maize. Plant Physiology 120, 1129± 1136. Hoisington D, Khairallah M, GonzaÂlez-de-LeoÂn D. 1994.. Laboratory protocols: CIMMYT applied molecular genetics laboratory, 2nd edn. Mexico, DF: CIMMYT. Hughes MA, Dunn MA. 1996. The molecular biology of plant acclimation to low temperature. Journal of Experimental Botany 47, 291±305. Jiang C, Zeng ZB. 1995. Multiple trait analysis of genetic mapping for quantitative trait loci. Genetics 140, 111±127. Kingston-Smith AH, Harbinson J, Foyer CH. 1999. Acclimation of photosynthesis, H2O2 content and antioxidants in maize (Zea mays) grown at sub-optimal temperatures. Plant, Cell and Environment 22, 1071±1083. Kraja AT, Dudley JW. 2000. QTL analysis of two maize inbred line crosses. Maydica 45, 1±12. Lander ES, Green P, Abrahamson J, Barlow A, Daly MJ, Lincoln SE, Newburg L. 1987. MAPMAKER: an interactive computer package for constructing primary genetic linkage maps of experimental and natural populations. Genomics 1, 174±181. Lebreton C, Lazicjancic V, Steed A, Pekic S, Quarrie SA. 1995. Identi®cation of QTL for drought responses in maize and their use in testing causal relationships between traits. Journal of Experimental Botany 46, 854±865. Lee ALC, Thornber JP. 1995. Analysis of the pigment stoichiometry of pigment±protein complexes from barley (Hordeum vulgare): the xanthophyll cycle intermediates occur mainly in the light-harvesting complexes of photosystem I and photosystem II. Plant Physiology 107, 565±574. Lee M. 1995. DNA markers and plant breeding programs. Advances in Agronomy 55, 265±344. Leipner J, Fracheboud Y, Stamp P. 1997. Acclimation by suboptimal growth temperature diminishes photooxidative damage in maize leaves. Plant, Cell and Environment 20, 366± 372. Leipner J, Fracheboud Y, Stamp P. 1999. Effect of growing season on the photosynthetic apparatus and leaf antioxidative defences in two maize genotypes of different chilling tolerance. Environmental and Experimental Botany 42, 129±139. Leipner J, Stamp P, Fracheboud Y. 2000. Arti®cially increased ascorbate content affects zeaxanthin formation but not thermal energy dissipation or degradation of antioxidants during coldinduced photooxidative stress in maize leaves. Planta 210, 964± 969. Miles D. 1994. The role of high chlorophyll ¯uorescence photosynthesis mutants in the analysis of chloroplast thylakoid membrane assembly and function. Maydica 39, 35±45. Moon HG, Brewbaker JL, Lu XW. 1999. Major QTLs for disease resistance and other traits identi®ed in recombinant inbred lines from tropical maize hybrids. Maydica 44, 301±311. Nie GY, Baker NR. 1991. Modi®cations to thylakoid composition during development of maize leaves at low growth temperatures. Plant Physiology 95, 184±191. Ribaut J-M, Hoisington DA, Deutsch JA, Jiang C, GonzaÂlez-deLeoÂn D. 1996. Identi®cation of quantitative trait loci under drought conditions in tropical maize. 1. Flowering parameters and the anthesis-silking interval. Theoretical and Applied Genetics 92, 905±914. Ribaut J-M, Jiang C, GonzaÂlez-de-LeoÂn D, Edmeades GO, Hoisington DA. 1997. Identi®cation of quantitative trait loci under drought conditions in tropical maize. 2. Yield components and marker-assisted selection. Theoretical and Applied Genetics 94, 887±896. Ribaut J-M, Poland D. (eds) 2000. Molecular approaches for the genetic improvement of cereals for stable production in waterlimited environments. A strategic planning workshop held at CIMMYT, El Batan, Mexico, 21±25 June 1999. Mexico DF: CIMMYT. Robertson EJ, Baker NR, Leech RM. 1993. Chloroplast thylakoid.
(11) QTLs for cold-tolerance in maize 1977 protein changes induced by low growth temperature in maize revealed by immunocytology. Plant, Cell and Environment 16, 809±818. Stirling CM, Nie GY, Aguilera C, Nugawela A, Long SP, Baker NR. 1991. Photosynthetic productivity of an immature maize crop: changes in quantum yield of CO2 assimilation, conversion ef®ciency and thylakoid proteins. Plant, Cell and Environment 14, 947±954. Voelker R, Barkan A. 1995. Two nuclear mutations disrupt distinct pathways for targeting proteins to the chloroplast thylakoid. EMBO Journal 14, 3905±3914.. Welz HG, Geiger HH. 2000. Genes for resistance to northern corn leaf blight in diverse maize populations. Plant Breeding 119, 1±14. Yamamoto HY, Bassi R. 1996. Carotenoids: localization and function. In: Ort DR, Yocum CF, eds. Advances in photosynthesis, Vol. 4. Oxygenic photosynthesis: the light reactions. Dordrecht, Boston: Kluwer Academic Publishers, 539±563. Zeng ZB. 1994. Precision mapping of quantitative trait loci. Genetics 136, 1457±1468..
(12)
Figure
+2
Documents relatifs
