HAL Id: hal-01193456
https://hal.archives-ouvertes.fr/hal-01193456
Submitted on 29 May 2020
HAL is a multi-disciplinary open access
archive for the deposit and dissemination of sci-entific research documents, whether they are pub-lished or not. The documents may come from teaching and research institutions in France or abroad, or from public or private research centers.
L’archive ouverte pluridisciplinaire HAL, est destinée au dépôt et à la diffusion de documents scientifiques de niveau recherche, publiés ou non, émanant des établissements d’enseignement et de recherche français ou étrangers, des laboratoires publics ou privés.
Detection of novel quantitative trait loci for cutaneous
melanoma by genome-wide scan in the MeLiM swine
model
Zhi Qiang Du, Silvia Vincent-Naulleau, Hélène Gilbert, Florence Vignoles,
Francoise Créchet, T. Shimogiri, H. Yasue, Jean Jacques Leplat, Stephan
Bouet, Joseph Gruand, et al.
To cite this version:
Zhi Qiang Du, Silvia Vincent-Naulleau, Hélène Gilbert, Florence Vignoles, Francoise Créchet, et al.. Detection of novel quantitative trait loci for cutaneous melanoma by genome-wide scan in the MeLiM swine model. International Journal of Cancer, Wiley, 2007, 120 (2), pp.303-320. �hal-01193456�
Detection of Novel Quantitative Trait Loci for Cutaneous Melanoma by
Genome-wide Scan in the MeLiM Swine Model
Du Z.-Q.1, Vincent-Naulleau S.1, Gilbert H. 2, Vignoles F.3, Créchet F.1, Shimogiri T.4, Yasue H.5, Leplat J.-J.1, Bouet S.1, Gruand J.2, Horak V.6, Milan D.3, Le Roy P.2 and Geffrotin C.1
1
CEA, DSV, DRR, Laboratoire de Radiobiologie et d’Etude du Génome, INRA Jouy-en-Josas, F-78352 France ; INRA, DGA, Laboratoire de Radiobiologie et d’Etude du Génome, INRA Jouy-en-Josas, F-78352 France 2INRA, DGA, Station de Génétique Quantitative et Appliquée, INRA, F-78352 Jouy-en-Josas cedex, France 3
INRA, DGA, Laboratoire de Génétique Cellulaire, INRA, F-31326 Castanet-Tolosan cedex, France 4
Faculty of Agriculture, Kagoshima University, Kagoshima 890-0065, Japan 5
National Institute of Agrobiological Sciences, 212 Kannondai, Tsukuba, Ibaraki305-8602, Japan 6
Institute of Animal Physiology and Genetics, 27721 Libechov, Czech Republic.
Short title: Novel melanoma QTLs in pigs.
Corresponding author: Geffrotin C. Telephone: +33-1-34-65-28-08 Fax: +33-1-34-65-29-64
E- mail: claudine.geffrotin@jouy.inra.fr
Key words: Swine Melanoma, QTL, MC1R, Comparative Mapping, Cancer Genetics
Abbreviations: CI: cutaneous invasion; cM: centiMorgan; CM : cutaneous melanoma ; HSA:
Homo sapiens chromosome; LRT: likelihood ration test; LT: lesion type; MC1R:
presence of metastasis; NAM: number of aggressive melanoma; NL: number of lesions; NM: nodular melanoma; PAB: presence of melanoma at birth; QTL: quantitative trait locus; RH: radiation hybrid; SSC: Sus scrofa chromosome; SSCP: single-stranded conformational polymorphism; SSM: superficial spreading melanoma; ST: synthetic trait ; ULC: ulceration; CGH: Comparative Genomic Hybridization.
Journal Category: Research Article: Cancer Genetics
Novelty and Impact:
Novel melanoma QTLs were detected in the MeLiM swine model of hereditary cutaneous mela noma and for specific traits including tumour ulceration, presence of tumour at birth, histological tumour type and number of melanomas. An association was also observed between the development of melanoma and one MC1R allele.
The results indicate that MeLiM swine is a model for human multigenic diseases, i.e. melanoma. Several genomic regions contain several QTLs, underlining the interest of these regions. Some of them are new potential candidate regions, therefore the results may have an impact on research in human melanoma genetics.
EMBL Accession Numbers: MC1R*2 : AM231528 MC1R*4 : AM231529 MC1R*6 : AM231530
ABSTRACT
Human cutaneous melanoma is a complex trait inherited in about 10% of cases. Although two high-risk genes, CDKN2A and CDK4, and one low risk gene, MC1R, have been identified, susceptibility genes remain to be discovered. Here, we attempted to determine new genomic regions linked to melanoma using the pig MeLiM strain which develops hereditary cutaneous melanomas. We applied quantitative trait loci (QTL) mapping method to a significant genome-wide scan performed on 331 backcross pigs derived from this strain. QTLs were detected at chromosome-wide level for a melanoma synthetic trait corresponding to the development of melanoma. The peak positions on Sus scrofa chromosomes (SSC) were at 49.4 and 88.0 cM (SSC1), 56.0 cM (SSC13), 86.5 cM (SSC15) and 39.8 cM (SSC17), and, on SSC2, at 16.9 cM, in families derived from F1 males only (P<0.05, except for SSC13, P<0.01). Analysis of 7 precise specific traits revealed highly significant QTLs on SSC10 (ulceration), on SSC12 (presence of melanoma at birth), on SSC13 (lesion type), and on SSC16 and SSC17 (number of aggressive melanomas) at the respective positions 42.0, 95.6, 81.0, 45.3 and 44.8 cM (P<0.001 and P<0.05 respectively at the chromosome- and genome-wide levels). We also showed that MeLiM MC1R*2 allele, which determines black coat colour in pigs, predisposes significantly to melanoma. Interactions were observed between
MC1R and markers located on SSC1 (P<0.05). Taken together, these results indicate that
MeLiM swine is a model for human multigenic diseases. Comparative mapping revealed human regions of interest to search for new melanoma susceptibility candidates.
INTRODUCTION
Like for most cancers, the aetiology of cutaneous melanoma (CM) is complex, involving heterogeneous, interacting genetic and environmental determinants. Familial melanoma accounts for about 10% of cases. Mutations in two high- risk genes encoding cell-cycle-regulatory proteins have been shown to cause familial CM, including the cyclin-dependent kinase inhibitor 2A (CDKN2A) located on the Homo sapiens chromosome (HSA) 9p21, and the cyclin-dependent kinase 4 (CDK4) located on HSA12q14.1 CDKN2A germline mutations occur in about 40% of families with linkage to 9p21,1,2 suggesting the existence of additional gene(s) which predispose to melanoma in this chromosomal area. In the CDK4 gene, the Arg24Cys or Arg24His mutations affect the domain binding to the p16 protein, thus preventing regulation of the p16-dependent cell cycle. These mutations have only been identified in a few families world-wide.1 Although mutations in the BRAF gene located on HSA7q34 were found in a high proportion of primary melanoma tumours, BRAF did not appear to be a gene predisposing to familial melanoma,3 however, germline single nucleotide polymorphisms (SNPs) in BRAF were found to be significantly associated with melanoma in German males.4 One low-penetrance gene, the melanocortin receptor 1 gene (MC1R) which has a key role in human pigmentation, was found to code for melanoma susceptibility variants,5 some of which increased the penetrance of CDKN2A mutations.6-8 Other low-risk genes have been investigated in a few case-control studies but the results were of low significance.9
To date, few genome scans for human melanoma have been reported. The most significant, with high-density coverage of microsatellite markers, was conducted for human CM in families from which CDKN2A and CDK4 involvement was excluded.10 The results suggested that the human chromosomal region HSA1p22 might contain a novel melanoma susceptibility locus, and this was confirmed in 33 additional pedigrees in the same study.
However, further screening of candidate genes for mutations in this region did not reveal any causal mutation.11 High-penetrance genes may be present in other regions; linkage was reported to 1p36 in North American CM/dysplastic nevi pedigrees,12 and to 9q21.32 in Danish pedigrees with CM and ocular melanoma.13
A genome scan using animal models of spontaneous CM can be of great value, not only to guide the choice of candidate genes and chromosomal regions to be studied in humans, but also to support evidence for the possible associations found with these genes before embarking into functional studies. Although very few animal models of spontaneous melanoma exist, CM is inheritable in three stocks of miniature swine: the Sinclair swine,14 the Munich Miniature Swine Troll15 and the Melanoblastoma-bearing Libechov Minipig (MeLiM).16,17 In these pigs, tumours arise spontaneously in utero or in the first months after birth, and then disseminate mainly in the lymph nodes and occasionally in inner organs, including the lung, liver, spleen, gastrointestinal tract, pancreas and kidney. However, most of these tumours regress spontaneously. As in humans, but contrary to mice, swine precursor melanoma cells originate from the basal layer of the epidermis, so that human and swine melanocytes have a comparable microenvironment. The histopathological characteristics of spontaneously occurring swine tumours were also found to resemble those of human melanomas as well documented in Sinclairand MeLiM breed models.17,18 Previous statistical genetic analyses of hereditary melanoma in these models suggested that two or three genes affected tumour formation, although none was identified.15,19,20
In our preliminary study, the MeLiM model was used to initiate a search for predisposing genes, by conducting a preliminary genome-wide scan on 79 backcross pigs (MeLiM x Duroc) deriving from a unique MeLiM boar. Interval mapping analysis provided evidence for linkage to two regions on Sus scrofa chromosome (SSC) 1q25 homologous to the human region HSA9p21 and to one region on SSC2p17 homologous to HSA11p15 and
11q13.21 The CDKN2A gene was mapped to the SSC1q25 region,22 but was excluded as a major susceptibility gene in this MeLiM family by a haplotype study.23 An association was observed with a MeLiM allele for a marker close to the MC1R gene on SSC6p1.5, but the
CDK4 and BRAF genes did not appear to be melanoma susceptibility genes in this MeLiM
model.21
In the present study, we undertook a more extensive genome-wide scan, including a total of 331 back-cross animals issued from 4 MeLiM pigs, to confirm our initial results and to locate additional regions of potential interest. Quantitative trait loci (QTLs) corresponding to the development of melanoma, a synthetic trait (ST) which combined all phenotypic informations, were first detected. Next, 7 specific traits corresponding to precise tumour characteristics were studied, leading to the detection of additional and more significant QTLs. Furthermore, black pigs with the MC1R*2 allele were found to be significantly predisposed to melanoma. All our findings indicate that the development of melanoma in pigs is a multigenic process and comparative mapping revealed human regions of interest in the search for new melanoma susceptibility candidates.
MATERIALS AND METHODS Families
The MeLiM pig strain was created and maintained at the Institute of Animal Physiology and Genetics in Libechov (Czech Republic) and was derived from crossings with several breeds (Hormel, Göttingen, Canadian Landrace, Cornwall, Large White and Vietnamese). Within this strain, cutaneous melanoma appeared spontaneously, and selective breeding led to a closed stock in which melanoma is inherited and occurs, both in utero and postnatally, in 50% of the progeny.16 The MeLiM strain is a suitable model for human melanoma because of its histopathological similarities. MeLiM animals were imported from
Czech Republic and a french herd was bred at LREG (CEA-INRA) in Jouy-en-Josas, France, for physiological and genetic studies.
As shown in Figure 1, four affected MeLiM pigs (3 females and 1 male) were mated to 5 healthy Duroc pigs (2 females and 3 males). Nine of the resulting affected F1 pigs (6 females and 3 males) were crossed with 26 healthy Duroc pigs (21 females and 5 males) to produce 331 backcross (BC) pigs which included the 79 BC used in our preliminary genome-scan which derived from F1 pigs: 91016, 81014, 81015.21 Thirty ml of fresh blood was collected from each animal for lymphocyte isolation.
The F1 and BC families were produced on the experimental farm of Rouillé (INRA, France). Permission for our animal experiments was obtained from the Animal Protection Office of the French Ministry of Agriculture and Forestry (78-16).
Phenotypes
Pigs were classified according to their clinical and histopathological characteristics.17 Briefly, the y were diagnosed by clinical follow up over 6 months, except for the 79 BC used in our preliminary study,21 which were only followed up for 3 months. Flat and raised pigmented cutaneous lesions were observed, photographed and recorded, at birth and then once a month. A search for sentinel lymph nodes was performed by palpation. For each piglet of the BC progeny, all raised lesions and each type of flat lesion were histologically analysed according to the human classification, and lesion-bearing animals were autopsied for the detection of inner metastases. All raised lesions were classified as superficial spreading melanoma (SSM) or nodular melanoma (NM), with Clark’s level II to V for invasion criteria. Flat lesions were classified as SSM restricted to epidermis, Atypical melanocyte proliferation or Lentigo.
On the basis of these characteristics, a categorical synthetic trait (ST) combining all the clinical and histopathological information on melanoma was defined by 5 categories, from
absence of melanoma (Phenotype I) to very aggressive forms (Phenotype V), as follows: Phenotype I: pigs with no pigmented lesions; Phenotype II: pigs with only flat lesions which were either histologically benign or could not be histologically analysed because of their large number; Phenotype III: pigs bearing small raised lesions with a slow growth phase (SSM or NM –Clark’s levels II to IV) or flat lesions classified as SSM-Clark’s level I; these lesions appear during the first three postnatal months; Phenotypes IV and V: pigs with one or more large raised or polypoid lesions, often ulcerated and associated with metastasis; these lesions correspond to deeply invasive melanoma (SSM or NM- Clark’s level IV to V), and mostly develop in utero or during the first month of postnatal life. Some of them exhibited fast growth (Phenotype V, also called Malignant A), and others, slow growth (Phenotype IV or Malignant B).
Note that for phenotypes III to V, some pigs had additional lesions corresponding to a lower grade.
We recorded the trait values for sex and coat colour and for the following specific traits: presence of melanoma at birth (PAB), number of lesions (NL) including all types, number of aggressive Malignant A lesions (NAM), presence of metastasis (MET), defined by 4 categories (no metastasis, adenomegaly detected by palpation, lymph node metastasis confirmed by histology and lymph node metastasis associated with visceral metastasis confirmed by histology), and for the most severe lesion on each animal, histological lesion type (LT) i.e. SSM or NM, cutaneous invasion (CI), graded according to Clark’s levels I to V, and clinical ulceration (ULC). Two traits (PAB and ULC) were binary; the other specific traits displayed a categorical distribution.
Genotyping data
DNA from each animal was extracted from lymphocytes isolated from 10 ml of fresh blood, and the DNA concentration was adjusted to 10ng/µl. In order to cover the entire swine
genome, we selected microsatellite markers from panels for pig genome mapping (INRA Toulouse), and tested them first on the F1 parents to establish the allelic distribution and parental information content. Some genotyping data used for the first genome scan20 were combined with the newly obtained data for linkage analysis, depending on the informativity level of the markers. A total of 153 microsatellite markers was selected (supplementary Table 1) and the average coverage was estimated at ~20 cM.
Microsatellite genotyping
Large-scale genotyping was mainly performed on an automated sequencer (Applied Biosystems 3700) at the CRGS Platform of the Toulouse Genopole, France. PCR reactions were run on a Gene Amp System 9700 thermocycler (Applied Biosystems) in 10µl final volume, containing 2µl fluorescent end- labelled primers (1µM each), 2µl 10×PCR buffer, 1µl dNTP nucleotide mixed solution (20µM for each nucleotide), 2.96µl H2O, 0.2 U of
GoTaq®(Promega) and 2µl DNA(10ng/µl). The two µl of DNA solution and 8µl of PCR mix solution were distributed among 384 microplates using a TECAN robot (Genesis 200 x8). Samples were preheated for 5 min at 94°C, run for 35 cycles (94°C for 20 s, 55°C for 30 s and 72°C for 30 s), and heated to 72°C for a final extension step of 5 min. After amplification, PCR products were pooled, and then analysed on the capillary sequencer (Applied Biosystems 3700). PCR fragment size was analysed using GeneScan and Genotyper v3.7 analysis software (Applied Biosystems), and stored in the GEMMA database.24 ?33P polyacrylamide gel was used to complete the genotyping and also to compare allele identification by these two genotyping methods.21 Details about methods used in the different families are described in the supplementary Table 1.
Sequencing and SSCP genotyping of MC1R
We first sequenced the overlapping fragments from the entire coding region of the
sequence (Gene accession number: AF326520). These primers amplified respectively sequence regions 401-1209 (CAAGGAGCCAGGACCAACT-3’ and 5’-AGATGAGCACGTCCATGACA-3’), 1041-1624 (5’-CTGCACTCGCCCATGTACTA-3’ and 5’-AGGGAGAGGTGCAGGAAGA-3’) and 1446-2125 (5’-GCGGTACTGTACGTCCACAT-3’ and 5’-GAGGTCCTGCAGTGAGCAAC-3’). PCRs were performed on 25 ng DNA with 2mM MgCl2. The optimized PCR conditions were 96°C
for 5 min, then (45 sec at 95°C, 45 sec at 61°C, 61°C or 58°C respectively for the 3 pairs of primers, and 90 sec at 72°C)for 35 cycles, and finally, 72°C for 10 min. PCR products were then sequenced according to recommended procedures (Genome Express). After sequence analyses, the PCR-SSCP (single-stranded conformational polymorphism) method was used to detect polymorphisms of codons 17 and 22 on 478 animals (MeLiM, F1 and backcross), using the following primers to amplify sequence region 738-910 (5’-CACCTCTGGGAGCCATGA-3’ and 5’-CGTCTGGTTGGTCTGGTT-(5’-CACCTCTGGGAGCCATGA-3’). PCR conditions were 94°C for 5 min, (45 sec at 95°C, 45 sec at 60°C, 45 sec at 72°C) for 35 cycles, and 72°C for 10 min. Seven µl of γ33P labelled PCR products was then mixed with 7 µl of loading buffer (final NaOH: 2M), then heat-denatured at 94°C for 10 min and chilled on ice. Lastly, PCR products were separated on non-denaturing 5% polyacrylamide gel, for 9 hours at 4°C, in 0.5xTBE buffer. The PCR amplification in our families can lead to 2 sizes of fragment, a 173 bp fragment corresponding to alleles MC1R*2 and MC1R*4, and a 175 bp fragment corresponding to allele MC1R*6. Due to the differences in the sequence of these fragments in the 3 MC1R alleles, 3 conformational single-strand doublets can be detected after electrophoretic migration, depending on animal genotype.
Radiation Hybrid Mapping
Using the pig- hamster radiation hybrid (RH) panel,25 high-throughput comparative RH mapping focusing on homologous genes between HSA9 and SSC1, was performed with
primers designed to amplify swine genomic DNA according to human gene conservative sequences (Kagoshima University and National Institute of Agrobiological Sciences, Tsukuba, Japan). Information regarding the gene primers used is available on request.
Data Analysis
All data were imported into and managed by the statistical analysis system SAS 8.2, on the AIX2 platform (SAS Institute). Genotyping data not in the mendelian inheritance were discarded. The genetic map was evaluated using CRI-MAP,26 and marker order and positions were compared with sex-averaged maps from the U.S. pig genome databases (www.animalgenome.org/pigs/maps/index.html), and (www.marc.usda.gov/genome/genome.html) and from the Roslin Institute (www.thearkdb.org) database. Marker order and most of the genetic distances between markers were in agreement with the public sex-averaged map, with only slight differences for the 4 marker intervals SW461-SW1466 (SSC2), SW268-S0376, SW1551-S0178 (SSC8) and SW1-SW1349 (SSC9). We therefore used the public map for interval mapping analyses. In humans, melanoma penetrance might be affected by sex and by skin and hair pigmentation,5 and in pigs, by sex and coat colour.21 Therefore, the synthetic trait was first analysed as raw data, then after correction for sex and coat colour (PROC GLM/SAS); and lastly for sex, coat colour and MC1R genotype. For each specific trait, only the results after correction for sex and coat colour are given. PROC FREQ (SAS) was used to test the effects of sex and coat colour on tumour incidence. The general linear model (PROC GLM/SAS) was used to test the effects of individual markers on melanoma occurrence with a regression model,27 and similarly, to test the effects of paired markers. Finally, the transmission-disequilibrium-test was performed by the Quantitative Trait Disequilibrium test (QTDT)28 to trace the parental alleles associated with susceptibility to melanoma.
For QTL detection, interval mapping using maximum likelihood method proposed in livestock, comprising a mixture of full and half sib families,29,30 was applied to our data. No crossover interference was assumed. All pedigree information was used to determine the transmission phase of marker alleles: the first generation consisted of MeLiM and Duroc individuals, mated to obtain F1 males and females. The backcross generation was produced by mating F1 with new Duroc individuals. Only the most probable F1 genotype was kept in the calculation, and all genotypes of their mates were estimated with a probability >0.1, so that the likelihood was partially linearized within full-sib families. No assumption was made concerning the number of QTL alleles. The model for a given trait determined by one QTL was: yijk µ µS µD gS gD eijk ij i ij i + + + + + =
where yijk is the phenotype of the kth offspring in the fa mily of the ith F1, mated with the jth Duroc (i=1,L,n; j =1,L,ni;k =1,L,nij), µ is the averaged family value, µSi and µDijare respectively the family means of ith F1 and its jth mate,
i
S g and
ij
D
g are the fixed effects of the QTL genotype of each F1 animal and its mate, respectively (a and –a for homozygotes
i iQ
Q and qijqij, and d for heterozygote Qiqij), and eijk is the residual random effect, assumed to be normally and independently distributed in the ith family, with a variance ofσi2. In practice, for each F1 individual, the family mean, residual variance and QTL substitution effect were estimated, and for each Duroc individual, only the family mean and QTL substitution effect.
Three hypotheses were tested for a given trait: the usual null hypothesis “no QTL on the chromosome” (H0), the hypothesis of one QTL on the chromosome (H1), and the
hypothesis of two linked QTLs on the chromosome (H2). For each trait, H0 versus H1 was
test was performed for particular chromosomal regions. For the two-QTL model, we used the grid-search method, with QTL effects modelled as
iq ip i S S S g g g = + and ijq ijp ij D D D g g g = + , where: ijq iq ijp ip D S D S g g g
g , , , are fixed QTL effects of F1 animal and its mate at the p and q positions which were considered jointly.
Significance levels were determined empirically by 1,000 Monte Carlo simulations. To take into account missing genotypes, differences in marker density and family structure, only trait values were simulated under the null hypothesis model (normal distribution without QTL). The approximated Bonferroni correction of the type I error test was applied to the chromosome-wide significance levels to obtain the significance levels for genome-wide linkage.31 Briefly, the significance level for a specific chromosome is proportional to its contribution (r) to the total autosomal genome length. So, the genome-wide significance level,
(
)
r wide chromosome wide genome P P 1 1 1 −− = − − , is used to take account of testing the whole autosomal
genome.
In addition, most of the animals in this swine model developed melanoma in utero or in the perinatal period, suggesting that some aberrant epigenetic or imprinting effect might be responsible for melanoma. Consequently, QTL detection depending on parental origin (sire
versus dam) was performed on SSC2, which harbours an imprinting region.
RESULTS Family study
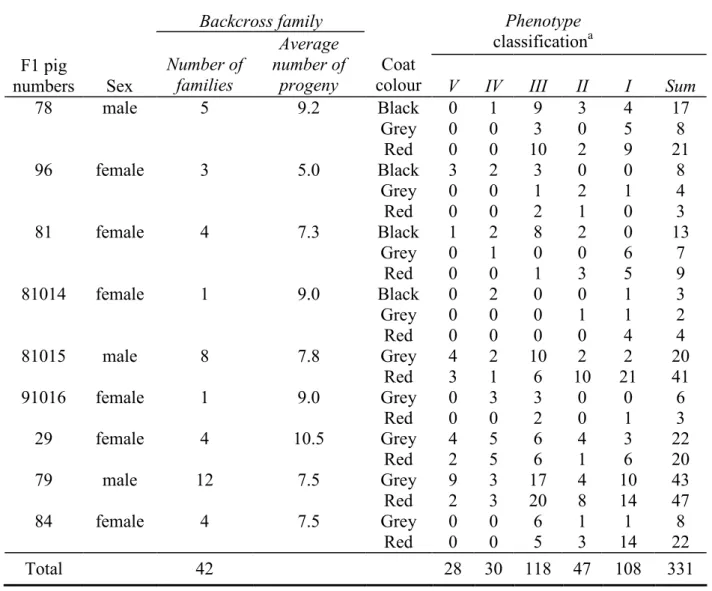
F1 animals were produced from 4 closely-related affected MeLiM pigs (B143, 7, 9025 and B310) whose origins could be traced back to MeLiM brothers H30 and H10, and healthy Duroc animals (91291D, 75015D, 51761D, 91299D and 270D, Figure 1), so that affected F1 pigs were expected to be heterozygous for potential susceptibility loci. Table 1 shows that, in all, 331 backcross animals (42 families), with 7.9 animals per family (range:
5.0-10.5), were generated by crossing 9 affected F1 pigs with 26 healthy Duroc animals for this genome-wide linkage study. Alleles of melanoma susceptibility loci were expected to segregate in this backcross generation. Thirty per cent of the F1 animals and 17.5% of the backcross animals developed melanoma (aggressive phenotypes IV and V), suggesting a complex melanoma inheritance with incomplete penetrance. The tests on the frequencies (PROC FREQ statistical analysis system, SAS) revealed that the melanoma occurred independently of the sex but not of coat colour as pigs with a black or grey coat developed significantly more melanoma than red pigs (P<0.05).
QTL mapping of the synthetic trait
To search for genetic linkage between genomic regions and melanoma development, the interval mapping method was applied to the genome scan performed with 153 microsatellite markers on 331 backcross animals. First, the single-QTL model was applied to a synthetic trait (ST) corresponding to the development of the tumours, after correction of the phenotypic data for sex and coat colour. QTLs were detected, at a significant chromosome-wide level only, on SSC1 (49.4 and 88.0 cM), 15 (86.5 cM) and 17 (39.8 cM) at a significant level (P<0.05), and on SSC13 (56.0 cM) at a very significant level (P<0.01, Figure 2). On SSC1, a QTL was also detected with raw data (P<0.05), with a maximum likelihood ratio test (LRT) at 96.0 cM, suggesting multiple locus segregation on this chromosome. In addition, a significant QTL was revealed on SSC2 at position 16.9 cM (P<0.05), in families derived from F1 males only. Three additional QTLs were detected at a suggestive chromosome-wide significance on SSC2, 7 and 14 (P<0.1). The maximum LRTs and their positions are shown in Table 2. Significant contributions of F1 individuals to the LRT are indicated, showing only one to three significant QTLs for some families, due to either differences in the informativity of genetic markers and the number of animals in each family or to different locus segregations.
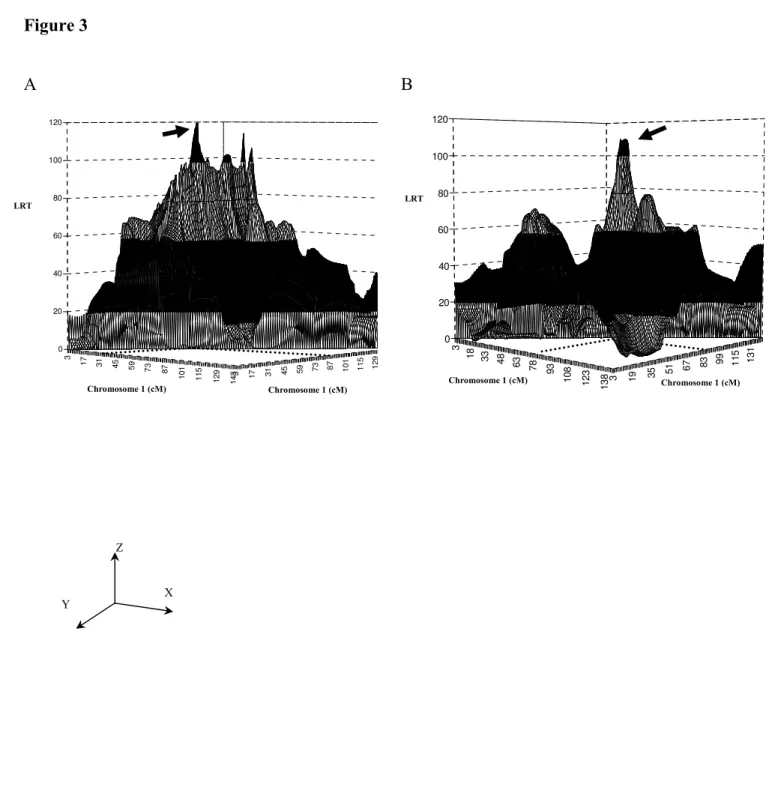
A grid search for two linked QTLs conducted on SSC1 for the synthetic trait, corrected for sex and coat colour, showed a pair of QTLs at 31.0 cM and 87.0 cM, with a very significant LRT (120.4, P<0.01, Figure 3A).
QTL mapping of specific traits
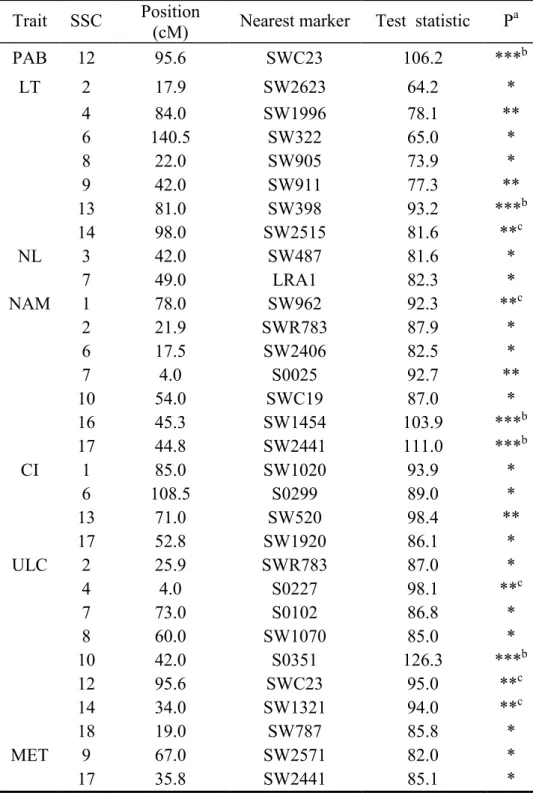
Seven precise specific traits were used with the aim of detecting more significant QTLs underlying different aspects of melanoma development, including clinical ulceration (ULC), presence of melanoma at birth (PAB), histological lesion type (LT), number of aggressive melanomas called “Malignant A” (NAM), presence of metastasis (MET), cutaneous invasion (CI) and the total number of lesions (NL). Application of the single-QTL model to these 7 traits revealed 5 QTLs, respectively on SSC10 (ULC), 12 (PAB), 13 (LT), and 16 and 17 (NAM) at a highly significant chromosome-wide level (P<0.001, Table 3 and Figure 4) and at a significant genome-wide level after approximated Bonferroni correction (P<0.05). Five other QTLs were respectively found on SSC1 (NAM), 14 (LT), 4, 12 and 14 (ULC), at a very significant chromosome-wide level (P<0.005) and a suggestive genome-wide level (P<0.1). For those 7 specific traits, 21 additional QTLs were detected at a significant chromosome-wide level (P<0.05 and P<0.01). Some QTLs for different traits were located close to each other on the same chromosome (e.g. PAB and ULC on SSC12; NAM and CI on SSC1), suggesting that close or pleiotropic gene(s) might segregate for those traits.
MC1R and Melanoma Predisposition
We previously observed an association between melanoma development in our MeLiM breed and the microsatellite S0035 located at 7.5 cM on SSC6, 2-3 cM downstream from the
MC1R gene.21 To test the relationship between MC1R and melanoma, we first sequenced this gene on DNA from 6 animals representing the 5 different alleles of the marker S0035 detected in the breed. The sequences of the entire coding regions were compared to the full swine
We found three MC1R alleles, MC1R*2, MC1R*4 and MC1R*6, as previously described,32 except that in all three, we observed an additional polymorphism in the second codon (Pro2, CCC to CCT). The MC1R*2 allele corresponded to black animals and to the S0035 alleles 1, 4 and 5, associated with black coat colour and melanoma. As more MeLiM and F1 families than backcross families segregated for black and red coat colour, we genotyped 478 animals for S0035 and MC1R, including all available MeLiM, F1 and backcross families. The Quantitative Transmission Disequilibrium test (QTDT) showed highly significant associations with raw data between both MC1R*2 and S0035-1 alleles and melanoma development (P=3×10⁻⁶ and 7×10⁻⁵ respectively). However, after stratification for sex and coat colour effects, only MC1R*2 which contained the Val95Met and Leu102Pro substitutions, was significantly associated with melanoma (P= 4×10⁻²), suggesting a direct role for MC1R or a close gene in melanoma susceptibility.
The frequency of melanoma according to MC1R genotypes (Figure 5) revealed that all the 17 pigs homozygous for the MC1R*2 allele developed melanoma. Animals heterozygous for this allele also developed more melanoma than the others, mainly when
MC1R*2 was associated with the MeLiM allele MC1R*6 instead of the Duroc allele MC1R*4. These results also suggest that MC1R or a closely linked gene plays an important
role on the development of melanoma, and that a close linked recessive gene may also cooperate. Application of the single-QTL model to the MeLiM, F1 and backcross families as a whole, for the synthetic trait, revealed a QTL at the MC1R position (P<0.01) with raw data only, suggesting that pigmentation also affects melanoma development (data not shown). Furthermore, when the general linear model (GLM) was used to search for 2 marker interactions between MC1R and other microsatellite markers over the whole genome, interactions were observed between MC1R and the markers S0316 and SW1653 located respectively at 33.4 cM and 49.4 cM on SSC1 (P<0.05). When the synthetic trait value was
corrected, not only for sex and coat colour, but also for MC1R genotype, the QTL at 49.4 cM on SSC1 was no longer detected, but a new QTL at 84.0 cM was mapped (Figure 6). In addition, application of the two-QTL model to these phenotypic data revealed a pair of QTLs at positions 77.0 cM and 85.0 cM on SSC1 (LRT: 109.0, P<0.001, Figure 3B).
Potential candidates for melanoma susceptibility
We used large-scale comparative mapping to select potential candidate melanoma susceptibility genes in homologous genomic regions between human and swine. As three potential QTL regions might exist on SSC1, which contains the HSA9p21 human counterpart, massive radiation hybrid (RH) mapping was done in swine for the genes lying on HSA9, to establish the relative positions of orthologous genes between HSA9 and SSC1. We found that two distinct regions on SSC1 were related to HSA9p21 (Figure 7). One region located at about 81.0 cM (SSC1q25), which might contain two melanoma QTLs, and the other, located at about 56 cM, which is included in the region displaying significant linkage with ST.
Comparative mapping was then done for other swine QTL regions by scanning the literature and available public genome mapping databases for humans and swine (see Table 5). The human chromosomal regions corresponding to the swine regions surrounding the main QTLs (peak position +/- 15 cM), as well as the breakpoints in QTL regions on pig chromosomes 1, 2, 13 and 16, are listed in Table 5. Among the potential candidate genes located in the swine QTL human counterparts, we selected, on the OMIM site, the genes involved in melanocytic neoplasia and other malignancies, tumour progression, cell cycle regulation and DNA repair. As swine melanoma originates from neonatal neural crest-derived melanocytes (NC-M), we also selected genes involved in childhood tumours and in the signalling pathways of melanocyte development connected with the NC-M survival and terminal differentiation. This analysis revealed that the human counterparts of some swine QTL regions such as HSA 9p21 and 9q21, 1p36, 3p25 and 16q24 were previously shown to
be related to melanoma. Similarly, some candidate genes have already been stated or suggested to play a role in human cutaneous melanoma, like the genes CDKN2A, MC1R,
MITF, and TP53. Lastly, potential candidates may lie on other human regions, mainly on
HSA 1q32-q44, 3p26-q22, 5q34-q35 or 18p11, 17p13-q12 and 20p12-q11, for both ST and the different specific traits which are governed by various loci.
DISCUSSION
In the present study, we reported the first significant genome-wide scan for melanoma susceptibility in animals. This study combined the data acquired in our preliminary study21 of the MeLiM swine model conducted on 79 backcross pigs with data obtained for 252 additional swine. We therefore increased the number of families, and also paid special attention to the phenotypes, using more precisely defined specific traits in order to improve power of QTL detection.
We detected four significant QTLs for the development of melanoma, defined by a synthetic trait (ST) combining all clinical and histological data, on chromosomes 1, 13, 15 and 17, irrespective of the sex of the affected F1 pigs. They were significant at the chromosome-wide level only, the QTL on SSC13 being the most significant (P<0.01). A fifth QTL was detected on SSC2, when data from affected F1 males only were used. Analysis of the data for 7 more precise traits (PAB, LT, NL, NAM, CI, ULC, and MET) revealed 31 additional QTLs. Five of these QTLs corresponding to 4 different traits (ULC, PAB, LT and NAM) on chromosomes 10, 12, 13, 16 and 17, were highly significant at chromosome-wide level, and reached genome-wide significance.
Compared to our previous analysis for the synthetic trait,21 we observed almost the same LRT profile on SSC1 in the present study, whereas the peak detected on SSC2 decreased in significance. The previous association on SSC6 in the MC1R region was also
confirmed by the finding that MC1R*2 allele was related to melanoma development. QTLs for ULC were observed on SSC7 (73 cM) and SSC8 (60cM) in the regions where associations were found with melanoma in the preliminary study.
A large number of QTLs was detected here but only 5 reached genome-wide significance. We used our QTLMAP program to analyse a mixture of full-sib and half- sib families.30 This program is designed to analyse continuous normally distributed traits in familial populations. The traits studied here were hardly within the normality hypothesis: synthetic trait (classes I to V) and some specific traits were categorical, and some were binary (PAB and ULC), usually with an unbalanced number of progeny in each class. Specific models have been previously developed within the QTLMAP software to account for such distributions of the data, using data transformations and threshold models.39 However, when the power of these models was compared to that of the usual Gaussian models, the general conclusions agreed for robustness of the Gaussian model. In the present study, data transformations of melanoma traits (not shown) were explored but did not significantly improve the analyses, thus justifying the choice of robust Gaussian models, although this choice may have reduced the general power of the analysis. The relatively small number of highly significant QTLs may also be due to the fact that, as in human models for melanoma occurrence, the traits analysed here are still complex and correspond to various physiological processes, especially the major trait (ST) which is a global symptom, interpreted as the result of numerous interacting and multigenic determinisms, from the time of disease onset to the severe stage. Such traits might therefore be affected by several QTLs. Analyses of traits specific for the different development phases of melanoma indeed led to higher significance, thus refining the individual phenotypes linked to the QTLs detected for ST. In addition, the recent origin of the MeLiM population, a hexahybrid cross obtained in the 1980s, appeared to be a source of the diversity of the haplotypes segregating in the F1 families. This diversity
allows the detection of more QTLs, but might cause the dispersion of heterozygous loci in different families, thus reducing the general power for the detection of individual loci. This reduction might be amplified by differences in family size and marker informativity. This is very similar to the multigenic inheritance observed in human populations exhibiting genetically linked melanoma. To overcome those limits, new genetic markers will be tested in the regions harboring the most significant QTLs and new families will be produced, to obtain new informative recombinations and refine the locations.
Among the 5 most significant QTLs detected in this study, the QTL for ULC on SSC 10 (42 cM) lies in a region homologous to the human 219-241 Mb area on HSA1q41-q44 (Table5). At this time, we did not find any potential candidate on the OMIM site. The QTL for PAB on SSC12 (95.6 cM) was mapped in the SSC12q12-q14 region containing the gene coding for the most common tumour suppressor p53, already suggested as being involved in predisposition to early-onset melanomas in humans.1 This candidate is in contradiction with the fact that the SSC12q12-q14 region is included in the region of chromosome gain (SSC12q) identified by Comparative Genomic Hybridization (CGH) analysis on both SSM and nodular melanomas in our pigs.40 However, this chromosomal gain correlated with the DNA amplification observed on HSA17q in human neuroblastoma, a childhood neoplasm that also arises from neural crest-derived cells. 41 The QTLs for LT and CI observed around 81 cM and 71 cM respectively on SSC13q are in agreement with the recurrent loss of SSC13q36-q49 restricted to nodular melanomas previously observed in our CGH study.40 This observation reinforces the idea that this region plays an important role in tumour invasion, since the growth of nodular melanoma, contrary to superficial spreading melanoma, starts both vertically and superficially. Note that the two QTLs may be governed by the same gene. Around 56 cM, also lies the most significant QTL for ST, underlining again the importance of this region for the development of melanomas in our pigs. The human counterpart for the 3
QTLs lies from HSA3p26 to 3q22, and harbours not only the melanoma uveal susceptibility locus UBM2, but also, numerous other potential candidate loci involved in cancer susceptibility, DNA repair, cell cycle regulation and signalling pathways suggested to play a role in melanoma (Table 5). For example, MITF, the master melanocyte regulator involved in the regulation of pigment genes and the melanocyte lineage survival, was recently shown to function as an oncogene in primary melanocytes bearing the V600E mutation in BRAF, and
MITF amplification in melanoma was found to correlate with a decrease in patient survival.42
Finally, two QTLs highly significant were detected for NAM on SSC16 (45.3 cM) and SSC17 (44.8 cM). The regions harbouring these QTLs on SSC16 and SSC17 correspond respectively to the HSA5q34-q35 (or HSA18p11.31) and to the HSA20p12-q11 regions. Both of them contain potential candidates listed in table 5. Like for SSC13, on SSC17, additional QTLs were also detected in the region between 35.8 cM and 52.8 cM, including QTLs for the development of melanoma, ST and EP, MET and CI, thus underlining the interest of this region and that of the corresponding human region.
The similar LRT profiles observed on SSC1 in our 2 separate studies and the fact that several QTLs lie in a swine region corresponding to several human counterparts displaying linkage with human melanoma (1p36, 9p21 and 9q21), reinforce the confidence in true QTL segregation on this chromosome, despite the low level of significance. The results with the single-QTL model revealed 2 significant areas around 49.4 cM and 88 cM, suggesting the presence of at least 2 QTLs on this chromosome. Then, analysis with the two-QTL model, the search for interactio ns between MC1R and chromosome markers, and the correction for the
MC1R genotype suggested the existence of at least 3 QTLs on SSC1, one in the 33.4-49.4 cM
region interacting with MC1R, and two others at positions 77 cM and 85 cM respectively. The overall results on SSC1 are shown on Figure 6. Analysis of specific traits led to a model in which one or both these QTLs might determine the relationship of NAM to tumour
development and that of CI to the invasion, two traits which showed significant QTLs with the single-QTL model. The 77-85 cM region contains the CDKN2A gene, but in the affected MeLiM parental strain, this gene was excluded as a major susceptibility gene in the first family by haplotype analysis of the 2 cM area surrounding CDKN2A,23 suggesting the existence of other susceptibility gene(s) in this chromosomal region. The possible presence of additional melanoma suppressor genes around the CDKN2A gene has already been suggested in humans, as a large proportion of families without a CDKN2A mutation displayed linkage to the 9p21 region. Evidence for the presence of additional tumour suppressor gene(s) in this region was provided both in familial analyses and in tumours, as well as in in vitro experiments using microcell hybrids.43-45 Our comparative mapping, using all available data, suggests that potential tumour susceptibility candidates such as the MTAP gene, located at about 82 cM (Figure 7), might be present on SSC1. The human MTAP gene is deleted in a subset of carcinomas,46 acts as a tumor suppressor in a breast cancer cell line47 and also seems to have a role in hepatocellular carcinoma development and invasiveness.48 In humans, the survival-related gene SRG located at 1p36.22, a region also linked to melanoma in certain human families,12 controls apoptosis and tumorigenesis.37 This gene, which is probably located at about 79 cM on SSC1 (Table 5), might be a melanoma-susceptibility candidate in both humans and swine.
We found in this study that after stratification for sex and coat colour, the MC1R*2 allele, which is dominant for black coat colour, was associated with melanoma, suggesting that MC1R is directly involved in its development. This result is in agreement with the fact that MC1R variants in humans might also increase the risk of melanoma independently of UV exposure and other clinical risk factors linked to pigmentation49,50 although the underlying mechanism is still unknown. In human melanocytes, α-MSH via its binding to MC1R stimulates cAMP formation, pigmentation and proliferation.51 The swine MC1R*2 allele
contains the amino acid substitution Val95Met which corresponds to the human substitution Val92Met. In humans, this substitution was first suggested to reduce the binding affinity of MC1R for a-MSH.52 However, human melanocytes ho mozygous for Val92Met have also been shown to increase significantly the response to a-MSH, suggesting that it did not induce a loss of function.53 The MC1R*2 allele contains also the amino acid substitution Leu102Pro suspected to induce constitutive activation of the MC1R receptor in animals with dark coat colour.54,55 If that is indeed the case, a constitutive cAMP level might be sufficient to up regulate the genes involved in cell survival via the targets of the cAMP signalling pathway in black swine,56 and thus explain the association observed in our model between black coat colour or MC1R*2 and predisposition to melanoma. In humans, the common MC1R variants Arg151Cys and Arg160Trp that are highly associated with red hair and fair skin57 and confer high melanoma risk, are not “loss of function” receptors. A recent study revealed that they retained considerable signalling capacity,58 arguing for a direct role of MC1R independently of pigmentation that might be common in individuals with dark or light complexion. In humans, MC1R variants also modify predisposition to melanoma in segregating families with
CDKN2A mutations.6-8 MC1R interactions detected in our study, with microsatellite markers on SSC1 located at 33.4 cM and 49.4 cM may also increase the effect of the alleles segregating for the QTLs on SSC1. In this study, only one marker, S0644(~81 cM), located within CDKN2A, has been genotyped in the MeLiM, F1 and backcross families. Interaction of MC1R and this marker was detected in these families (data not shown), however, new markers have to be tested to target the location of the highest interaction. The fact that red pigs also develop melanoma indicates that MC1R, or a close gene, is not a major gene, but acts probably as a modifier gene. We indeed cannot rule out the possibility that MC1R was a marker of other neighbouring gene(s) that play a role in carcinogenesis or in cell cycle regulation such as Gas11, SNAI3 or CDK10 (Table 5).
To conclude, we found putative QTLs underlying the development of melanoma in swine. These results confirm and greatly extend those of our preliminary study. Comparative mapping revealed that some of these swine QTL regions are homologous to human regions known to be involved in human cutaneous or uveal melanoma such as 1p36, 3p25, 9p21, 9q21 and 16q24, whereas others correspond to additional regions that should be investigated in human melanoma research, mainly on HSA 1q32-q44, 3p26-q22, 5q34-q35 or 18p11, 17p13-q12 and 20p12-q11. Conventional fine mapping and large-scale tumour expression analyses combined with a candidate approach will be the next steps. The availability of the swine whole genome sequence59 expected by the end of 2006 will greatly help to increase the density of markers, including single nucleotide polymorphisms, in the regions of interest, and to improve fine comparative mapping and detection of melanoma susceptibility candidates, both in humans and swine.
ACKNOWLEDGEMENTS
The authors are grateful to P. Bacon, F. Andréoletti, and all the SESP staff for animal care. We are also grateful to Mr Bussière of SEIA, Rouillé, France, for his assistance in swine artificial insemination. This work was supported by two French Institutions, CEA (Commissariat à l’Energie Atomique) and INRA (Institut National pour la Recherche Agronomique) and also by La Ligue Nationale contre le Cancer, grant N° PRE05/FD, and the Integrated Actions Programme (French Foreign Ministry France/Czech Republic, Barrande contract n° 04710WJ / n° 2002-029). As a post-doctoral fellow, ZQD was supported by fellowships from Région Ile-de-France and Foreign affairs departments from INRA and CEA. We thank Gérard Frelat for constant and active support for this project.
1. de Snoo FA, Hayward NK. Cutaneous melanoma susceptibility and progression genes. Cancer Lett. 2005;230:153-86
2. Laud K, Marian C, Avril MF, Barrois M, Chompret A, Goldstein AM, Tucker MA, Clark PA, Peters G, Chaudru V, Demenais F, Spatz A, et al. Comprehensive analysis of CDKN2A (p16INK4A/p14ARF) and CDKN2B genes in 53 melanoma index cases considered to be at heightened risk of melanoma. J. Med. Genet. 2006;43:39-47
3. Laud K, Kannengiesser C, Avril MF, Chompret A, Stoppa-Lyonnet D, Desjardins L, Eychene A, Demenais F, Lenoir GM, Bressac-de Paillerets B, French Hereditary Melanoma Study Group. BRAF as a melanoma susceptibility candidate gene? Cancer Res. 2003;63:3061-5
4. Meyer P, Sergi C, Garbe C. Polymorphisms of the BRAF gene predispose males to malignant melanoma. J. Carcinog. 2003;2:7
5. Palmer JS, Duffy DL, Box NF, Aitken JF, O'Gorman LE, Green AC, Hayward NK, Martin NG, Sturm RA. Melanocortin-1 receptor polymorphisms and risk of melanoma: is the association explained solely by pigmentation phenotype? Am. J. Hum. Genet. 2000;66:176-86
6. Box NF, Duffy DL, Chen W, Stark M, Martin NG, Sturm R, Hayward NK. MC1R genotype modifies risk of melanoma in families segregating CDKN2A mutations. Am. J. Hum. Genet. 2001;69:765-73
7. van der Velden PA, Sandkuijl LA, Bergman W, Pavel S, van Mourik L, Frants RR, Gruis NA. Melanocortin-1 receptor variant R151C modifies melanoma risk in Dutch families with melanoma. Am. J. Hum. Genet. 2001;69:774-9
8. Chaudru V, Laud K, Avril MF, Miniere A, Chompret A, Bressac-de Paillerets B, Demenais F. Melanocortin-1 receptor (MC1R) gene variants and dysplastic nevi modify
penetrance of CDKN2A mutations in French melanoma-prone pedigrees. Cancer Epidemiol. Biomarkers Prev. 2005;14:2384-90
9. Hayward NK. Genetics of melanoma predisposition. Oncogene 2003;22:3053-3062
10. Gillanders E, Juo SH, Holland EA, Jones M, Nancarrow D, Freas-Lutz D, Sood R, Park N, Faruque M, Markey C, Kefford RF, Palmer J, et al. Localization of a novel melanoma susceptibility locus to 1p22. Am. J. Hum. Genet. 2003;73:301-13
11. Walker GJ, Indsto JO, Sood R, Faruque MU, Hu P, Pollock PM, Duray P, Holland EA, Brown K, Kefford RF, Trent JM, Mann GJ, Hayward NK. Deletion mapping suggests that the 1p22 melanoma susceptibility gene is a tumor suppressor localized to a 9-Mb interval. Genes Chromosomes Cancer 2004;41:56-64
12. Goldstein AM, Goldin LR, Dracopoli NC, Clark WH Jr, Tucker MA. Two- locus linkage analysis of cutaneous malignant melanoma/dysplastic nevi. Am. J. Hum. Genet. 1996;58:1050-6
13. Jonsson G, Bendahl PO, Sandberg T, Kurbasic A, Staaf J, Sunde L, Cruger DG, Ingvar C, Olsson H, Borg A. Mapping of a novel ocular and cutaneous malignant melanoma susceptibility locus to chromosome 9q21.32. J. Natl. Cancer Inst. 2005;97:1377-82
14. Millikan LE, Boylon JL, Hook RR, Manning PJ. Melanoma in Sinclair swine: a new animal model. J. Invest. Dermatol. 1974;62:20-30
15. Müller S, Wanke R, Distl O. Inheritance of melanocytic lesions and their association with the white colour phenotype in miniature swine. J. Anim. Breed. Genet. 2001;118: 275-83 16. Horak V, Fortyn K, Hruban V, Klaudy J. Hereditary melanoblastoma in miniature pigs
and its successful therapy by devitalization technique. Cell. Mol. Biol., (Noisy- le-grand) 1999;45:1119-29
17. Vincent-Naulleau S, Le Chalony C, Leplat JJ, Bouet S, Bailly C, Spatz A, Vielh P, Avril MF, Tricaud Y, Gruand J, Horak V, Frelat G et al. Clinical and histopathological characterization of cutaneous melanomas in the melanoblastoma-bearing Libechov minipig model. Pigment Cell Res. 2004;17:24-35
18. Das Gupta TK, Ronan SG, Beattie CW, Shilkaitis A, Amoss MS Jr. Comparative histopathology of porcine and human cutaneous melanoma. Pediatr. Dermatol. 1989;6:289-99
19. Blangero J, Tissot RG, Beattie CW, Amoss MS Jr. Genetic determinants of cutaneous malignant melanoma in Sinclair swine. Br. J. Cancer 1996;73:667-71
20. Hruban V, Horak V, Fortyn K, Hradecky J, Klaudy J, Smith DM, Reisnerova H, Majzlik I. Inheritance of malignant melanoma in the MeLiM strain of miniature pigs. Vet. Med.-Czech 2004;49:453-9
21. Geffrotin C, Crechet F, Le Roy P, Le Chalony C, Leplat JJ, Iannuccelli N, Barbosa A, Renard C, Gruand J, Milan D, Horak V, Tricaud Y, et al. Identification of five chromosomal regions involved in predisposition to melanoma by genome-wide scan in the MeLiM swine model. Int. J. Cancer 2004;110:39-50
22. Le Chalony C, Hayes H, Frelat G, Geffrotin C. Identification and mapping of swine cyclin-dependent kinase inhibitor CDKN2A and CDKN2B exon 2 sequences. Cytogenet. Cell. Genet. 2000;88:240-3
23. Le Chalony C, Renard C, Vincent-Naulleau S, Crechet F, Leplat JJ, Tricaud Y, Horak V, Gruand J, Le Roy P, Frelat G, Geffrotin C. CDKN2A region polymorphis m and genetic susceptibility to melanoma in the melim swine model of familial melanoma. Int. J. Cancer 2003;103:631-5
24. Iannuccelli E, Woloszyn N, Arhainx J, Gellin J, Milan D. GEMMA: a database to manage and automate microsatellite genotyping. In: Proceedings of the XXVth International Conference on Animal Genetics, July 21-25, 1996, Tours, France
25. Yerle M, Pinton P, Robic A, Alfonso A, Palvadeau Y, Delcros C, Hawken R, Alexander L, Beattie C, Schook L, Milan D, Gellin J. Construction of a whole-genome radiation hybrid panel for high-resolution gene mapping in pigs. Cytogenet. Cell. Genet. 1998;82:182-8
26. Green P, Falls K, Crooks S. CRI-MAP documentation version 2.4, March 26, 1990
27. Wang M, Lemon WJ, Liu G, Wang Y, Iraqi FA, Malkinson AM, You M. Fine mapping and identification of candidate pulmonary adenoma susceptibility 1 genes using advanced intercross lines. Cancer Res. 2003;63:3317-24
28. Abecasis GR, Cardon LR, Cookson WOC. A general test of association for quantitative traits in nuclear families. Am. J. Hum. Genet. 2000;66:279-92
29. Elsen JM, Mangin B, Goffinet B, Boichard D, Le Roy P. Alternative models for QTL detection in livestock. I. General introduction. Genet. Sel. Evol. 1999;31:213-24
30. Le Roy P, Elsen JM, Boichard D, Mangin B, Bidanel JP, Goffinet B. An algorithm for QTL detection in a mixture of full and half-sib families, in: 6th World Congress of Genetics Applied to Livestock Production, Armidale, Australia, 11-16 January, 1998;26:257-60
31. de Koning DJ, Janss LL, Rattink AP, van Oers PA, de Vries BJ, Groenen MA, van der Poel JJ, de Groot PN, Brascamp EW, van Arendonk JA. Detection of quantitative trait loci for backfat thickness and intramuscular fat content in pigs (Sus scrofa). Genetics 1999;152:1679-90
32. Gustafsson AC, Kijas JM, Alderborn A, Uhlen M, Andersson L, Lundeberg J. Screening and scanning of single nucleotide polymorphisms in the pig melanocortin 1 receptor gene (MC1R) by pyrosequencing. Anim. Biotechnol. 2001;12:145-53
33. Nezer C, Moreau L, Brouwers B, Coppieters W, Detilleux J, Hanset R, Karim L, Kvasz A, Leroy P, Georges M. An imprinted QTL with major effect on muscle mass and fat deposition maps to the IGF2 locus in pigs. Nat. Genet. 1999;21:155-6
34. Robic A, Faraut T, Iannuccelli N, Lahbib-Mansais Y, Cantegrel V, Alexander L, Milan D. A new contribution to the integration of human and porcine genome maps: 623 new points of homology. Cytogenet. Genome Res. 2003;102:100-8
35. Rattink AP, Jungerius BJ, Faivre M, Chardon P, Harlizius B, Groenen MAM. Improving the comparative map of SSC2p-q13 by sample sequencing of BAC clones. Anim. Genet. 2001;32:274-80
36. Demeure O, Pomp D, Milan D, Rothschild MF, Tuggle CK. Mapping of 443 porcine EST improves the comparative maps for SSC1 and SSC7 with the human genome. Anim. Genet. 2005;36:381-9
37. Yuan ZR, Wang R, Solomon J, Luo X, Sun H, Zhang L, Shi Y. Identification and characterization of survival-related gene, a novel cell survival gene controlling apoptosis and tumorigenesis. Cancer Res. 2005;65:10716-24
38. Katoh M, Katoh M. Identification and characterization of human SNAIL3 (SNAI3) gene in silico. Int. J. Mol. Med. 2003;11:383-8
39. Tilquin P, Coppieters W, Elsen JM, Lantier F, Moreno C, Baret PV. Statistical power of QTL mapping methods applied to bacteria counts. Genet. Res. 2001;78:303-16
40. Apiou F, Vincent-Naulleau S, Spatz A, Vielh P, Geffrotin C, Frelat G, Dutrillaux B, Le Chalony C. Comparative genomic hybridization analysis of hereditary swine cutaneous
melanoma revealed loss of the swine 13q36-49 chromosomal region in the nodular melanoma subtype. Int. J. Cancer 2004;110:232-8
41. van Noesel MM, Versteeg R. Pediatric neuroblastomas: genetic and epigenetic 'danse macabre'. Gene 2004;325:1-15
42. Garraway LA, Widlund HR, Rubin MA, Getz G, Berger AJ, Ramaswamy S, Beroukhim R, Milner DA, Granter SR, Du J, Lee C, Wagner SN, et al. Integrative genomic analyses identify MITF as a lineage survival oncogene amplified in malignant melanoma. Nature 2005;436:117-22
43. van der Velden PA, Sandkuijl LA, Bergman W, Hille ET, Frants RR, Gruis NA. A locus linked to p16 modifies melanoma risk in Dutch familial atypical multiple mole melanoma (FAMMM) syndrome families. Genome Res. 1999;9:575-80
44. Parris CN, Harris JD, Griffin DK, Cuthbert AP, Silver AJ, Newbold RF. Functional evidence of novel tumor suppressor genes for cutaneous malignant melanoma. Cancer Res. 1999;59:516-20
45. Pollock PM, Welch J, Hayward NK. Evidence for three tumor suppressor loci on chromosome 9p involved in melanoma development. Cancer Res. 2001;61:1154-61
46. Schmid M, Malicki D, Nobori T, Rosenbach MD, Campbell K, Carson DA, Carrera CJ. Homozygous deletions of methylthioadenosine phosphorylase (MTAP) are more frequent than p16INK4A (CDKN2) homozygous deletions in primary non-small cell lung cancers (NSCLC). Oncogene 1998;17:2669-75
47. Christopher SA, Diegelman P, Porter CW, Kruger WD. Methylthioadenosine phosphorylase, a gene frequently codeleted with p16(cdkN2a/ARF), acts as a tumor suppressor in a breast cancer cell line. Cancer Res. 2002;62:6639-44
48. Hellerbrand C, Muhlbauer M, Wallner S, Schuierer M, Behrmann I, Bataille F, Weiss T, Scholmerich J, Bosserhoff AK. Promoter- hypermethylation is causing functional relevant downregulation of methylthioadenosine phosphorylase (MTAP) expression in hepatocellular carcinoma. Carcinogenesis 2006;27:64-72
49. Matichard E, Verpillat P, Meziani R, Gerard B, Descamps V, Legroux E, Burnouf M, Bertrand G, Bouscarat F, Archimbaud A, Picard C, Ollivaud L, et al. Melanocortin 1 receptor (MC1R) gene variants may increase the risk of melanoma in France independently of clinical risk factors and UV exposure. J. Med. Genet. 2004;41:e13
50. Landi MT, Kanetsky PA, Tsang S, Gold B, Munroe D, Rebbeck T, Swoyer J, Ter-Minassian M, Hedayati M, Grossman L, Goldstein AM, Calista D, Pfeiffer RM. MC1R, ASIP, and DNA repair in sporadic and familial melanoma in a Mediterranean population. J. Natl. Cancer Inst. 2005;97:998-1007
51. Suzuki I, Cone RD, IM S, Nordlund J, Abdel-Malek ZA. Binding of melanotropic hormones to the melanocortin receptor MC1R on human melanocytes stimulates proliferation and melanogenesis. Endocrinology 1996;137(5):1627-33
52. Xu X, Thornwall M, Lundin LG, Chhajlani V. Val92Met variant of the melanocyte stimulating hormone receptor gene. Nat. Genet. 1996;14(4):384
53. Scott MC, Wakamatsu K, Ito S, Kadekaro AL, Kobayashi N, Groden J, Kavanagh R, Takakuwa T, Virador V, Hearing VJ, Abdel-Malek ZA. Human melanocortin 1 receptor variants, receptor function and melanocyte response to UV radiation. J. Cell Sci. 2002;115:2349-55.
54. Robbins LS, Nadeau JH, Johnson KR, Kelly MA, Roselli-Rehfuss L, Baack E, Mountjoy KG, Cone RD. Pigmentation phenotypes of variant extension locus alleles result from point mutations that alter MSH receptor function. Cell 1993;72:827-34
55. Kijas JM, Wales R, Tornsten A, Chardon P, Moller M, Andersson L. Melanocortin receptor 1 (MC1R) mutations and coat color in pigs. Genetics 1998;150:1177-85
56. Busca R, Berra E, Gaggioli C, Khaled M, Bille K, Marchetti B, Thyss R, Fitsialos G, Larribère L, Berlotto C, Virolle T, Barbry P, et al. Hypoxia- inducible factor 1 α is a new target of microphthalmia-associated transcription factor (MITF) in melanoma cells. J. Cell Biol. 2005;170:49-59
57. Kennedy C, ter Huurne J, Berkhout M, Gruis N, Bastiaens M, Bergman W, Willemze R, Bavinck JN. Melanocortin 1 receptor (MC1R) gene variants are associated with an increased risk for cutaneous melanoma which is largely independent of skin type and hair color. J. Invest. Dermatol. 2001;117(2):294-300
58. Newton RA, Smit SE, Barnes CC, Pedley J, Parsons PG, Sturm RA. Activation of the cAMP pathway by variant human MC1R alleles expressed in HEK and in melanoma cells. Peptides. 2005;26(10):1818-24.
59. Schook LB, Beever JE, Rogers J, Humphray S, Archibald A, Chardon P, Milan D, Rohrer G Eversole K. Swine genome sequencing consortium (SGSC): a strategic roadmap for sequencing the pig genome. Comp. Funct. Genom. 2005;6:251-5
LEGENDS TO FIGURES
Figure 1. Origin of F1 pigs. Asterisks signify that these 4 MeLiM pigs, which can be traced back to MeLiM brothers H10 and H30, were used for production of F1 animals. Filled squares and circles represent affected animals, and empty squares and circles, unaffected animals. Animals with letter D are of Duroc origin.
Figure 2. Likelihood ratio test (LRT) statistic profiles. LRT statistic profiles for QTL detection (1-QTL model) on the Synthetic Trait (raw data and data corrected for sex and coat colour) on SSC1 (A), SSC13 (B), SSC15 (C), SSC17 (D), and SSC2 (E). A significant QTL on SSC 2, after statistical adjustment, was only detected with animals derived from F1 males. Thresholds are indicated at chromosome-wide level. Triangles indicate microsatellite marker positions.
Figure 3. Two-QTL model detection on SSC1, without (A) or with (B) correction for the
MC1R genotype. A, Arrow indicates that two QTLs at 31 cM and 87 cM are located on SSC1
using the Synthetic Trait corrected for sex and coat colour effect, and without correction on the MC1R genotype. B, With further correction for MC1R genotypes, one pair of QTLs at 77 cM and 85 cM were mapped. Horizontal X and Y axes: chromosomal genetic positions in centiMorgan. Vertical Z axis: likelihood ratio test value.
Figure 4. Likelihood ratio test statistic profiles of significant QTLs identified for 4 specific traits (1-QTL model). A, Presence of melanoma A at birth: Only one QTL was detected for this trait, at one end of SSC12 and at a 1‰ chromosome-wide significance level,
which corresponds to 5% genome-wide significance. B, Lesion type: Two genome-wide significant QTLs, at 5% and at a suggestive 10% level, on SSC13 and SSC14, respectively. C, Number of melanoma A tumors: Two 5% genome-wide significant QTLs on SSC16 and SSC17 respectively, and one suggestive 10% genome-wide significant QTL on SSC1. D, Ulceration: One 5% genome-wide significant QTL on SSC10, and three other suggestive 10% genome-wide significant QTLs on SSC4, SSC12, and SSC14 respectively.
Figure 5. Association between the risk of melanoma and the MC1R genotype. The figure represents the frequency of melanoma according to MC1R genotypes. The synthetic trait value (Y-axis) is plotted against each MC1R genotype combination of alleles 2, 4 and 6, as defined in Table 4 (X-axis).
Figure 6. Likelihood ratio test statistic profiles for significant QTLs detected on SSC1 (1-QTL model). The different coloured curves correspond to the different QTLs detected on SSC1. Arrows indicate the significant peak positions for each trait. One asterisk: significant at 5% chromosome-wide level. Two asterisks: 1% chromosome-wide significance. Blue curve: one QTL for Cutaneous Invasion located at 85cM (5% chromosome-wide level). Green curve: a QTL for Tumor Number of Melanoma A located at 78cM, (1% chromosome-wide level). Red dotted curve: a QTL identified for raw data at 96cM (5% chromosome-wide level). Light blue curve: a QTL at 49cM detected after correction for sex and coat color (5% chromosome-wide level). Vio let curve: a QTL at 84cM detected when data were further corrected by MC1R genotype (5% chromosome-wide level).
Figure 7. Comparative mapping between the HSA9 and QTL locations on SSC1. Massive radiation hybrid mapping in swine of genes lying on HSA9 revealed that genes homologous to HSA9p21 genes are present in two genomic regions on SSC1, at about 56 cM and 80 cM, corresponding to two statistically significant peaks (P<0.01). The vertical dashed and dash-dotted lines represent the significant thresholds at 5% and 10%, respectively.
Table 1. Family structure of F1 pigs with melanoma, backcrossed with healthy Duroc pigs.
Backcross family Phenotype
classificationa F1 pig numbers Sex Number of families Average number of progeny Coat
colour V IV III II I Sum
78 male 5 9.2 Black 0 1 9 3 4 17 Grey 0 0 3 0 5 8 Red 0 0 10 2 9 21 96 female 3 5.0 Black 3 2 3 0 0 8 Grey 0 0 1 2 1 4 Red 0 0 2 1 0 3 81 female 4 7.3 Black 1 2 8 2 0 13 Grey 0 1 0 0 6 7 Red 0 0 1 3 5 9 81014 female 1 9.0 Black 0 2 0 0 1 3 Grey 0 0 0 1 1 2 Red 0 0 0 0 4 4 81015 male 8 7.8 Grey 4 2 10 2 2 20 Red 3 1 6 10 21 41 91016 female 1 9.0 Grey 0 3 3 0 0 6 Red 0 0 2 0 1 3 29 female 4 10.5 Grey 4 5 6 4 3 22 Red 2 5 6 1 6 20 79 male 12 7.5 Grey 9 3 17 4 10 43 Red 2 3 20 8 14 47 84 female 4 7.5 Grey 0 0 6 1 1 8 Red 0 0 5 3 14 22 Total 42 28 30 118 47 108 331 a
Phenotype I: pigs with no pigmented lesions; Phenotype II: pigs with only flat lesions; Phenotype III: pigs bearing small raised lesions with a slow growth phase (SSM or NM – Clark’s levels II to IV) or flat lesions classified as SSM-Clark’s level I; Phenotypes IV and V: pigs with melanomas; some of them exhibited fast growth (Phenotype V, also called Malignant A), and others, slow growth (Phenotype IV or Malignant B).
Table 2. Interval mapping results for the Synthetic Trait in the backcross population. Significant QTLs at F1 family level SSC Position (cM) Nearest marker Test statistic P a 78 ♂ 96 ♀ 81 ♀ 14 ♀ 15 ♂ 16 ♀ 29 ♀ 79 ♂ 84 ♀ 1 49.4 SW1653 84.9 * * * 1 88 SW1020 80.6 * * 2 9.9 SW2623 70.5 + * 16.9b SW2623 51.1 * 7 4.0 S0025 72.8 + * 13 56.0 SW2448 93.0 ** * 14 46.0 SW1709 72.4 + ** 15 86.5 SW936 79.4 * * 17 39.8 SW2441 83.2 * a
Chromosome-wide significance (** 1%; * 5%; + 10%). These QTLs are not significant at
genome-wide level after Bonferroni correction.
b
Table 3. Quantitative trait loci detection of specific traits
Trait SSC Position
(cM) Nearest marker Test statistic P
a PAB 12 95.6 SWC23 106.2 ***b LT 2 17.9 SW2623 64.2 * 4 84.0 SW1996 78.1 ** 6 140.5 SW322 65.0 * 8 22.0 SW905 73.9 * 9 42.0 SW911 77.3 ** 13 81.0 SW398 93.2 ***b 14 98.0 SW2515 81.6 **c NL 3 42.0 SW487 81.6 * 7 49.0 LRA1 82.3 * NAM 1 78.0 SW962 92.3 **c 2 21.9 SWR783 87.9 * 6 17.5 SW2406 82.5 * 7 4.0 S0025 92.7 ** 10 54.0 SWC19 87.0 * 16 45.3 SW1454 103.9 ***b 17 44.8 SW2441 111.0 ***b CI 1 85.0 SW1020 93.9 * 6 108.5 S0299 89.0 * 13 71.0 SW520 98.4 ** 17 52.8 SW1920 86.1 * ULC 2 25.9 SWR783 87.0 * 4 4.0 S0227 98.1 **c 7 73.0 S0102 86.8 * 8 60.0 SW1070 85.0 * 10 42.0 S0351 126.3 ***b 12 95.6 SWC23 95.0 **c 14 34.0 SW1321 94.0 **c 18 19.0 SW787 85.8 * MET 9 67.0 SW2571 82.0 * 17 35.8 SW2441 85.1 * a
Chromosome-wide significance: * 5%, ** 1% and *** 1‰.
b
Genome-wide significance: (5%) (after Bonferroni correction).
Table 4. MC1R gene polymorphisms
MC1R alleles were determined by sequencing and compared in MeLiM and Duroc pigs, versus European wild boar (EWB) (23). MC1R alleles 2, 4 and 6 in the melanoma herd (MeLiM, F1 and Backcross families) were determined after analysis of PCR amplification of
codons 17 and 22 by single-stranded conformational polymorphism (SSCP) method.
Codon MC1R allele S0035 allele Coat colour Breed 2 17 22 95 102 121 124 164 243
MC1R*1 WT EWB CCC GCG CGG GTG CTG AAT GAC GCG GCG
Pro Ala Arg Val Leu Asn Asp Ala Ala
MC1R*2 1,4,5 Black MeLiM - - T - - A A - - - C - - - C - - A Met Pro MC1R*6 2 Red MeLiM - - T + CC A - - Asn MC1R*4 2,3 Red Duroc - - T - T - A - - Val Thr
Table 5. Putative candidate genes for MeLiM melanoma selected through swine-human comparative mapping
Quantitative trait loci (QTLs) are shown by chromosome. Only porcine chromosome regions bearing at least two QTLs or one highly significant QTL (P<0.001) are shown.
Potential Candidate Genesf
SSC Trait a Marker and QTL Positions (cM)b Nearest Markers or Genes Swine Cytogenetic Bandc Human Homologous Cytogenetic Bandd Human Physical Position (Mb)e
Gene MIM Name Functional involvement
1 23.5 SW317 6q25.1 149
6q24.1 146.6 GRM1 604473 Glutamate receptor
metabotropic 1 Melanocytic neoplasia
29 SW1332 6q24.2 145.4 ST2 31* 43.5 S008 1p22-p23 6q23.2 131.9 ST1 , EP 49.4* SW1653 6q12 65.67 55.8 SW781 1p13 9p21.2 27.15 ~55.8 TEK (Fig.7) 9p21.2 27.15 58.5 SW1430 6q14.1 81.1 60.2 SW1668 18 43 67.6 SW2185 6q14.1 81 67.6 SWR702 15 44-54i 73 S0331 18q22.3 67.8 ST2 , NAM 78** 79.4 SW2073 15q22.2 60.9 EST(AR021B04) 1p36.22 10.5i 1p36.22 SRG Yuan et
al. 2005 Survival-related gene
Novel cell survival gene controlling apoptosis and tumorigenesis
79.4 SW1846 14q21-q22 40-53i
~81 CDKN2A 1q25 9p21.3 21.96 CDKN2A 600160 Cyclin- dependent kinase
inhibitor 2A Melanocytic neoplasia
81 SW780 1q21-q27 9p22 19.9
82.4 SW216
~82.4 MTAP1 (Fig.7) 9p21.3 21.85 MTAP1 156540 Methylthioadenosine
phosphorylase Inactivation in several carcinomas
83.2 S0142 9p22.3 16.3