Publisher’s version / Version de l'éditeur:
PLoS ONE, 8, 7, pp. e68433:1-e68433:7, 2013-07-30
READ THESE TERMS AND CONDITIONS CAREFULLY BEFORE USING THIS WEBSITE. https://nrc-publications.canada.ca/eng/copyright
Vous avez des questions? Nous pouvons vous aider. Pour communiquer directement avec un auteur, consultez la
première page de la revue dans laquelle son article a été publié afin de trouver ses coordonnées. Si vous n’arrivez pas à les repérer, communiquez avec nous à PublicationsArchive-ArchivesPublications@nrc-cnrc.gc.ca.
Questions? Contact the NRC Publications Archive team at
PublicationsArchive-ArchivesPublications@nrc-cnrc.gc.ca. If you wish to email the authors directly, please see the first page of the publication for their contact information.
NRC Publications Archive
Archives des publications du CNRC
This publication could be one of several versions: author’s original, accepted manuscript or the publisher’s version. / La version de cette publication peut être l’une des suivantes : la version prépublication de l’auteur, la version acceptée du manuscrit ou la version de l’éditeur.
For the publisher’s version, please access the DOI link below./ Pour consulter la version de l’éditeur, utilisez le lien DOI ci-dessous.
https://doi.org/10.1371/journal.pone.0068433
Access and use of this website and the material on it are subject to the Terms and Conditions set forth at
Mapping of quantitative trait Loci underlying cold tolerance in rice
seedlings via high-throughput sequencing of pooled extremes
Yang, Zemao; Huang, Daiquing; Tang, Weiqi; Zheng, Yan; Liang, Kangjing;
Cutler, Adrian J.; Wu, Weiren
https://publications-cnrc.canada.ca/fra/droits
L’accès à ce site Web et l’utilisation de son contenu sont assujettis aux conditions présentées dans le site LISEZ CES CONDITIONS ATTENTIVEMENT AVANT D’UTILISER CE SITE WEB.
NRC Publications Record / Notice d'Archives des publications de CNRC:
https://nrc-publications.canada.ca/eng/view/object/?id=3850677b-ee20-4765-bb7b-e4c6ca24d6c9
https://publications-cnrc.canada.ca/fra/voir/objet/?id=3850677b-ee20-4765-bb7b-e4c6ca24d6c9
Tolerance in Rice Seedlings via High-Throughput
Sequencing of Pooled Extremes
Zemao Yang1., Daiqing Huang2., Weiqi Tang3., Yan Zheng3, Kangjing Liang3, Adrian J. Cutler2*, Weiren Wu1,3*
1Department of Agronomy, College of Agriculture and Biotechnology, Zhejiang University, Hangzhou, Zhejiang, China, 2 National Research Council of Canada, Saskatoon, Saskatchewan, Canada, 3 Key Laboratory of Ministry of Education for Genetics, Breeding and Multiple Utilization of Crops, Fujian Agriculture and Forestry University, Fuzhou, Fujian, China
Abstract
Low temperature is a major limiting factor in rice growth and development. Mapping of quantitative trait loci (QTLs) controlling cold tolerance is important for rice breeding. Recent studies have suggested that bulked segregant analysis (BSA) combined with next-generation sequencing (NGS) can be an efficient and cost-effective way for QTL mapping. In this study, we employed NGS-assisted BSA to map QTLs conferring cold tolerance at the seedling stage in rice. By deep sequencing of a pair of large DNA pools acquired from a very large F3 population (10,800 individuals), we obtained
,450,000 single nucleotide polymorphisms (SNPs) after strict screening. We employed two statistical methods for QTL analysis based on these SNPs, which yielded consistent results. Six QTLs were mapped on chromosomes 1, 2, 5, 8 and 10. The three most significant QTLs on chromosomes 1, 2 and 8 were validated by comparison with previous studies. Two QTLs on chromosomes 2 and 5 were also identified previously, but at the booting stage rather than the seedling stage, suggesting that some QTLs may function at different developmental stages, which would be useful for cold tolerance breeding in rice. Compared with previously reported QTL mapping studies for cold tolerance in rice based on the traditional approaches, the results of this study demonstrated the advantages of NGS-assisted BSA in both efficiency and statistical power.
Citation:Yang Z, Huang D, Tang W, Zheng Y, Liang K, et al. (2013) Mapping of Quantitative Trait Loci Underlying Cold Tolerance in Rice Seedlings via High-Throughput Sequencing of Pooled Extremes. PLoS ONE 8(7): e68433. doi:10.1371/journal.pone.0068433
Editor:Rongling Wu, Pennsylvania State University, United States of America ReceivedMarch 5, 2013; Accepted May 29, 2013; Published July 30, 2013
Copyright: ß2013 Yang et al. This is an open-access article distributed under the terms of the Creative Commons Attribution License, which permits unrestricted use, distribution, and reproduction in any medium, provided the original author and source are credited.
Funding:These authors have no support or funding to report.
Competing Interests:The authors have declared that no competing interests exist. * E-mail: Adrian.Cutler@nrc-cnrc.gc.ca (AJC); wuwr@zju.edu.cn (WW)
. These authors contributed equally to this work.
Introduction
Many traits of agronomic importance in crops, including those related to abiotic stress tolerance, are quantitatively inherited. The genomic regions containing genes controlling a given quantitative trait are known as quantitative trait loci (QTLs). QTL mapping is one of the most common approaches for the genetic study of quantitative traits, which provides the basis for map-based cloning of related genes and marker-assisted selection (MAS) in crop breeding. However, QTL mapping is usually carried out by genotyping a large number of individuals that are progeny of a biparental cross, which is labor-intensive, time-consuming and costly.
The strategy of bulked segregant analysis (BSA) proposed by Michelmore et al. [1] provides a simple and effective approach to rapidly search for markers linked to specific genes or QTLs affecting a trait of interest by genotyping only a pair of pooled DNA samples from two sets of individuals with distinct or opposite extreme phenotypes. Since 2000, high-throughput genotyping technologies based on microarray [2] and next generation sequencing (NGS) [3] have developed very quickly. Using these technologies, BSA can identify large numbers of markers linked to
the target genes or QTLs. Based on these linked markers, the target genes or QTLs can be directly mapped by referring to reference genome sequences. Hence, with the availability of high-throughput genotyping technologies and with reference genome sequences from more and more species, BSA is becoming an increasingly useful approach for gene or QTL mapping.
Many studies on the methodology and application of the high-throughput genotyping-assisted BSA have been reported, but they have been mainly focused on qualitative traits [4]–[9] while those on quantitative traits are still very limited. Wolyn et al. [10] first proposed an approach named eXtreme Array Mapping (XAM), which combines microarray-based genotyping with BSA for QTL mapping. With a practical example in Arabidopsis thaliana and a simulation study, they demonstrated that the method is effective for mapping single major QTLs. Later studies in yeast (Saccharo-myces cerevisiae) [11] and by simulation [12] also demonstrated the effectiveness of microarray-assisted BSA in mapping major QTLs. Ehrenreich et al. [13] first applied NGS to BSA for QTL mapping. By utilizing NGS-assisted BSA as well as microarray-assisted BSA, they mapped a number of QTLs for 17 chemical resistance traits in yeast (S. cerevisiae), showing that the methods are applicable to various quantitative traits with different levels of genetic
complex-ity, ranging from simple ones influenced by a major locus to very complex traits affected by at least 20 loci. Magwene et al. [14] proposed a statistical framework for QTL mapping based on NGS-assisted BSA and applied it to analyzing colony morphology in yeast (S. cerevisiae) as a demonstration. Swinnen et al. [15] mapped three major QTLs and additional minor QTLs conferring ethanol tolerance in yeast (S. cerevisiae) using NGS-assisted BSA. The studies reported have been largely conducted in yeast (S. cerevisiae). Only until recently, a study was reported using NGS-assisted BSA for QTL mapping in rice, in which they mapped several QTLs underlying resistance to rice blast, grain amylose content and germination rate under low temperature, demon-strating the applicability of the approach to plants [16].
Low temperature is one of the main abiotic stresses in rice cultivation. Low temperature in early spring can lead to slower growth, discoloration, withering, or even seedling death. There-fore, improvement of Cold Tolerance at the Seedling Stage (CTSS) is important for stable rice production. CTSS in rice is a complex trait controlled by multiple genes [17], [18]. A number of QTLs underlying CTSS have been mapped in rice using traditional molecular marker technologies and QTL mapping methods [19]–[27], and two major QTLs have been fine mapped [25], [28], [29]. In this study, we chose rice CTSS as an example for investigating the feasibility and efficiency of NGS-assisted BSA for QTL mapping in plants. Since many QTLs for CTSS have been mapped in rice before, it is possible for us to evaluate the reliability of the QTLs mapped in this study by comparison. Compared with the study of Takagi et al. [16], our study was performed using a much larger segregating population and a pair of much bigger pools of extreme segregants as well as a much higher sequencing depth for the NGS-assisted BSA, hoping to exploit as far as possible the potential of the approach in the precision mapping of QTLs.
Materials and Methods Plant materials
An F3population was created for the experiment from a cross
between a japonica rice variety Nipponbare, of which the whole genome sequence is publicly available, and an indica rice variety LPBG developed by Fujian Agriculture and Forestry University. Our preparative had indicated that Nipponbare is more tolerant to low temperature than LPBG.
Seed sowing and planting
Pregerminated seeds of the mapping population were sown on clean sand contained in rectangular (35625 cm2) plastic trays, with 225 seeds per tray (15 rows615 seeds/row). Seedlings were grown at 25uC in a greenhouse. The sand was kept wet by watering daily with tap water and applying Yoshida nutrient solution [30] every 3 days after the seedlings had reached the two-leaf stage. One hundred seeds of each parental line were also sown to provide a reference.
Identification of individuals with extreme phenotypes on cold tolerance
Seedlings with uniform growth performance at the three-leaf stage were treated with low temperature in a phytotron growth chamber under a cycle of 12-h light (15000 LX) and 12-h dark. The seedlings were initially exposed to 14uC for 2 h, followed by 12uC for 4 h and 10uC for 4 h. During this period, the seedlings that were the most sensitive to cold (i.e., became withered) were identified visually as the extremely sensitive (ES) individuals, and were transplanted to the normal growth condition for recovery.
The remaining seedlings were kept in the chamber and the temperature continued to incrementally decrease from 9uC for 14 h, 8uC for 6 h and 7uC for 2 h. During this period, most of the seedlings died, but a small proportion of seedlings survived and appeared normal. The surviving seedlings were collected as the extremely tolerant (ET) individuals and transplanted to the normal growth condition for recovery. A total of 48 trays were screened in 6 batches, with 8 trays for each batch. In each batch, ,70 ES and ET individuals were selected, each accounting for ,4% of total seedlings tested.
DNA isolation and sequencing
A segment of fresh leaf (,0.02 g) was excised from each selected seedling. Leaf tissues from 430 ES and 385 ET seedlings were pooled separately to extract DNA using the CTAB method [31]. The two DNA pools were purified with the GenElute Plant Genomic DNA Miniprep Kit (Sigma-Aldrich, St. Louis, MO, USA), respectively. A genomic DNA library was prepared for each DNA pool using the Illumina TruSeq DNA Sample Preparation Kit (Illumina Inc., San Diego, CA, USA) according to the manufacturer’s instructions. Each DNA library was sequenced using an Illumina Hiseq 2000 sequencing platform. All raw high-throughput sequencing data have been deposited in the SRA database with accession number SRP021494.
Data processing and SNP identification
The raw DNA-seq reads were trimmed and filtered to remove low-quality sequences via a modified Mott trimming algorithm implemented by a custom Perl script that we wrote by referring to the CLC Genomics Workbench quality trimming tools. An error probability limit of 0.05 and an ambiguous nucleotide limit of 2 were applied and reads shorter than 25 bp were discarded. The preprocessed reads that passed the quality control were then aligned to the published rice (Nipponbare) reference genome (RGAP 7; http://rice.plantbiology.msu.edu/) using the program Bowtie 0.12.7 [32] with the following parameter settings: -n 2 -l 20 -e 100 –best –strata -a -m 1. Reads aligned to more than one position in the reference genome were filtered out. Based on the mapping files (SAM files) of both pools generated by Bowtie, SNP identification was performed using the Bayesian model imple-mented by the programs mpileup and bcftools of SAMTools [33] with the parameter of base PHRED quality filtering cutoff set to 20. To avoid the influence of segregation bias from the theoretical ratio (1:1) between the two parental alleles and small sample size (sequencing depth) of individual SNPs on QTL analysis, the identified SNPs were further filtered according to the following requirements: 1) the overall Nipponbare allele frequency of a SNP in the whole pool (the two pools as a whole) was neither,20% nor .80%; 2) the total depth of a SNP in the whole pool was neither ,100 nor .400; and 3) the depth of a SNP in each pool was not ,40.
QTL analysis
With the SNPs selected, QTL analysis was performed using the method proposed by Magwene et al. [14]. A sliding window with a fixed width of 1000 kb was used to calculate the value of statistic G9 at every SNP so as to identify the genomic regions that showed G9 peaks, which indicated the possibility of QTL existence. The G9 value at a SNP was calculated using the following formula under the condition that the SNP was located at the centre of a window:
G’~X
j
kjGj
where Gjand kjare the values of statistic G and weight k at the jth
SNP, and the sum includes all SNPs within the window. The G value at a SNP was calculated using the following formula:
G~2X 4 i~1 niln ni ^ n ni
where n1and n2, and n3and n4, are the counts of the alleles from
parent 1 (e.g. Nipponbare in this study), and parent 2 (LPBG), in the low trait value (ES) and the high trait value (ET) pools, respectively; and ^nni is the expected value for ni under the null
hypothesis (H0: there are no QTLs linked to the SNP), e.g.
^ n
n1~(n1zn2)(n1zn3)=(n1zn2zn3zn4). The k value at a SNP in
a window was calculated using the following formula:
kj~ (1{D3 j) 3 P j (1{D3 j)3
where Djis the standardized distance from the window centre to
the jth SNP, of which the value varies from 0 (at the window centre) to 1 (at the window edge); and the sum again is for all the SNPs within the window.
The significance threshold of G9 was estimated using an emprical approach proposed by Magwene et al. [14] with a little modification. The approach is based on the assumptions that G9 asymptotically follows a log-normal distribution under the null hypothesis and the observed distribution of G9 is a mixture of the null distribution (in non-QTL regions) and several contaminating distributions (in QTL regions) [14]. The procedure is [14]: (1) Calculate x = ln(G9) for all G9 values. (2) Find Median(x). (3) Calculate z = Median(x)2x for all x#Median(x). (4) Find Med-ian(z). (5) Construct a trimmed data set of G9 values by discarding those G9 values for which x2Median(x).5.26Median(z). (6) Find Median(G9) and Mode(G9) in the trimmed data set and calculate the approximate estimates m = ln[Median(G9)] and s2= m
2ln[Mo-de(G9)] for the null distribution lnN(m, s2). (7) Calculate the p values of all the G9 values using the estimated null distribution. (8) Sort the p values in the order of small to large, namely, p1,p2,…,pi,…,pn. (9) For a required false discovery rate
(FDR) q*, find the largest i (denoted as k) for which pi#q*6i/n. (10)
Calculate the corresponding G9 value of pk, which is the
approximate estimate of G9 threshold at the significance level of the required FDR.
The key point in the above approach is to estimate the null distribution parameters, m and s2 of ln(G9), by treating the G9 values from the contaminating distributions as outliers, which need to be identified and removed. For this purpose, it is important to reduce the proportion of contaminating components in the mixture distribution as much as possible. Therefore, instead of using all the G9 values, we only chose those from the regions that were less likely to harbor QTLs for the estimation of the null distribution parameters. In addition, to reduce the influence of uneven distribution of G9 values in the genome and correlations between closely linked G9 values, we did not use the whole G9 values but randomly selected one G9 value every 200 kb from the putative non-QTL regions for estimating the null distribution parameters. This procedure was repeated 20 times, and their averages were taken as the estimates of the null distribution parameters. With the null distribution obtained, the probabilities of a subset of G9 values were estimated and the p-value threshold as well as the corresponding G9 threshold for the FDR of 0.05 was estimated. The G9 subset was obtained by randomly selecting one
G9 value every 200 kb across the whole genome for the similar reasons mentioned above and a consideration that a space of 200 kb between testing points, which is approximately equivalent to 1 cM on average in rice, could provide sufficient resolution for QTL mapping, while the residual G9 values are redundant.
Apart from the above analysis, we also employed the method of Jensen-Shannon divergence to detect differential SNPs (regions with an imbalance between allelic contributions from the two parents) between the two pools with a Bonferroni FWER multiple test correction at an overall significance level of 0.05 implemented by the GeneSpring NGS (Agilent Technologies). The genomic regions with a high frequency of differential SNPs also indicated a high likelihood of containing QTLs and therefore could provide a validation for the result of the G9 analysis.
In addition, to identify which parent possesses the resistant allele of a putative QTL, the profile of Nipponbare allele frequency difference (NAFD) between the ET and ES pools was plotted using a 300-kb sliding window moving across the genome with a fixed step length of 10 kb. The Nipponbare allele frequency (fN) within
a window in a pool was estimated using the following formula:
fN~ Pm i~1 nNi Pm i~1 (nNiznLi)
where m is the total number of SNPs within the window; and nNi
and nLiare the numbers of Nipponbare allele and LPBG allele of
the ith SNP, respectively. For a putative QTL, the Nipponbare
allele would act to increase the cold tolerance if NAFD.0, but to decrease the cold tolerance if NAFD,0.
Results
In total, 10,800 F3 seedlings from the cross between rice
varieties Nipponbare and LPBG were tested for cold tolerance, from which 430 ES and 385 ET individuals were selected and a pair of DNA pools was obtained. Through high-throughput sequencing of the two DNA pools, a total of ,800 M 101-bp pair-end reads were obtained, with approximately 360 M and 440 M from the ES and ET pools, respectively (Table 1). After trimming and filtering, over 99% of the reads were selected in both pools, with the average length reduced to ,98 bp. About 70% of the selected reads were mapped to unique positions in the reference (Nipponbare) genome (Table 1). These uniquely mapped reads covered ,92% of the genome in both pools, with an average depth of ,70 and 89 in the ES and ET pools, respectively, or ,158 altogether (Table 2).
Based on the uniquely mapped reads, a total of 456,777 SNPs met the chosen requirements for QTL analysis (see Materials and methods). These SNPs showed an approximately symmetric unimodal distribution of the Nipponbare allele frequency in the whole pool with an average of ,45%, which was close to the expected value 50%, suggesting that the genetic segregation of these SNPs was approximately normal. However, the distribution of these SNPs in the genome was not even. The SNP density (shown as the number of SNPs per Mb or within the sliding window) varied greatly within the genome (Figure 1A).
Calculation of G9 values at these SNPs showed that there were five large major G9 peaks located on chromosomes 1, 2, 5, 8 and 10, with the peaks on chromosomes 1 and 8 being the highest (Figure 1B), suggesting that these five major G9 peaks were likely QTL regions. Hence, we excluded them and only selected G9 values from other regions to estimate the null distribution of G9.
The obtained null distribution was lnN(0.9945, 0.3315) (Figure 2), according to which the significance threshold of G9 for the FDR of 0.05 was estimated to be 11.81. The five major G9 peaks with putative QTLs all greatly exceeded the threshold (Figure 1B), indicating that these five major G9 peak regions in high likelihood contain QTLs.
Jensen-Shannon divergence analysis indicated that the differ-ential SNPs between the two pools were basically distributed in the five major G9 peak regions, showing profiles consistent with the corresponding G9 peaks (Figure 1C). These results further support the assertion that the five major G9 peak regions contain QTLs. We named these QTLs as qCTSS-1 (abbreviation of ‘‘quantitative trait locus for CTSS on chromosome 1’’; similar for others), qCTSS-2, qCTSS-5, qCTSS-8 and qCTSS-10, respectively.
Apart from the five major G9 peaks, there were several small (minor) G9 peaks scattered throughout the genome (Figure 1B). Four of them were at the margin of significance, with two (towards the left end of chromosomes 2 and 8) slightly exceeding and two (one at the left end of chromosome 1, the other at the right end of chromosome 9) nearly reaching the threshold; while all others were apparently under the threshold (Figure 1B). For reliability, we only took the major G9 peaks as QTLs.
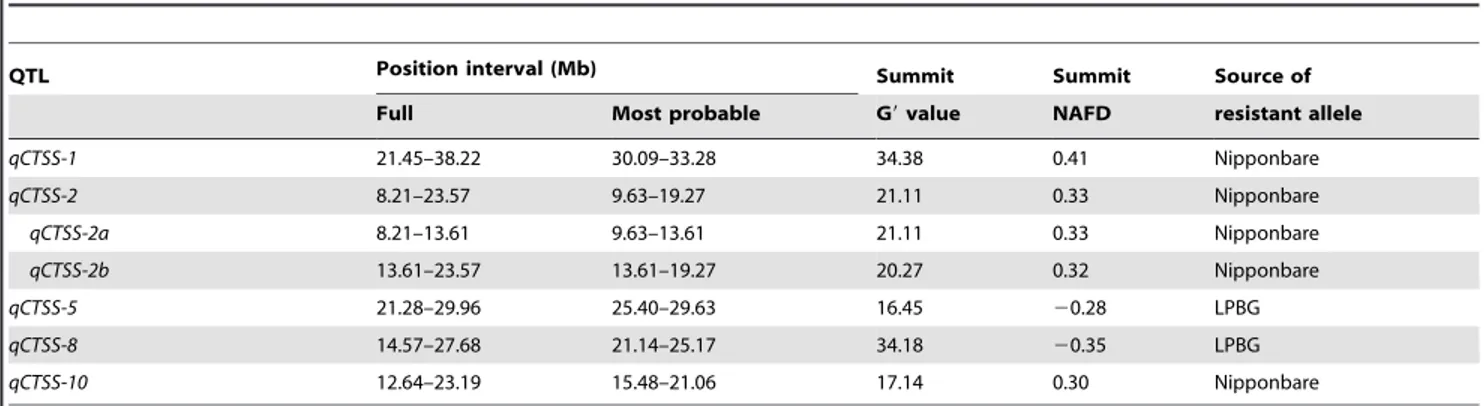
The full intervals of the QTLs (or the regions covered by the major G9 peaks) were all very wide, ranging from 8.68 Mb for qCTSS-5 to 15.36 Mb for qCTSS-2 (Figure 1B; Table 3). However, it can be seen that each of the major G9 peaks exhibited a clear ‘‘shoulder’’, which divided the peak into two distinct parts, the ‘‘head’’ part over the ‘‘shoulder’’ and the ‘‘body’’ part under the ‘‘shoulder’’ (Figure 1B). Obviously, each QTL should be most probably located within the region covered by the ‘‘head’’ part of the corresponding G9 peak. Hence, we took the ‘‘head’’-covered regions as the most probable intervals of the QTLs, which were all much narrower than the full intervals except for qCTSS-2 (Figure 1B; Table 3).
The profile of NAFD between the ET and ES pools (Figure 1D) was consistent with the G9 profile (Figure 1B). The summit NAFD value of a QTL can reflect the size of the effect and the direction of action of the Nipponbare allele of the QTL. It can be seen that qCTSS-1 showed the largest effect, followed by qCTSS-8, qCTSS-2, qCTSS-10 and qCTSS-5; and the resistant alleles of qCTSS-1,
qCTSS-2 and qCTSS-10 were from Nipponbare, while those of qCTSS-5 and qCTSS-8 were from LPBG (Figure 1D; Table 3). This is consistent with the fact that Nipponbare is more tolerant than LPBG to low temperature stress (see Materials and Methods).
It is noticeable that the major G9 peak on chromosome 2 displayed a wide fluctuating top without a clear peak and appeared to be a mixture of two adjacent component peaks divided by a shallow valley (Figure 1B). By referring to NCBI mapview (http:// www.ncbi.nlm.nih.gov/ mapview/), we found that the lowest point of the valley (at ,13.61 Mb) happened to fall inside the centromere region (ranging approximately 13.57–13.75 Mb), where no genes were annotated. Therefore, the putative QTL in this region could only be located at either side of the centromere. However, if this was the case, it can be expected that the G9 profile in this region would exhibit a clear sharp peak and there would be no valley at the centromere. Thus, in light of the result, we suspect that there might be two QTLs harbored in this region, with one on each side of the centromere (named as qCTSS-2a and qCTSS-2b, respectively; Table 3). These two QTLs must be linked in coupling phase, with both resistant alleles coming from Nipponbare. The two component peaks that represented the two QTLs could not be clearly separated from each other, probably because of the generally low recombination rate in the centromere region.
Comparing Figure 1A and B, we see that there is no obvious correlation between G9 value and SNP density. However, it can be found that the major G9 peak regions all have high (or at least not very low) SNP density, and there were few large G9 values found in the regions with very low SNP density. This implies that G9 values tend to be underestimated within regions of very low SNP density. We have noticed that the SNP density was very low in the region between the minor and the major G9 peaks on chromosome 2. This means that the G9 values in this region might be underestimated. If this was true, the minor G9 peak might be an artefact and actually be a part of the major G9 peak.
Discussion
Traditional QTL mapping methods require that every individ-ual in a mapping population is genotyped and phenotyped. Genotyping with traditional molecular marker technologies is Table 1.Statistics of sequencing results.
DNA pool Number of raw reads Trimmed and filtered reads Uniquely mapped reads
Number % Number %
ES 356,193,956 353,856,120 99.34 244,801,282 69.18
ET 442,404,686 439,177,251 99.27 309,826,517 70.55
Total 798,598,642 793,033,371 99.30 554,627,799 69.94
doi:10.1371/journal.pone.0068433.t001
Table 2.Coverage of the rice genome by the uniquely mapped reads.
DNA pool Coverage length (bp) Coverage rate (%) Total length of reads (bp) Coverage depth
ES 342,446,650 91.75 24,152,244,325 70.53
ET 340,022,302 91.10 30,351,271,370 89.26
Total 344,387,370 92.27 54,503,515,695 158.26
Note: The size of the reference genome is 373,245,519 bp. doi:10.1371/journal.pone.0068433.t002
laborious and time-consuming and therefore has been a bottleneck for QTL mapping studies. In recent years, NGS technologies have been utilized to genotype mapping populations [34], [35]. This greatly increases the efficiency of genotyping and enables the construction of a genetic map with very high marker density. Hence, it would be very useful for QTL mapping. However, genome resequencing for hundreds of individuals is expensive and laborious. This limits the size of the population that can be used for QTL mapping. In contrast, NGS-assisted BSA only involves a pair of pooled DNA samples. Therefore, it is much cheaper and less laborious and has no limitation on population size for genotyping work.
In some cases, phenotyping can also be a bottleneck for QTL mapping studies, especially for the traits that are difficult to quantify. The target trait of this study is an example. CTSS is a complex trait, which is difficult to measure precisely and quantitatively, and is usually measured with various artificial scale systems such as the 1–9 scale system [19], [26] and the 0–4 scale system [24] or some related indices such as seedling survival percentage [20], [22], seedling mortality [23] or cold response
Figure 1. Statistical difference between the two pools along the genome revealed by three methods.A: SNP distribution in the genome. B: G9 value profile. The horizontal dotted line shows the significance threshold for FDR#0.05. The upper longer and lower shorter horizontal bars under each major G9 peak indicate the ranges of the full and the most probable intervals of a putative QTL, respectively. The downward black arrowhead marked as CM within the interval of qCTSS-2 indicates the position of centromere on chromosome 2. C: Distribution of differential SNPs in the genome. D: Profile of Nipponbare allele frequency difference.
doi:10.1371/journal.pone.0068433.g001
Figure 2. Frequency histogram and estimated null distribution ofG9 values. The G9 values were sampled by randomly selecting one every 200 kb from the whole genome excluding the five major G9 peak regions.
index calculated based on seedling vigor traits [21]. All of these indices of CTSS can only be measured based on lines. Therefore, rice QTL mapping studies for CTSS so far were all conducted based on populations of recombinant inbred lines, doubled haploid lines and F2:3 lines [19]–[26]. Compared with the
traditional QTL mapping methods, NGS-assisted BSA has the very desirable feature that it does not require the precise trait value of each individual (or line) but only requires identification of the individuals (or lines) that exhibit opposite extreme phenotypes. This is not difficult in general because opposite extreme individuals (or lines) can usually be distinguished easily. In addition, BSA is more insensitive to the occasional phenotyping mistake [4]. This means that the requirement for phenotyping in NGS-assisted BSA is less stringent than in the traditional QTL mapping methods. Hence, QTL mapping by NGS-assisted BSA can be carried out based on a population of individuals rather than lines, even for such trait as CTSS, as demonstrated in this study. Taken together, it is clear that NGS-assisted BSA makes both genotyping and phenotyping much easier and cheaper and thus greatly simplifies and accelerates QTL mapping. In addition, NGS-assisted BSA allows using a very large population, which increases the statistical power [13].
In this study, using a very large F3population, we mapped 6
QTLs conferring CTSS in rice by NGS-assisted BSA (Table 3). The number of QTLs mapped by traditional QTL mapping methods is generally smaller, varying between 0 and 6, with an average of 3.0, according to previous studies of QTL mapping for CTSS in rice [17]–[24]. These results suggest that NGS-assisted BSA could be equally or more powerful than the traditional QTL mapping.
Among the 6 QTLs mapped in this study, the three most significant ones (qCTSS-1, qCTSS-2b and qCTSS-8) have been detected before (Table 4). For comparison, we identified the physical positions of the flanking markers of reported QTLs by referring to the Gramene database (http://www.gramene.org/) or by searching the rice genome with the markers’ primer sequences using the BLAST program. By comparing Tables 3 and 4, it can be seen that the marker intervals of qCTS1, qCTS-2 and qCTS8-1 are all contained in the full intervals and largely overlapped with the most probable intervals of qCTSS-1, qCTSS-2b and qCTSS-8, respectively. These results indicate the reliability of QTL mapping based on NGS-assisted BSA.
The other three QTLs identified in this study are novel for the CTSS trait in rice. However, QTLs controlling cold tolerance at the booting stage have been reported in the regions of qCTSS-2a and qCTSS-5 (Table 4). It can be seen that the position intervals of these reported QTLs (Table 4) coincide with those of qCTSS-2a and qCTSS-5 (Table 3), implying that they might be the same QTLs. This result further verifies the reliability of NGS-assisted BSA in QTL mapping. In addition, it also suggests that some QTLs controlling cold tolerance may function at different developmental stages in rice. A similar result has been reported before [34]. These QTLs would be particularly useful for cold tolerance breeding in rice.
Another merit of using NGS-assisted BSA for QTL mapping is that the genomic sequence data obtained by NGS allows identification of the allelic variation (polymorphisms) between the parents, which will facilitate subsequent fine mapping and positional cloning of the QTLs. With the large number of identified polymorphisms, it will be easy to develop appropriate markers for the marker-assisted breeding of isogenic lines, which are generally required for fine mapping of QTLs. In addition, the identified sequence variations in genes combined with the information such as gene annotation and gene expression from other sources will be helpful for the identification of candidate genes of the QTLs. In this study, we identified all the genes that show amino acid variations between the parental varieties and significant responses to low temperature stress within the most probable intervals of the mapped QTLs (Tables S1, S2, S3, S4, S5, Table 4.Common QTL regions conferring cold tolerance in
rice identified in the present study and previous studies.
QTL
Acting
stage Marker interval (Mb) Reference qCTSS-1 qCTS1 Seedling RM297-RM319 (32.10–33.68) [19] qCTSS-2a qCTB2 Booting RM324-RM301 (11.39–12.22) [37] qCTSS-2b qCTS-2 Seedling RM561-RM341 (18.77–19.34) [22] qCTSS-5 qCTB5 Booting RM26-RM334 (27.40–28.55) [37] qCTB-5-1 Booting RM7452-RM7271 (26.99–27.03) [36] qCTB-5-2 Booting RM19106-RM31 (27.89–28.61) [36] qCTSS-8 qCTS8-1 Seedling RM284-RM230 (21.14–25.84) [19] doi:10.1371/journal.pone.0068433.t004
Table 3.QTLs conferring cold tolerance at seedling stage in rice mapped in this study.
QTL Position interval (Mb) Summit Summit Source of
Full Most probable G9 value NAFD resistant allele
qCTSS-1 21.45–38.22 30.09–33.28 34.38 0.41 Nipponbare qCTSS-2 8.21–23.57 9.63–19.27 21.11 0.33 Nipponbare qCTSS-2a 8.21–13.61 9.63–13.61 21.11 0.33 Nipponbare qCTSS-2b 13.61–23.57 13.61–19.27 20.27 0.32 Nipponbare qCTSS-5 21.28–29.96 25.40–29.63 16.45 20.28 LPBG qCTSS-8 14.57–27.68 21.14–25.17 34.18 20.35 LPBG qCTSS-10 12.64–23.19 15.48–21.06 17.14 0.30 Nipponbare doi:10.1371/journal.pone.0068433.t003
S6 in File SI), which could serve as the preferred list of candidate genes for these QTLs in further studies.
Supporting Information
File S1 Tables S1, S2, S3, S4, S5, S6. (XLS)
Author Contributions
Conceived and designed the experiments: WW AJC. Performed the experiments: ZY DH. Analyzed the data: WT DH ZY. Contributed reagents/materials/analysis tools: YZ KL. Wrote the paper: ZY DH WT WW AJC.
References
1. Michelmore RW, Paran I, Kesseli RV (1991) Identification of markers linked to disease-resistance genes by bulked segregant analysis: a rapid method to detect markers in specific genomic regions by using segregating populations. Proc Natl Acad Sci USA 88: 9828–9832.
2. Kumar A, Goel G, Fehrenbach E, Puniya AK, Singh K (2005) Microarrays: the technology, analysis and application. Engineering in Life Sciences 5: 215–222. 3. Shendure J, Ji H (2008) Next-generation DNA sequencing. Nature Biotechnol
26: 1135–1141.
4. Schneeberger K, Ossowski S, Lanz C, Juul T, Petersen AH, et al. (2009) SHOREmap: simultaneous mapping and mutation identification by deep sequencing. Nat Methods 6: 550–551.
5. Wenger JW, Schwartz K, Sherlock G (2010) Bulk segregant analysis by high-throughput sequencing reveals a novel xylose utilization gene from Saccharomyces cerevisiae. PLoS Genetics, 6: 5, e1000942.
6. Austin RS, Vidaurre D, Stamatiou G, Breit R, Provart NJ, et al. (2011) Next-generation mapping of Arabidopsis genes. Plant J 67: 715–725.
7. Mokry M, Nijman IJ, Dijken A, Benjamins R, Heidstra R, et al. (2011) Identification of factors required for meristem function in Arabidopsis using a novel next generation sequencing fast forward genetics approach. BMC Genomics 12: 256.
8. Abe A, Kosugi S, Yoshida K, Natsume S, Takagi H, et al. (2012) Genome sequencing reveals agronomically important loci in rice using MutMap. Nat Biotechnol 30: 174–178
9. Trick M, Long Y, Meng JL, Bancroft I (2009) Single nucleotide polymorphism (SNP) discovery in the polyploid Brassica napus using Solexa transcriptome sequencing. Plant Biotechnol J 7: 334–346.
10. Wolyn DJ, Borevitz JO, Loudet O, Schwartz C, Maloof J, et al. (2004) Light-response quantitative trait loci identified with composite interval and eXtreme array mapping in Arabidopsis thaliana. Genetics 167: 907–917.
11. Brauer MJ, Christianson CM, Pai DA, Dunham MJ (2006) Mapping novel traits by array-assisted bulk segregant analysis in Saccharomyces cerevisiae. Genetics 173: 1813–1816.
12. Becker A, Chao DY, Zhang X, Salt DE, Baxter I (2011) Bulk segregant analysis using single nucleotide polymorphism microarrays. PLoS ONE 6: e15993. 13. Ehrenreich IM, Torabi N, Jia Y, Kent J, Martis S, et al. (2010) Dissection of
genetically complex traits with extremely large pools of yeast segregants. Nature 464:1039–1042.
14. Magwene PM, Willis JH, Kelly JK. (2011) The statistics of bulk segregant analysis using next generation sequencing. PLoS Comput Biol 7: e1002255. 15. Swinnen S, Schaerlaekens K, Pais T, Claesen J, Hubmann G, et al. (2012)
Identification of novel causative genes determining the complex trait of high ethanol tolerance in yeast using pooled-segregant whole-genome sequence analysis. Genome Res 22: 975–984.
16. Takagi H, Abe A, Yoshida K, Kosugi S, Natsume S, et al. (2013) QTL-seq: Rapid mapping of quantitative trait loci in rice by whole genome resequencing of DNA from two bulked populations. Plant J (on line first) doi: 10.1111/ tpj.12105
17. Dilday RH (1990) Contribution of ancestral lines in the development of new cultivars of rice. Crop Sci 30: 905–911.
18. Glaszmann JC, Kaw RN, Khush GS (1990) Genetic divergence among cold tolerant rices (Oryza sativa). Euphytica 45: 95–104.
19. Andaya VC, Mackill DJ (2003a) Mapping of QTLs associated with cold tolerance during the vegetative stage in rice. J Expt Bot 54: 2579–2585. 20. Zhang ZH, Su L, Li W, Chen W, Zhu YG (2005) A major QTL conferring cold
tolerance at the early seedling stage using recombinant inbred lines of rice (Oryza sativa L.). Plant Sci 168: 527–534.
21. Han LZ, Qiao YL, Zhang SY, Gao GL, Kim JH, et al. (2007) Identification of quantitative trait loci for cold response of seedling vigor traits in rice. J Genet Genom 34: 239–246.
22. Lou QJ, Chen L, Sun ZX (2007) A major QTL associated with cold tolerance at seedling stage in rice (Oryza sativa L.). Euphytica 158: 87–94.
23. Jiang L, Xun M, Wang J, Wan J (2008) QTL analysis of cold tolerance at seedling stage in rice (Oryza sativa L.) using recombination inbred lines. J Cereal Sci 48: 173–179.
24. Baruah AR, Ishigo-Oka N, Adachi M, Oguma Y, Tokizonz Y, et al. (2009) Cold tolerance at the early growth stage in wild and cultivated rice. Euphytica 165: 459–470.
25. Koseki M, Kitazawa N, Yonebayashi S, Maehara Y, Wang ZX, et al. (2010) Identification and fine mapping of a major quantitative trait locus originating from wild rice, controlling cold tolerance at the seedling stage. Mol Genet Genomics 284: 45–54.
26. Wang ZF, Wang FF, Zhou R (2011) Identification of quantitative trait loci for cold tolerance during the germination and seedling stages in rice. Euphytica 181: 405–413.
27. Suh JP, Lee CK, Lee JH, Kim S, Cho Y, et al. (2012) Identification of quantitative trait loci for seedling cold tolerance using RILs derived from a cross between japonica and tropical japonica rice cultivars. Euphytica 184:101–108. 28. Andaya VC, Tai TH (2006) Fine mapping of the qCTS12 locus, a major QTL
for seedling cold tolerance in rice. Theor Appl Genet 113: 467–475. 29. Andaya VC, Tai TH (2007) Fine mapping of the qCTS4 locus associated with
seedling cold tolerance in rice (Oryza sativa L.). Mol Breed 20: 349–358. 30. Yoshida S, Forno DA, Cock JH, Gomez KA (1976) Laboratory manual for
physiological studies of rice. Int Rice Res Ins Philippines: 61–66.
31. Porebski S, Bailey LG, Bernard R (1997) Modification of a CTAB DNA extraction protocol for plants containing high polysaccharide and polyphenol components. Plant Mol Biol Rep 15: 8–15.
32. Langmead B, Trapnell C, Pop M, Salzberg SL (2009) Ultrafast and memory-efficient alignment of short DNA sequences to the human genome. Genome Biol 10: R25.
33. Li H, Handsaker B, Wysoker A, Fennell T, Ruan J, et al. (2009) The sequence alignment/map format and samtools. Bioinformatics 25: 2078–2079. 34. Huang X, Feng Q, Qian Q, Zhao Q, Wang L, et al. (2009) High-throughput
genotyping by whole-genome resequencing. Genome Res 19: 1068–1076. 35. Xie W, Feng Q, Yua H, Huang X, Zhao Q, et al. (2010) Parent-independent
genotyping for constructing an ultrahigh-density linkage map based on population sequencing. Proc Natl Acad Sci USA 107: 10578–10583. 36. Xu LM, Zhou L, Zeng YW, Wang FM, Zhang HL, et al. (2008) Identification
and mapping of quantitative trait loci for cold tolerance at the booting stage in a japonica rice near isogenic line. Plant Sci 174: 340–347.
37. Andaya VC, Mackill DJ (2003b) QTLs conferring cold tolerance at the booting stage of rice using recombinant inbred lines from a japonica x indica cross. Theor Appl Genet 106: 1084–1090.