ORIGINAL PAPER
Measuring multiple neurochemicals and related metabolites
in blood and brain of the rhesus monkey by using dual
microdialysis sampling and capillary hydrophilic
interaction chromatography
–mass spectrometry
Juan Li&Veronika von Pföstl&Daniel Zaldivar&
Xiaozhe Zhang&Nikos Logothetis&Alexander Rauch
Received: 7 June 2011 / Revised: 25 August 2011 / Accepted: 17 September 2011 / Published online: 29 September 2011 # Springer-Verlag 2011
Abstract In vivo measurement of multiple functionally related neurochemicals and metabolites (NMs) is highly interesting but remains challenging in the field of basic neuroscience and clinical research. We present here an analytical method for determining five functionally and metabolically related polar substances, including acetylcho-line (quaternary ammonium), lactate and pyruvate (organic acids), as well as glutamine and glutamate (amino acids). These NMs are acquired from samples of the brain and the blood of non-human primates in parallel by dual micro-dialysis, and subsequently analyzed by a direct capillary hydrophilic interaction chromatography (HILIC)–mass
spectrometry (MS) based method. To obtain high sensitivity in electrospray ionization (ESI)–MS, lactate and pyruvate were detected in negative ionization mode whereas the other NMs were detected in positive ionization mode during each HILIC-MS run. The method was validated for linearity, the limits of detection and quantification, preci-sion, accuracy, stability and matrix effect. The detection limit of acetylcholine, lactate, pyruvate, glutamine, and glutamate was 150 pM, 3 μM, 2 μM, 5 nM, and 50 nM, respectively. This allowed us to quantitatively and simulta-neously measure the concentrations of all the substances from the acquired dialysates. The concentration ratios of both lactate/pyruvate and glutamine/glutamate were found to be higher in the brain compared to blood (p<0.05). The reliable and simultaneous quantification of these five NMs from brain and blood samples allows us to investigate their relative distribution in the brain and blood, and most importantly paves the way for future non-invasive studies of the functional and metabolic relation of these substances to each other.
Keywords Neurochemicals . HILIC-MS . Microdialysis . Rhesus monkey . Brain . Blood
Introduction
The physiological function of neurons and the correct information processing within the brain depend critically on neuroactive molecules and metabolites (NMs). These NMs consisting of neurotransmitters like glutamate or neuro-modulators like acetylcholine can be detected by appropri-ate techniques in the extracellular fluid of the brain. The concentrations of these NMs are tightly controlled and
Juan Li and Veronika von Pföstl contributed equally to this paper. Published in the special issue Analytical Sciences in Switzerland with guest editors P. Dittrich, D. Günther, G. Hopfgartner, and R. Zenobi. J. Li
:
V. von Pföstl:
D. Zaldivar:
N. Logothetis:
A. Rauch (*) Max Planck Institute for Biological Cybernetics,Spemannstrasse 38, 72076 Tübingen, Germany e-mail: arauch@tuebingen.mpg.de X. Zhang (*)
Department of Medicine, University of Fribourg, Chemin de Musee 5,
Fribourg 1700, Switzerland e-mail: xiaozhe.zhang@unifr.ch N. Logothetis
Division of Imaging Science and Biomedical Engineering, University of Manchester,
Manchester M13 9PT, UK D. Zaldivar
Graduate School of Neural and Behavioural Science/International Max Planck Research School, University Tübingen,
72074 Tübingen, Germany DOI 10.1007/s00216-011-5427-z
stable within narrow boundaries. Many disorders of the central nervous system (CNS) such as Parkinson’s disease [1], Alzheimer’s disease [2], and schizophrenia [3], are correlated with or even caused by changes in the concen-trations of such substances. NMs can be sampled from the extracellular brain fluid (EBF) which allows us to investi-gate their dynamic reflecting changes in neuronal activity. The EBF forms a complex, dynamic environment embed-ding all neural elements and serves as medium for the cell-to-cell communication and metabolite transport. Many of these NMs also exist in the blood system, but their concentrations are commonly different from those in the brain because of the differential permeability of the blood brain barrier (BBB) and of differences in absorption mechanisms, synthesis, and metabolism. Simultaneous and quantitative monitoring of these NMs from the brain and the blood system will therefore allow us to assess their relation between the brain and the blood system.
In the present study, we focused on a selection of NMs functionally and metabolically related and developed a direct and sensitive analytical method to monitor acetyl-choline, lactate, pyruvate, glutamine, and glutamate in parallel from the brain and the blood. All these five substances are derivates from glucose and the citrate cycles [4, 5]. Additionally, acetylcholine is able to modulate glutamatergic release and can interact with the brain energy metabolism [6–8]. To do so, we used microdialysis to collect samples from EBF and blood of anesthetized non-human-primates in parallel. This will allow us to investigate changes in their relation caused by functional and metabolic challenges or by pathologies in the future. However, their chemical and physical properties are different which makes it difficult to separate and detect these NMs together. To the best of our knowledge, there is currently no report describing the simultaneous determination of all five aforementioned substances by a single analysis. Indeed, so far, most analytical methods developed were only focusing on the determination of one or two of such targeted substances. For example, electrochemical detection (ECD) is commonly used to monitor these compounds [9–11], but an additional enzyme reactor is needed to generate electrochemically detectable hydrogen peroxide for acetyl-choline detection [12], so it is difficult to monitor all these substances in a single analytical run using ECD as detector. Compared to the classical ECD, mass spectrometry (MS) is able to detect diverse NMs with high sensitivity and selectivity. Recent analytical advances have been made by using MS detection coupled with ion-pair reversed-phase liquid chromatography (RPLC) or ion exchange chroma-tography (IEC) as separation tools. For instance, acetylcho-line has been analyzed by strong cation exchange (SCX)-MS [13] or ion-pair RPLC-MS [14, 15]. Pyruvate was analyzed by weak anion exchange (WAX)-MS [16], while
lactate and pyruvate together were detected by RPLC-ESI/ MS (electro spray ionization, ESI), but a time-consuming derivatization process with 3-nitrophenyl-hydrazine was needed [17]. Glutamine and glutamate were determined by ion-pair RPLC-MS using an ion-pairing regent which might cause ESI suppression [18].
In contrast to ion-pair RPLC or IEC-based analytical approaches, hydrophilic interaction liquid chromatography (HILIC)–MS is an alternative technique that allows separating and determining multiple polar analytes irre-spective of being a base or an organic acid [19, 20]. It already has proved its merits in determining peptides, proteins and small polar molecular compounds in complex matrices [21–24]. Recent reports demonstrated that HILIC-MS is well suited to determine polar neurotransmitters in EBF offering high sensitivity combined with time-saving procedures for sample preparation [23,25].
In this study, we report the successful combination of capillary HILIC-ESI/MS with dual microdialysis sampling for simultaneous measurement of five NMs together in brain and blood dialysates of non-human primates. First, our approach allows us to compare the relation of these NMs to each other under different physiological and pathological states of the brain. Second, the simultaneous sampling from the brain and the blood can be used to extrapolate from blood measurements to brain concentra-tions of these NMs. Relation changes of these NMs detectable in the blood can serve as easy accessible biomarkers reflecting physiological or pathological states of the brain [26].
Experimental
Chemicals
HPLC-MS grade acetonitrile, formic acid, and ammonium formate were purchased from Sigma-Aldrich (Munich, Germany). [3-13C] lactate (as aqueous solution, 20% w/ w in H2O) (
13
C-lactate), glutamine-L-2, 3, 3, 4, 4-d5
(glutamine-d5), and glutamic acid-L-2, 3, 3, 4, 4-d5
(glutamate-d5) were purchased from Cambridge Isotope
Laboratories (Andover, USA). Acetylcholine-N,N,N-tri-methyl-d9 chloride (acetylcholine-d9) was bought from
Medical Isotopes, Inc (Pelham, USA). Acetylcholine chloride, sodium lactate (lactate), sodium pyruvate, gluta-mine, glutamate, [1-13C] sodium pyruvate (13C-pyruvate), and the chemicals for preparing frits were all obtained from Sigma-Aldrich. Pure water was produced by a TKA superpure water system (Niederelbert, Germany). Artificial cerebral spinal fluid (a-CSF) for standard solutions con-sisted of 148 mM NaCl, 3.00 mM KCl, 0.80 mM MgCl2,
Fabrication of capillary columns
The preparation of capillary columns was adopted and modified from Zhang et al. [23]. To prevent the packing material from spilling out of the column a frit was formed at one end by in situ free radical polymerization modified from Viklund et al. [27]. Compared to the frit formed by sintered reaction, our frit can easily withstand long exposure to high pressure (>3,000 psi) and minimize extra-column band broadening. After the reaction, un-reacted material and other soluble compounds were removed from the pores by washing with ethanol followed by purging with helium for 15 min. The column was packed with acetone slurry (1.5 mL) containing 50 mg of 5 μm polyhydroxyethyl aspartamide particles (PolyLC, USA) with the help of a helium pressure cell with a stirring bar to maintain particle suspension running under a pressure of 100 bars for 30 min. The packed column was cut to 15 cm for use.
Preparation of calibration standards and internal standards
To increase the reproducibility of the quantitative analysis of acetylcholine, lactate, pyruvate, glutamine, and gluta-mate, acetylcholine-d9, 1 3C-lactate, 1 3C-pyruvate,
glutamine-d5, and glutamate-d5 were used as their
respec-tive internal standards (IS). Stock solutions of the analytes were prepared in 30% acetonitrile containing 0.1% formic acid and stored at 5 °C. To characterize the analytical performance of capillary HILIC-MS methods for the quantitative measurement of the analytes, the stock solution was serially diluted using a solution containing a-CSF/ solution A (90% acetonitrile, 0.1% formic acid; 1:4, v/v). The calibration solutions of acetylcholine ranged from 0.5– 250 nM and consisted of three levels (low, medium, and high) of quality control (QC) samples with 2.5, 25, and 125 nM. For lactate and pyruvate, the calibration solutions ranged from 10–5,000 μM, and QC samples were 50, 500, and 2500 μM. For glutamine, the calibration solutions ranged from 0.5–250 μM, and QC samples were 2.5, 25, and 125μM. For glutamate the calibration solutions ranged from 0.25–125 μM, and QC samples were 1.25, 12.5, and 62.5 μM. Two IS stock solutions were prepared in water containing 0.1% formic acid: one (IS1) is used for the
calibration curve preparation and the blood microdialysate samples analysis, which contains 500 nM acetylcholine-d9,
10 mM 13C-lactate, 10 mM 13C-pyruvate, 500 μM glutamine-d5, and 250 μM glutamate-d5; the other one
(IS2) is used for the monkey brain microdialysate samples
analysis containing 300 nM acetylcholine-d9, 6 mM 13
C-lactate, 6 mM 13C-pyruvate, 300 μM glutamine-d5, and
150 μM glutamate-d5. These internal standards were
diluted ten times (IS1) and six times (IS2) on the day of
the assay using a-CSF/solution A (90% acetonitrile, 0.1% formic acid; 1:4, v/v). The calibration curve was con-structed based on the response ratio of the peak area (Panalyte/PIS) versus the nominal standard concentrations
by a least-squares regression using a weighting factor of 1/ concentration2.
Microdialysis sampling
Two male rhesus monkeys (Macaca mulatta) were used with an age of 5 years weighing between 6 and 7 kg. The experimental procedures were approved by the local authorities (in German: “Regierungspraesidium Tuebin-gen”) and were in agreement with guidelines of the European Community (EUVD 86/609/EEC) for the care and use of laboratory animals. During the experiment, the monkeys were anesthetized with full monitoring of all vital parameters. Before the experiment, the monkeys were sedated with ketamine (15 mg/kg). Anesthesia was induced with fentanyl (31 μg/kg), thiopental (5 mg/kg), and succinyl chloride (3 mg/kg). Afterwards, the monkeys were intubated and ventilated with a Servo Ventilator 900 C (Siemens, Germany). The maintenance of anesthesia was attained with remifentanyl (0.2–1 μg/kg/min) and mivacu-rium chloride (4–7 mg/kg/h). A crystalloid solution (Ionosteril, Fresenius Kabi, Germany) with 2.5% glucose was infused at a rate of 10 ml/kg/h. During the experiment, body temperature was kept between 38.5 and 39.5 °C, SpO2above 95% and end tidal CO2at 35 mmHg.
The monkeys had a miniaturized PEEK chamber over the primary visual cortex that gave access to the brain. The probe was inserted through a small incision in the dura. The probe for blood sampling was placed into a superficial leg vein using an intravenous catheter.
For brain sampling, microdialysis probes CMA 12 with 2 mm PAES membrane of 0.5 mm outer diameter (o.d.) and a 20 kDa cut-off (CMA Microdialysis AB, Sweden) were used. The probe was flushed with a-CSF solution at a flow rate of 2μL/min for 15 min, and then conditioned at a flow rate of 600 nL/min for 2 h before insertion into the cortex of the monkey. For the blood sampling, a microdialysis catheter CMA 64, 20 mm PAES membrane, 0.6 mm o.d., 20 kDa cut-off (CMA Microdialysis AB, Sweden) was flushed with saline containing fragmin 25 IU/mL (Pfizer Pharma GmbH, Germany) at a flow rate of 2 μL/min for 2 h before insertion. The collections of microdialysis samples were started 2 h after the insertion of the probes for blood sampling as well as for brain sampling.
The dialysates were collected in parallel by two refrigerated fraction collectors CMA 740 (CMA Micro-dialysis AB, Sweden) at 6 °C for 1 h. The samples were collected at an interval of 3 min for both brain and blood sampling. We collected simultaneously five brain and five
blood samples each time. The sampling experiments were repeated two times from each animal. Before sampling, the IS solution was added to the glass inserts used for sample collection and then put into the refrigerated fraction collectors. After the experiment, the brain microdialysate samples were concentrated by a vacuum concentrator (Eppendorf, Germany) under room temperature for 5 min and reconstituted by solution B (60% acetonitrile, 0.1% formic acid) for further analysis. The blood microdialysate samples were directly diluted by solution C (80% acetoni-trile, 0.1% formic acid) and then analyzed.
In vitro recovery of CMA 12 probes has been tested in our lab, and it was 50.2–66.8% for all analytes with a reliable stability not exceeding 3.6% standard errors. The measured in vitro recovery of CMA 64 probes for all analytes was 42.5–49.3% with good reliable stability not exceeding 4.3% standard errors.
Capillary liquid chromatography and mass spectrometry
An Agilent capillary HPLC 1100 system coupled to a XCT plus ion-trap mass spectrometer (Agilent, Waldbronn, Germany) was used for analysis. Mobile phase A was an aqueous solution containing 50 mM ammonium formate and 1.0% formic acid (pH 2.87), and mobile phase B was acetonitrile. The analysis was performed using a gradient profile: 0.0–10.0 min, 85% B to 45% B, then 45% B was kept for 5 min. The column was reconditioned using an 85% solution of B for 10 min before further injection. The flow rate was 3.5 μL/min, and a sample of 0.3 μL was injected in the column each time.
MS analysis was performed by switching between positive and negative ion mode. Ion-trap tandem mass spectrometry (MS/MS) experiments were applied to isolate and fragment the precursor ions. The mass spectrometer was operated in MRM mode (multiple-reaction-monitoring) for the quantitative analysis. Five scans were averaged for each spectrum with the scan range of m/z 50–2,000. MS scans were split into three segments considering the different MS behaviors of five compounds. In the first segment (0.0–3.5 min) acetylcholine and acetylcholine-d9
were monitored under a positive mode with the capillary voltage of 3,500 V, while lactate,13C-lactate, pyruvate and
13
C-pyruvate were monitored under a negative mode in the second segment (3.5–8.6 min) with the capillary voltage of 2,541 V, and glutamine, glutamine-d5, glutamate, and
glutamate-d5were monitored under a positive mode in the
third segment (8.6–15.0 min) with capillary voltage of 3200 V. The MS parameters of five analytes and their corresponding internal standards are listed in Table 1. Lactate and pyruvate did not generate significant and stable product ions, so we could not use the product ions for lactate and pyruvate in MRM conditions. We used ion
fragmentation amplitude of 0.5 V and ion fragmentation cut-off of 58 which reduced the background noise keeping the lactate and pyruvate unaffected. This procedure could compensate for the lack of specificity which is achieved by monitoring the transfer from the precursor ion to the product ion. The MS settings such as capillary exit, skimmer and lens voltages were optimized and tuned by the data acquisition software during infusion of a standard solution for each compound.
Results and discussion
HILIC-MS analytical method development
Highest intensities for all the analytes were achieved when both the positive and the negative ionization mode of the mass spectrometer were used in the ESI experiments. Previous studies showed that chemicals can have different ESI/MS responses because of their different physical and chemical properties [28]. In our case, lactate and pyruvate, which are organic acids, had much higher intensities in negative ionization mode than in positive ionization mode. The other analytes, acetylcholine, glutamine and glutamate generated responses with high intensity only in positive ionization mode. For our experiments, we thus used positive ionization mode for detecting acetylcholine, gluta-mine, and glutamate, while negative ionization mode for lactate and pyruvate. In the analytical experiments, we selected HILIC as the method to separate the five polar analytes. Our initial tests showed that HILIC was able to separate them simultaneously (data not shown). The elution order was acetylcholine, lactate, pyruvate, glutamine, and glutamate. Because both positive and negative ionization mode were used for ESI/MS detection, the efficient separation of lactate and pyruvate from the other analytes has to be achieved to ensure that each analyte reliably matches the time window of the appointed ionization mode. To achieve optimal separation and intensity of the five analytes on the HILIC-MS, we examined the influence of pH value, water content and buffer concentration of the mobile phase on the retention behavior and MS signal of each analyte. Figure1a shows that the pH value had clearly stronger effects on lactate and glutamate compared to the other three analytes when we varied the pH of mobile phase A from 2.7–4.2 by adjusting formic acid proportions from 0.05–1.50%. In particular, the elution order of lactate and pyruvate reversed when pH value ranged from 3.9–2.7. This may be because lactate is ionized at higher pH values compared to its pKa of 3.85. Figure 1d indicates that the
MS intensity of the five analytes was also affected by the pH value. Their intensities were on average higher at lower pH value; 1.0% formic acid (pH 2.9) was finally used for
the following optimization warranting efficient separation combined with high intensity.
The water content had strong influence on the chro-matographic behaviors and MS signal intensities of all five analytes. When the water content was decreased to 30% or lower, lactate and pyruvate could be very well separated from their neighboring peaks of acetylcholine and gluta-mine in the chromatogram (Fig. 1b). Figure 1e illustrates that the reduced water content (from 60–30%) could enhance the MS intensity, which is the benefit of the
increased electrospray ionization efficiency in a high organic phase. On the other hand, a MS signal decline was observed when the water content ranged from 30% to 20%. This might result from the low solubility of the polar compounds in the high organic phase mobile.
During the method development, we found that the salt content in the buffer solution had a great impact on the peak shapes and MS signal of the analytes (Fig. 1f), but less effect on retention time (Fig. 1c). Sharp peak shapes and high reproducible retention times were obtained for all
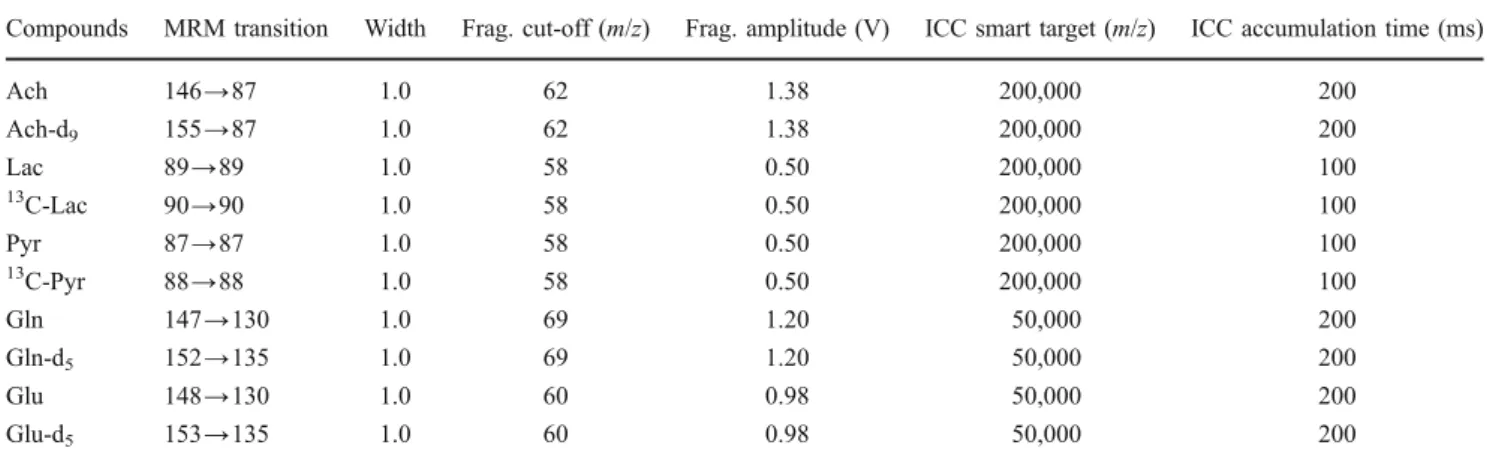
Table 1 MS parameters for five analytes and their internal standards
Compounds MRM transition Width Frag. cut-off (m/z) Frag. amplitude (V) ICC smart target (m/z) ICC accumulation time (ms)
Ach 146→87 1.0 62 1.38 200,000 200 Ach-d9 155→87 1.0 62 1.38 200,000 200 Lac 89→89 1.0 58 0.50 200,000 100 13 C-Lac 90→90 1.0 58 0.50 200,000 100 Pyr 87→87 1.0 58 0.50 200,000 100 13 C-Pyr 88→88 1.0 58 0.50 200,000 100 Gln 147→130 1.0 69 1.20 50,000 200 Gln-d5 152→135 1.0 69 1.20 50,000 200 Glu 148→130 1.0 60 0.98 50,000 200 Glu-d5 153→135 1.0 60 0.98 50,000 200
Fig. 1 Influences of mobile phase on retention behavior and MS signal of the five analytes. a Effects of pH value on the retention time. b Effects of water content on the retention time. The aqueous phase containing 50 mM ammonium formate and 1.0% formic acid. c Effects of buffer concentration on the retention time. Mobile phase A containing 1.0% formic acid. d Effects of pH value on MS signal. e
Effects of water content on MS signal. f Effects of buffer concentration on MS signal. An isocratic elution of mobile phase A: mobile phase B (15:75, v/v) was used to test the influence of pH value and buffer concentration. *Acetylcholine (Ach), Lactate (Lac), Pyruvate (Pyr), Glutamine (Gln), Glutamate (Glu)
analytes when the ammonium formate concentration was increased from 10–50 mM. Therefore, a higher concentra-tion of buffer soluconcentra-tion was used for the eluconcentra-tion, although ion suppression could be observed at this level.
Taken together, the aqueous phase consisted of a buffer solution containing 50 mM ammonium formate and 1.0%
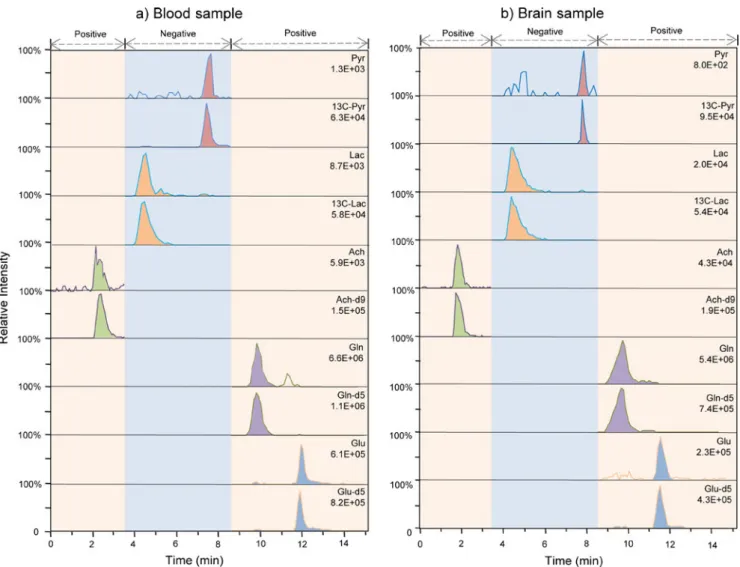
formic acid using a gradient profile that started at 85% acetonitrile for separation of the targeted analytes. This optimized separation method ensured that each analyte was matching the appointed time window of the chosen ionization mode without any interferences. The typical HILIC-ESI/MS chromatograms containing the five NMs
Fig. 2 Representative HILIC-ESI/MS chromatograms of five NMs under the optimized conditions a blood sample b brain sample. Both positive and negative ion mode was adopted for the detection of five analytes during each run
Table 2 Validation results of the HILIC-ESI/MS method for the analysis of the five neurochemical analytes
Precisiona
Compounds LOD LOQ Linear range r2 Accuracy (%) Intra-day Inter-day
RSD%, n=5 RSD%, n=3 ACh 150 pM 450 pM 0.5–250 nM 0.9989 82.6–109.0 11.6 12.8 Lac 3μM 10μM 10–5000 μM 0.9990 86.0–106.8 9.6 15.2 Pyr 2μM 6μM 10–5000 μM 0.9989 85.6–117.4 10.5 14.3 Gln 5 nM 15 nM 0.5–250 μM 0.9990 81.5–117.8 10.3 13.3 Glu 50 nM 150 nM 0.25–125 μM 0.9988 86.0–106.9 14.6 15.0 a
(acetylcholine, lactate, pyruvate, glutamine, and glutamate) are shown in Fig.2.
Analytical performance of the capillary HILIC-ESI/MS method
The capillary HILIC-ESI/MS method was validated for the quantitative measurements of acetylcholine, lactate, pyru-vate, glutamine, and glutamate concentrations from in vivo dialysates. We characterized a series of parameters like the limits of detection (LODs), limits of quantification (LOQs), linearity, selectivity, accuracy, precision and stability by analyzing different levels of standard mixtures of the target NMs while using optimized MRM transitions and positive/ negative ionization modes. The validated results of the analytical performance are listed in Table2. The LODs of lactate and pyruvate in negative mode were 3 and 2 μM, respectively, whereas the LODs of acetylcholine, gluta-mine, and glutamate in positive mode were 150 pM, 5 nM, and 50 nM, respectively. Although the LODs of lactate and pyruvate were much higher than those of the other three analytes (acetylcholine, glutamine, and glutamate) we still can measure them, because their basal concentrations in the brain as well in the blood are much higher than the other three. The matched MS/MS pattern between the endoge-nous NMs and their standards allowed confirming the high selectivity of the HILIC-MS method. Additionally, the retention time of the endogenous NMs always matched well with those of internal standards under different gradient elution conditions, which also proved the high selectivity of the method. The accuracy, precision and stability have been tested by replicate analysis (five determinations per concentration) of three different levels of QCs (see the section “Preparation of calibration standards and internal
standards”). It is shown in Table 2 that the results of the
accuracy, intra- and inter-day precisions were all in good agreement with the requirements of biological analysis [29,
30]. The stability test results indicated that the stock solution was stable for 1 month at−20 °C with the RSD< 12.5%, and the QCs were stable for about 2 weeks in the autosampler at 4 °C with the RSD<15.1%. Additionally, the freeze (−20 °C) and thaw stability has also been tested for these analytes. After two freeze-thaw cycles, the QCs were analyzed on the third cycle, and the results showed a good stability with the RSD<13.1%.
In addition, we adopted the post-extraction spike method proposed by Matuszewski et al. [31] to evaluate the matrix effect of the acquired in vivo samples in our study. To reliably determine the endogenous concentration of the five analytes we analyzed them according our developed method and then checked the same brain and blood samples by spiking with appropriate standard solutions. The spiked concentration of acetylcholine, lactate, pyruvate, glutamine, and glutamate was 8 nM, 150 μM, 10 μM, 40 μM, and 1 μM respectively for the brain samples, while 20 nM, 400 μM, 60 μM, 300 μM, and 30 μM for the blood samples. The total concentrations of the five analytes in the spiked samples and the endogenous concentrations in the non-spiked samples were then determined and used to calculate the recovery of each analyte. We used the following formula for calculating the recovery: (measured value−endogenous val-ue)/added value×100. The obtained recoveries for the five analytes fell in the range of 93–112%.
Concentrations of acetylcholine, lactate, pyruvate, glutamine, and glutamate in the brain and blood microdialysates
We applied capillary HILIC-ESI/MS method together with simultaneous blood and brain microdialysis sampling to measure the concentrations of five NMs from two
anesthe-Table 3 Concentrations of acetylcholine, lactate, pyruvate, glutamine, and glutamate in the dialysates of brain and blood
Compounds Ach (nM) Lac (μM) Pyr (μM) Gln (μM) Glu (μM)
Brain 4.0±1.4 220.4±90.9 21.3±8.3 50.4±21.9 1.1±0.2
Blood 10.3±4.4 511.3±78.7 91.5±37.6 176.4±45.3 26.7±5.3
Anesthetized monkeys, resting status. Values are given as mean±standard error of the mean (S.E.M.); n=4.
Fig. 3 Comparison of lactate/pyruvate (Lac/Pyr) and glutamine/ glutamate (Gln/Glu) in primary visual cortex and the blood system of rhesus monkey. Ratios of Lac/Pyr and Gln/Glu in monkey primary visual cortex were significantly higher than the blood system (p<0.05)
tized male rhesus monkeys. The microdialysis probe in the brain was placed into the primary visual cortex (V1). The concentrations of acetylcholine, lactate, pyruvate, gluta-mine, and glutamate in dialysates from primary visual cortex and blood are shown in Table 3. The values we monitored were in good agreement with the Human Metabolome Database Version 2.5 (www.hmdb.ca), and the values reported in the literature [18,23,32–39]. Comparison of lactate/pyruvate and glutamine/glutamate ratios in the brain and the blood
To further understand the distribution differences of NMs across the BBB, respectively, between the brain and the blood, we examined and compared the lactate/pyruvate and glutamine/glutamate ratios between the brain and blood dialysates. The results showed that the concentration ratio of lactate/pyruvate and glutamine/glutamate was signifi-cantly different between the brain and the blood. The values of lactate/pyruvate and glutamine/glutamate were calculated and are shown in Fig.3. The mean lactate/pyruvate ratio in the brain was 14.5, but only reached 9.0 in the blood system. The mean ratio of glutamine/glutamate in the brain was 53.4, significantly higher than the blood value of 7.9. One-way ANOVA analysis confirmed the statistical signif-icance of these findings (p<0.05).
The lactate/pyruvate ratio in the human brain is currently considered a specific, sensitive marker that could potential-ly indicate whether glucose and oxygen supppotential-ly meet the energy requirements of the brain tissue [40]. Such marker, that hint upon the adequacy of energy and metabolite supply are of great importance for the detection of onset of neurodegenerative diseases [41]. In the human brain, a lactate/pyruvate ratio above 40 indicates an“energy crisis” [42]. Additionally it was shown that lactate can increase the cerebral blood flow which correlates with an increase of the lactate/pyruvate ratio in the plasma [36]. A decreased interstitial glutamine/glutamate ratio has been observed in acute and chronic brain damage such as traumatic brain injury [43], hypoxia [44], and epilepsy [45]. Although such findings are still preliminary for diagnosis, we consider the simultaneous monitoring of blood and brain concentrations of important NMs a necessary step in this direction to get a clear understanding of their chemical relation across the BBB. On the basis of this data, extrapolations from the blood concentrations to brain concentrations of pathologi-cally relevant NMs might be envisioned.
Conclusion
We developed a capillary HILIC-ESI/MS method for the simultaneous determination of multiple chemicals including
acetylcholine, lactate, pyruvate, glutamine and glutamate from the brain (EBF) and blood system of anesthetized non-human primates. To achieve highest intensity of these NMs, positive and negative ionization modes were used for MS detection. The optimized chromatographic separation allowed us to switch between the two detection modes and to simultaneously measure these NMs in a single run. A simple and fast sample treatment was carried out after collection by microdialysis without any additional sample purification or derivatization. We have successfully dem-onstrated that our method can reliably quantify these NMs in dialysates collected from the blood and the primary visual cortex of non-human primates. Additionally we found that the concentration ratio of lactate/pyruvate and glutamine/glutamate was significantly different between the brain and the blood, reflecting the active transports and different metabolic processes between the blood and the nervous system respectively across the BBB. Quantified coupling parameters between the blood and the nervous system of NMs are of outmost importance due to their possible use in the diagnosis of pathological processes in the brain. To further investigate the correlation of these NMs between the brain and the blood systems, we will use the developed analytical method to test the dynamic change of these NMs across the BBB by pharmacologically simulating dysfunctional states of the brain.
Acknowledgments This work was supported by the Max Planck Society and BMBF Grant, Nr. 01EV0701. We thank Nadine Serr and Ulrike Passlack-Memaj for assistance in chemical preparations. We thank Mark Augath for assistance with the monkey anesthesia.
References
1. Calabresi P, Centonze D, Gubellini P, Marfia GA, Pisani A, Sancesario G, Bernardi G (2000) Synaptic transmission in the striatum: from plasticity to neurodegeneration. Prog Neurobiol 61:231–265 2. D’Aniello A, Lee JM, Petrucelli L, Di Fiore MM (1998) Regional
decreases of free D-aspartate levels in Alzheimer’s disease. Neurosci Lett 250:131–134
3. Carlsson M, Carlsson A (1990) Interactions between glutamater-gic and monoaminerglutamater-gic systems within the basal ganglia— implications for schizophrenia and Parkinson’s disease. Trends Neurosci 13:272–276
4. Gibson GE, Peterson C, Sansone J (1981) Neurotransmitter and carbohydrate metabolism during aging and mild hypoxia. Neuro-biol Aging 2:165–172
5. Hertz L, Peng L, Dienel GA (2006) Energy metabolism in astrocytes: high rate of oxidative metabolism and spatiotemporal dependence on glycolysis/glycogenolysis. J Cereb Blood Flow Metab 27:219–249
6. Briand LA, Gritton H, Howe WM, Young DA, Sarter M (2007) Modulators in concert for cognition: modulator interactions in the prefrontal cortex. Prog Neurobiol 83:69–91
7. Andersson K, Arner P (1995) Cholinoceptor-mediated effects on glycerol output from human adipose tissue using in situ micro-dialysis. Br J Pharmacol 115:1155–1162
8. Yang TT, Chang CK, Tsao CW, Hsu YM, Hsu CT, Cheng JT (2009) Activation of muscarinic M-3 receptor may decrease glucose uptake and lipolysis in adipose tissue of rats. Neurosci Lett 451:57–59
9. Tsai TR, Cham TM, Chen KC, Chen CF, Tsai TH (1996) Determination of acetylcholine by on-line microdialysis coupled with pre-and post-microbore column enzyme reactors with electrochemical detection. J Chromatogr B Biomed Sci Appl 678:151–155
10. Yao T, Yano T, Nanjyo Y, Nishino H (2003) Simultaneous determination of glucose and L-lactate in rat brain by an electrochemical in vivo flow-injection system with an on-line microdialysis sampling. Anal Sci 19:61–65
11. Monge-Acuña AA, Fornaguera-Trias J (2009) A high perfor-mance liquid chromatography method with electrochemical detection of gamma-aminobutyric acid, glutamate and glutamine in rat brain homogenates. J Neurosci Methods 183:176–181 12. Huang T, Yang L, Gitzen J, Kissinger PT, Vreeke M, Heller A
(1995) Detection of basal acetylcholine in rat brain micro-dialysate. J Chromatogr B Biomed Appl 670:323–327
13. Shackman HM, Shou M, Cellar NA, Watson CJ, Kennedy RT (2007) Microdialysis coupled on-line to capillary liquid chroma-tography with tandem mass spectrometry for monitoring acetyl-choline in vivo. J Neurosci Methods 159:86–92
14. Prokai L, Fry ák P, Stevens SM, Nguyen V (2008) Measurement of acetylcholine in rat brain microdialysates by LC–isotope dilution tandem MS. Chromatographia 68:101–105
15. Zhu Y, Wong PSH, Cregor M, Gitzen JF, Coury LA, Kissinger PT (2000) In vivo microdialysis and reverse phase ion pair liquid chromatography/tandem mass spectrometry for the determination and identification of acetylcholine and related compounds in rat brain. Rapid Commun Mass Spectrom 14:1695–1700
16. van Dam J, Eman M, Frank J, Lange H, van Dedem G, Heijnen S (2002) Analysis of glycolytic intermediates in Saccharomyces cerevisiae using anion exchange chromatography and electrospray ionization with tandem mass spectrometric detection. Anal Chim Acta 460:209–218
17. Uran S, Landmark KE, Hjellum G, Skotland T (2007) Quantifi-cation of13C pyruvate and13C lactate in dog blood by reversed-phase liquid chromatography-electrospray ionization mass spec-trometry after derivatization with 3-nitrophenylhydrazine. J Pharm Biomed Anal 44:947–954
18. Eckstein JA, Ammerman GM, Reveles JM, Ackermann BL (2008) Analysis of glutamine, glutamate, pyroglutamate, and GABA in cerebrospinal fluid using ion pairing HPLC with positive electrospray LC/MS/MS. J Neurosci Methods 171:190– 196
19. Alpert AJ (1990) Hydrophilic-interaction chromatography for the separation of peptides, nucleic acids and other polar compounds. J Chromatogr 499:177–196
20. Zhang X, Rauch A, Xiao H, Rainer G, Logothetis NK (2008) Mass spectrometry-based neurochemical analysis: perspectives for primate research. Expert Rev Proteomics 5:641–652
21. Schlichtherle-Cerny H, Affolter M, Cerny C (2003) Hydrophilic interaction liquid chromatography coupled to electrospray mass spectrometry of small polar compounds in food analysis. Anal Chem 75:2349–2354
22. Fu B, Gao X, Zhang SP, Cai Z, Shen J (2008) Quantification of acetylcholine in microdialysate of subcutaneous tissue by hydro-philic interaction chromatography/tandem mass spectrometry. Rapid Commun Mass Spectrom 22:1497–1502
23. Zhang X, Rauch A, Lee H, Xiao H, Rainer G, Logothetis NK (2007) Capillary hydrophilic interaction chromatography/mass spectrometry for simultaneous determination of multiple neuro-transmitters in primate cerebral cortex. Rapid Commun Mass Spectrom 21:3621–3628
24. Preinerstorfer B, Schiesel S, Lämmerhofer M, Lindner W (2009) Metabolic profiling of intracellular metabolites in fermentation broths from [beta]-lactam antibiotics production by liquid chromatography-tandem mass spectrometry methods. J Chroma-togr A 1217:312–328
25. Uutela P, Reinila R, Piepponen P, Ketola RA, Kostiainen R (2005) Analysis of acetylcholine and choline in microdialysis samples by liquid chromatography/tandem mass spectrometry. Rapid Com-mun Mass Spectrom 19:2950–2956
26. Kaddurah-Daouk R, Krishnan KR (2009) Metabolomics: a global biochemical approach to the study of central nervous system diseases. Neuropsychopharmacology 34:173–186
27. Viklund C, Ponten E, Glad B, Irgum K, Horstedt P, Svec F (1997) “Molded” Macroporous Poly(glycidyl methacrylate-co-trimethylolpropane trimethacrylate) Materials with Fine Con-trolled Porous Properties: Preparation of Monoliths Using Photo-initiated Polymerization. Chem Mater 463–471
28. Cech NB, Enke CG (2001) Practical implications of some recent studies in electrospray ionization fundamentals. Mass Spectrom Rev 20:362–387
29. Shah VP, Midha KK, Dighe S, McGilveray IJ, Skelly JP, Yacobi A, Layloff T, Viswanathan CT, Cook CE, McDowall RD et al (1991) Analytical methods validation: bioavailability, bioequiva-lence and pharmacokinetic studies Conference report. Eur J Drug Metab Pharmacokinet 16:249–255
30. Food and Drug Administration (2001) Guidance for industry: bioanalytical method validation. US Department of Health and Human Services, FDA, Center for Drug Evaluation and Research. http://www.fda.gov/cder/guidance/index.htm.
31. Matuszewski BK, Constanzer ML, Chavez-Eng CM (2003) Strategies for the assessment of matrix effect in quantitative bioanalytical methods based on HPLC-MS/MS. Anal Chem 75:3019–3030
32. Molina JA, Gomez P, Vargas C, Ortiz S, Perez-Rial S, Uriguen L, Oliva JM, Villanueva C, Manzanares J (2005) Neurotransmitter amino acid in cerebrospinal fluid of patients with dementia with Lewy bodies. J Neural Transm 112:557–563
33. Hawkins RA (2009) The blood–brain barrier and glutamate. Am J Clin Nutr 90:867S–874S
34. Boutelle MG, Fellows LK, Cook C (1992) Enzyme packed bed system for the on-line measurement of glucose, glutamate, and lactate in brain microdialysate. Anal Chem 64:1790–1794 35. Bjerring PN, Hauerberg J, Frederiksen HJ, Jorgensen L, Hansen
BA, Tofteng F, Larsen FS (2008) Cerebral glutamine concentra-tion and lactate-pyruvate ratio in patients with acute liver failure. Neurocrit Care 9:3–7
36. Mintun MA, Vlassenko AG, Rundle MM, Raichle ME (2004) Increased lactate/pyruvate ratio augments blood flow in physio-logically activated human brain. Proc Natl Acad Sci USA 101:659–664
37. Kawashima K, Oohata H, Fujimoto K, Suzuki T (1987) Plasma concentration of acetylcholine in young women. Neurosci Lett 80:339–342
38. Fujii T, Yamada S, Yamaguchi N, Fujimoto K, Suzuki T, Kawashima K (1995) Species differences in the concentration of acetylcholine, a neurotransmitter, in whole blood and plasma. Neurosci Lett 201:207–210
39. Cynober LA (2002) Plasma amino acid levels with a note on membrane transport: characteristics, regulation, and metabolic significance. Nutrition 18:761–766
40. Bellander BM, Cantais E, Enblad P, Hutchinson P, Nordström CH, Robertson C, Sahuquillo J, Smith M, Stocchetti N, Ungerstedt U (2004) Consensus meeting on microdialysis in neurointensive care. Intensive Care Med 30:2166–2169
41. Iadecola C (2004) Neurovascular regulation in the normal brain and in Alzheimer’s disease. Nat Rev Neurosci 5:347–360
42. Samuelsson C, Hillered L, Zetterling M, Enblad P, Hesselager G, Ryttlefors M, Kumlien E, Lewen A, Marklund N, Nilsson P, Salci K, Ronne-Engstrom E (2007) Cerebral glutamine and glutamate levels in relation to compromised energy metabolism: a micro-dialysis study in subarachnoid hemorrhage patients. J Cereb Blood Flow Metab 27:1309–1317
43. Richards DA, Tolias CM, Sgouros S, Bowery NG (2003) Extracellular glutamine to glutamate ratio may predict outcome
in the injured brain: a clinical microdialysis study in children. Pharmacol Res 48:101–109
44. Raman L, Tkac I, Ennis K, Georgieff MK, Gruetter R, Rao R (2005) In vivo effect of chronic hypoxia on the neurochemical profile of the developing rat hippocampus. Brain Res Dev Brain Res 156:202–209 45. Petroff OA, Errante LD, Rothman DL, Kim JH, Spencer DD (2002) Glutamate-glutamine cycling in the epileptic human hippocampus. Epilepsia 43:703–710