Mapping changes of in vivo connectivity patterns in the human
mediodorsal thalamus: correlations with higher cognitive
and executive functions
András Jakab&Rémi Blanc&Ervin L. BerényiPublished online: 15 May 2012
# Springer Science+Business Media, LLC 2012
Abstract The mediodorsal thalamic nucleus is recognized as an association hub mediating interconnections with mainly the prefrontal cortex. Tracer studies in primates and in vivo diffusion tensor tractography findings in both humans and monkeys confirm its role in relaying networks that connect to the dorsolateral prefrontal, orbitofrontal, frontal medial and cingulate cortex. Our study was designed to use in vivo probabilistic tractography to describe the pathways emerging from or projecting to the mediodorsal nucleus; moreover, to use such information to automatically define subdivisions based on the divergence of remote structural connections. Diffusion tensor MR imaging data of 156 subjects were utilized to perform connectivity-based seg-mentation of the mediodorsal nucleus by employing a k-means clustering algorithm. Two domains were revealed (medial and lateral) that are separated from each other by a sagittally oriented plane. For each subject, general assess-ment of cognitive performance by means of the Wechsler Abbreviated Scale of Intelligence and measures of
Delis-Kaplan Executive Function System (D-KEFS) test was uti-lized. Inter-subject variability in terms of connectivity-based cluster sizes was discovered and the relative sizes of the lateral mediodorsal domain correlated with the individuals’ perfor-mance in the D-KEFS Sorting test (r00.232, p00.004). Our results show that the connectivity-based parcellation tech-nique applied to the mediodorsal thalamic nucleus delivers a single subject level descriptor of connectional topography; furthermore, we revealed a possible weak interaction between executive performance and the size of the thalamic area from which pathways converge to the lateral prefrontal cortex.
Keywords Thalamus . Mediodorsal nucleus . Brain connectivity . Diffusion tensor magnetic resonance imaging . Executive performance
Introduction
Endeavors to study the role of the mediodorsal thalamic nucleus (MD) already postulated it as a possible association hub mediating affective and cognitive functions (Izquierdo and Murray2010). In non-human primates, evidence comes from a wide range of works describing the interconnections of the nucleus with several cortical areas, predominantly with the prefrontal cortex (Goldman-Rakic and Porrino
1985; Siwek and Pandya 1991; Negyessy and Goldman-Rakic2005). Changes of connectivity patterns were found to be coherent with the classical cytoarchitectural subdivi-sions of the MD, with the medial and orbital prefrontal regions projecting to the medial sector (magnocellular part) and fibers of the dorsolateral prefrontal cortex projecting to the lateral sector (parvocelluar part) (Ray and Price 1993; Öngür and Price 2000; Erickson and Lewis 2004). Many clinical studies support the active participation of the Electronic supplementary material The online version of this article
(doi:10.1007/s11682-012-9172-5) contains supplementary material, which is available to authorized users.
A. Jakab (*)
:
E. L. BerényiDepartment of Biomedical Laboratory and Imaging Science, Faculty of Medicine, University of Debrecen Medical and Health Science Center, 98. Nagyerdei krt., Debrecen 4032, Hungary e-mail: [email protected] A. Jakab e-mail: [email protected] A. Jakab
:
R. BlancComputer Vision Laboratory, Swiss Federal Institute of Technology, Zurich, Switzerland
mediodorsal nucleus in higher cognitive functioning, al-though these investigations mainly concentrated on linking the impairment of cognitive and executive performance to anatomical locations of intrathalamic lesions or to volume changes in epilepsy (Van der Werf et al.2000; Van der Werf et al.2003; Pulsipher et al.2009). The primary impetus for our study was that in vivo neuroimaging methods have successfully been applied to study the connectional anatomy of the mediodorsal nucleus, and compelling similarity to the primate thalamocortical networks was revealed (Klein et al.
2010).
Diffusion-weighted and diffusion tensor imaging (DTI) characterizes the statistical distribution of water molecules in biological tissues (Le Bihan et al. 1986; Basser and Pierpaoli 1996). During DTI experiments, multiple diffusion-encoding gradients are applied to the brain in various directions and the observed direction-dependent contrast allows to calculate a tensor for each image element. Given that in brain tissue the densely packed axons are the main sources of the diffusion anisotropy, such tensors readily describe the orientation of the dominant fiber population in each voxel. Major fiber bundles can be visualized by means of fiber tracking (Mori and van Zijl
2002). The initial enthusiasm about this tool as a modality for in vivo virtual dissections of white matter anatomy (Catani et al.2002) was later transformed to an effort aiming to validate these re-discovered neuronal pathways. This was mainly done by means of more conventional neuroanatomical approaches (Dauguet et al. 2007; Hansen et al. 2011). Additionally, it became clear that newer computational methods are required to describe the complex intra-voxel distribution of axonal populations, such as mapping the propagation of uncertainty of possible fiber trajectories (Behrens et al.2003).
It is possible to chart the connections of the human thalamus with a non-invasive, in vivo method: diffusion tensor imaging augmented with a probabilistic framework of fiber tractography allows to map thalamocortical connec-tions (Behrens et al.2003b). A novel way to picture struc-tural connections is to delineate and define regions in the brain based on its primary source of afferent or efferent connections (Johansen-Berg et al.2004; Klein et al.2007). This approach of connectivity-based segmentation has al-ready passed tests of reproducibility (Traynor et al. 2010; O’Muircheartaigh et al. 2011), applicability in functional neurosurgical planning (Pouratian et al.2011) and correla-tion to neurophysiological mapping (Elias et al.2011).
We aimed to perform connectivity-based parcellation to reveal subdivisions within the human mediodorsal thalamic nucleus by automatically delineating areas that show distinct remote connectivity profiles. Our study was designed to unveil the interhemispheric differences and intersubject vari-ability in the extent of such connectivity-based domains, for this purpose, we accessed the images of a large number of
healthy subjects. We assumed that the macroscopic anatomy of such subdivisions provide further information on the func-tional specialization of the MD nucleus. This idea stems from the fact that structural connectivity determines the territories from where information could reach an area while the efferent connections limit the regions which it can directly influence (Johansen-Berg and Rushworth2009). Therefore, keeping in mind its limited capabilities in depicting finely detailed anatomy, we can use tractography-based charting of gray matter to obtain information not only about local features, but also about more remote trajectories and large circuits passing through that region (Catani 2007).
The neuroanatomical model of segregated cortico-striato-thalamo-cortical networks (Alexander et al.1986) forms the basis for our hypothesis, in which circuitry the mediodorsal thalamic nucleus was found to play an intermediary role. Neuroimaging studies show that macroscopic anatomical features (e.g., total gray matter volume of frontal lobe) show correlation with the intellectual abilities of the individual (Luders et al. 2009; Jung and Haier 2007). By the same token, individual, imaging-based and connectionist defini-tion of anatomical features can be investigated as neuroan-atomical correlates of higher cognitive functions.
Materials and methods
Subjects
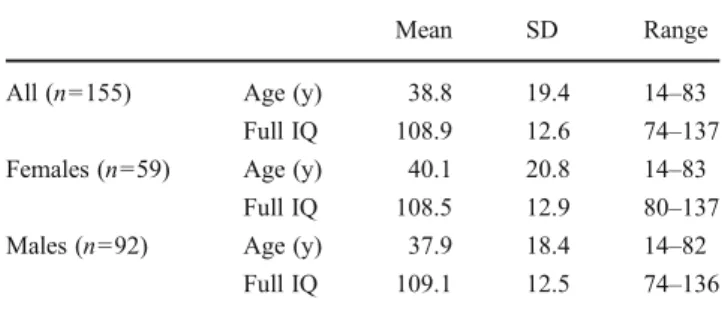
Imaging data and phenotypic information of 209 subjects were taken from the repository of the International Neuro-imaging Data-sharing Initiative (INDI), we used the most recent release of the Nathan Kline Institute’s Rockland Sample (Castellanos et al. 2011). It is a freely available, large-scale, extensively phenotyped dataset for the purpose of discovery science and contains healthy subjects from nearly all age groups. To provide a more homogeneous sample for studying normal anatomy, we applied the following exclusion criteria to define the final study population. We excluded subjects younger than 14 years (n021), left-handed or subjects with unknown or ambiguous handedness (n028), missing diffusion tensor imaging session (n02) or where no results of the Wechsler Abbreviated Scale of Intelligence were available (n02), eventually including 156 subjects. Demographic details of the subject population are summarized in Table1.
Image acquisition and processing
Diffusion tensor imaging (DTI) sessions were done using a 3.0T MRI system (Magnetom Trio Tim, Siemens, Erlangen, Germany). Diffusion-weighted data (DWI) were acquired using a spin echo EPI sequence (TR010000 ms, TE0
91 ms) with the GRAPPA parallel imaging technique applied (acceleration factor: 3). Diffusion-weighting gradients were applied in 64 different directions, b-value: 1000 s/mm2. Volumes consisted of 58 transverse slices, slice thickness: 2 mm, voxel size: 2 mm \ast 2 mm, field of view: 256 mm.
To study the properties of connectional anatomy in a large population, the following diffusion image processing steps were necessary: (1) fitting a symmetric tensor to the DWI data and using the tensor’s eigenvalues to calculate secondary, parametric maps, such as the fractional anisotropy image, (2) spatial standardization of DTI data to a standard neuroimaging template space, (3) estimation of intra-voxel distribution of multiple fiber populations and (4) performing probabilistic tracking of structural connections arising from the investi-gated region. DTI processing steps were carried out using the FMRIB Diffusion Toolbox in the FSL software package (Smith et al.2004). Fractional anisotropy images were calcu-lated using an established approach described elsewhere (Basser and Pierpaoli1996). We performed non-linear spatial standardization to enable inter-subject comparison of anato-my. For each subject, fractional anisotropy images were used to determine a deformation field which transforms it to a common reference space, the FMRIB58 fractional anisotropy template (MNI space), this was done by accessing the FNIRT algorithm in the FSL software package. The characterization of fiber distributions was carried out using a standard proce-dure (Behrens et al.2003a), the algorithm was set to search for two fiber populations in each image voxel in a way that the possible orientations of diffusion displacements best fit the observed DWI data.
The masks of the left and right mediodorsal thalamic nucleus were defined in the MNI152 space. To define these, we used results from a previous work where a mean repre-sentation of the human thalamus anatomy was provided by the histological workup of 7 thalami (Niemann et al.2000; Krauth et al. 2010), this work is the three-dimensional generalization of the Morel Atlas of the Human Thalamus and Basal Ganglia (Morel2007). These data allowed us to use a statistical shape model driven registration method (Rao et al.2008) to non-linearly match the outlines of the template’s visible thalamus and the corresponding structure
from the 3D mean thalamus atlas. For comparisons with classical, cytoarchitecture based depictions of the anatomy of the mediodorsal nucleus, the 3D outlines of the two subdivisions were accessed (MDmc - magnocellular part
and MDpc- parvocellular part) and transformed to the
stan-dard imaging space.
Connectivity-based parcellation of the mediodorsal nucleus
We used the MNI152-transformed mask of the mediodorsal nucleus to initiate probabilistic fibertracking. A detailed description of this tracking algorithm is provided by the FMRIB work-group (Behrens et al. 2003a). This step resulted in maps that quantify the probability that a particular brain voxel is connected to the entire initiating (i.e. seeding) area; this estimate of connection is inter-preted as the probability that virtual tracing particles reach their targets through trajectories defined by the local, intravoxel model of diffusion characteristics. While the seeding region was defined in the MNI152 space, the model of local diffusion characteristics was generated in the diffusion tensor imaging space, and therefore the deformation field of the registration step was used to project to and also, to map back intermediary results to the standard space. We aimed to perform connectivity-based segmentation, hence an alternative way to store diffusion tractography results was applied, similarly to a number of works in this field (Klein et al.2007; Tomassini et al. 2007; Jbabdi et al.2009; Menke et al. 2010; Jakab et al.2011). For each subject, a connectivity matrix (M \ast N) was stored where each row (M) represented the seed voxels while the columns corresponding to the brain vox-els (N), as stored in a low resolution, 4×4×4 mm space. This resampling step was necessary to reduce the compu-tational burden during the clustering but without signifi-cantly reducing the information of fiber trajectories. Elements of the matrix represented the probability of structural connections between corresponding seed and brain voxels. Next, a cross-correlation matrix was con-structed (M \ast M), for each seed voxel quantifying the similarities of their connectivity patterns. Seed voxels were partitioned into two groups with a k-means clustering algorithm maximizing the within-group similarity of con-nection patterns. During the k-means algorithm, random initialization of cluster centers was employed, with an iterative search for the second cluster center to be the furthest away from the first; this method provides feasible within-subject reproducibility without performing multiple clusterings, in contrast to other works (Nanetti et al.
2009). The assigned group memberships were eventually projected back to the thalamus, which allowed the direct observation of the newly defined parcellations of the mediodorsal nucleus.
Table 1 Demographic and IQ data for the subjects
Mean SD Range
All (n0155) Age (y) 38.8 19.4 14–83
Full IQ 108.9 12.6 74–137
Females (n059) Age (y) 40.1 20.8 14–83
Full IQ 108.5 12.9 80–137
Males (n092) Age (y) 37.9 18.4 14–82
Visualization and analysis of fiber tract anatomy
In order to study the spatial distribution of circuits and to localize distant regions connected to the connectivity-based mediodorsal thalamic clusters, a population based representa-tion of connecrepresenta-tional anatomy was required. Probabilistic trac-tograms for each subject were accessed, and the emerging tract distribution images from the newly defined subdivisions were separated. For each brain voxel, we have assigned a label based on its highest probability of connection to either clusters (separately for left and right hemispheric clusters). Then these labelmaps were correspondingly summed through the 156 subjects. This inherently resulted in brain maps that for each voxel depicts the number of subjects in which that area is connected to a particular thalamic cluster, similarly to the visualization method described in another study (Menke et al. 2010). The pattern of this averaged tract anatomy was compared to digital atlas-based gray matter and white matter regions (Harvard-Oxford Cortical Atlas and Juelich Atlas of Fiber Tract Anatomy).
Interhemispheric and inter-subject variability was esti-mated for the volumes of the connectivity-based subdivi-sions, and also, their spatial scatter from the group centroid (i.e. the average of coordinates) was determined in the MNI152 space. We have constructed three-dimensional meshes representing the 50th percentile volumes of connectivity-based domains through the examined popula-tion, such objects were visually compared to the atlas-based mediodorsal thalamic nuclei borders. We have calculated the overlap of the observed connectivity-based clusters and cytoarchitectural atlas-based MD domains by using the Dic-e’s coefficient. The DicDic-e’s coefficient was calculated with the following equation:
s¼ 2 Xj \ Yj X j j þ Yj j
where X and Y are the volumes for which the overlap is calculated.
Evaluation of higher cognitive functions
The neuroimaging sample used in our study included nu-merous psychological testings, we have selected two subsets that assess the subjects’ higher cognitive functions. First, a brief version of the Wechsler Abbreviated Scale of Intelli-gence (WASI) was utilized (Wechsler1999). This test pro-vides a full scale intelligence quotient (FSIQ), verbal IQ and performance IQ for ages 6–86 years. The performance IQ is composed of the scores of two subsets: the Block Design and Matrix reasoning, while the verbal IQ comprises the Vocabulary and Similarities tests. Then we used results from the Delis-Kaplan Executive Function System test, the
D-KEFS (Delis et al. 2004). This evaluation aims to assess various executive functions of the individual such as prob-lem solving, planning, flexibility of thinking, concept for-mation or abstract thinking. The D-KEFS consists of nine parts that are intended to be used as stand alone tests of various capabilities and cannot be aggregated to provide an “overall score” of the executive functioning. Our assump-tion was that connectivity-based parcellaassump-tion delineates functionally cohesive territories within the mediodorsal tha-lamic nucleus. Moreover, the relative sizes of such territo-ries could serve as feasible neuroanatomical correlates of higher cognitive functions. We investigated this possible interaction by calculating the correlation between the volu-metric measurements of the connectivity-based parcellation and the psychological assessments. All D-KEFS subtest results are scaled and can comparably be used for children; however, we had to account for the possible effects of age or gender. To solve this problem when searching for correla-tions between volumetric results and psychological scales, we calculated partial Pearson correlation coefficients con-trolling for age and gender in the SPSS 18 software package.
Results
Anatomy of connectivity-based subdivisions
Due to the relatively small volume of the MD nucleus (approximately 1200 voxels in the MNI152 space which corresponds to 150 DTI voxels) we judged to search for only two connectivity-based clusters. In every case, the plane separating the two clusters was observed to be parallel to the midline resulting in a medial (MDmed) and lateral
(MDlat) subdivision of the mediodorsal nucleus. The
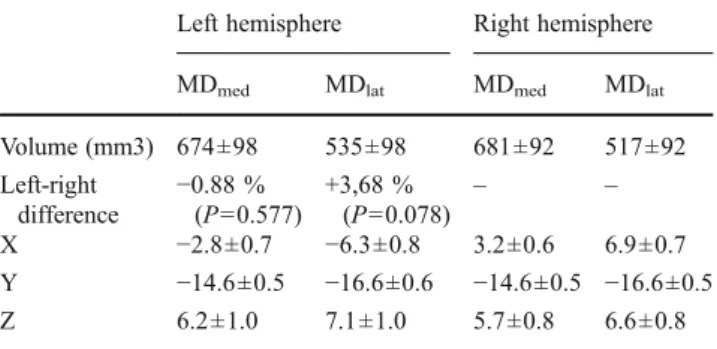
clus-ters had a consistently similar shape across subjects, the center-of-gravity points of the three-dimensional volumes were found to be very similar, the standard deviation of their coordinates ranged from 0.5 to 1 mm in all axes. The medial domain was significantly larger than the lateral, this difference was on average 25 % in both hemispheres. No significant interhemispheric asymmetry was observed for the cluster volumes. Coordinates in MNI152 space and volumes of the connectivity-based domains are summarized in Table2.
When controlling the results for the cytoarchitecture-based subdivisions of the MD, we discovered only a limited agreement between the average borders of the MDmed and
the MDmc. The MDmed cluster extended approximately to
one half of the latero-lateral diameter of the MD nucleus, and unlike the borders of the MDmc, it proportionally
extends superiorly and anteriorly. The topography of the MD connectivity-based clusters and the atlas-based depic-tion of classical anatomy are visualized in Fig.1. However, we note that when accessing the 95th percentile cluster
volumes of the population (i.e. the regions which are consis-tently assigned to the same cluster in 95 % of the cases) we observed a better visual agreement between cytoarchitecture-based and connectivity-cytoarchitecture-based outlines. A three-dimensional representation of the 95th, 50th and 5th percentile volumes of each newly defined cluster is provided in the electronic sup-plementary material (Suppl. Fig.1). The overlap between the MDmedand MDmc and the MDlatand MDpc domains were
quantified using the Dice coefficient; this index was 0.45± 0.11 and 0.74±0.04, respectively.
Fiber tract anatomy
For each hemisphere, population based representations of fiber tract anatomy were created. The probabilistic fiber tracking framework allowed following tracts until they reach the cortex, and even further, when the uncertainty of possible trajectories rise. Therefore we were able to review the clusters’ connections to atlas-defined cortical and sub-cortical regions. The MDlatcluster was the source of fibers
propagating predominantly into the anterior thalamic radia-tion and terminating in the superior and middle frontal gyri. The MDmedcluster mainly gave rise to pathways that
par-tially joined the inferior fronto-occipital fasciculus and the inferior longitudinal fasciculus, reaching the frontal orbital cortex and various temporal loci. No marked interhemi-spheric asymmetry was observed for the averaged fiber anatomy. For a more detailed description on interconnec-tions of the MD clusters, see Table3. and a 3D visualization of summed cortical interconnections on Suppl. Fig.2.
Correlations with cognitive performance
For each subject and for both hemispheres, the standard space sizes of the MDlatand MDmedclusters in the MNI152 space
were correlated with the results of the psychological tests. As the entire brain was transformed to a template (i.e. an average representation of the population), there was no clear indication to correct volumetric measurements for the size of the
thalamus. Also, due to the fact that the sum of the MDlatand
MDmedcluster volumes are constant and equals the size of the
MD in standard space, we only report correlations with the MDlatvolumes. Consequently, all results can be interpreted as
the correlation with the MDlat/MDmedratio within the
medi-odorsal nucleus, and by “cluster volume” we refer to the standardized size throughout our report.
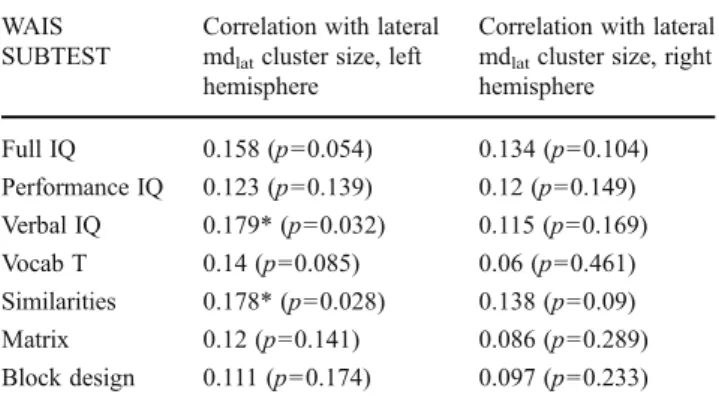
Neither the FSIQ and performance IQ scores nor their subtest results showed significant correlation with the connectivity-based subdivision ratios; however, a statistical tendency was observed for the FSIQ and the MDlatsize in
the left hemisphere (p00.054). The verbal IQ and one of its Table 2 Characterization of the connectivity-based mediodorsal nucleus
clusters in standard MNI152 space. Locations and scatters of the center-of-gravity points and volumetric measurements. Values are given in mean ± SD
Left hemisphere Right hemisphere
MDmed MDlat MDmed MDlat
Volume (mm3) 674±98 535±98 681±92 517±92 Left-right difference −0.88 % (P00.577) +3,68 %(P00.078) – – X −2.8±0.7 −6.3±0.8 3.2±0.6 6.9±0.7 Y −14.6±0.5 −16.6±0.6 −14.6±0.5 −16.6±0.5 Z 6.2±1.0 7.1±1.0 5.7±0.8 6.6±0.8
Fig. 1 Visualization of the connectivity-based clusters of the human mediodorsal thalamic nucleus. Top and middle image: coronal and axial MRI images of the thalamus, with the connectivity-based clusters overlayed onto the MNI152 T1-weighted template. The outlines of the atlas-based MDmc and MDpc+plborders are depicted (Morel 2007). Bottom image: 3D representation of the 50th percentile volumes of the medial (MDmed) and lateral (MDlat) subdivisions, visualized with the center-of-gravity points of the segments for each subject (n0156)
subcomponent, the Similarities test were proved to be posi-tively correlated with the MDlat volume (or MDlat/MDmed
ratio) in the left thalamus. These findings are detailed in Table4.
Three D-KEFS subtest measures were found to significant-ly correlate with the individual size of the connectivity-based MD clusters. The highest level of significance (P<0.01) was reported for all conditions and primary measures of the Sorting test. These measurements showed weak correlation with the connectivity-based MDlat domain sizes in both
hemispheres (and consequently, weak negative correlation of the MDmed cluster volume). A measurement from the
Design Fluency test (Condition 2: Empty Dots Only) and two from the Verbal Fluency test (Category Fluency Score, Category Switching: Switch Accuracy) were found to be significantly correlated with the sizes of the MD clusters, but this relationship was only identified in the left hemisphere. Detailed results of the correlations with three of the D-KEFS subtests are summarized in Table 5.
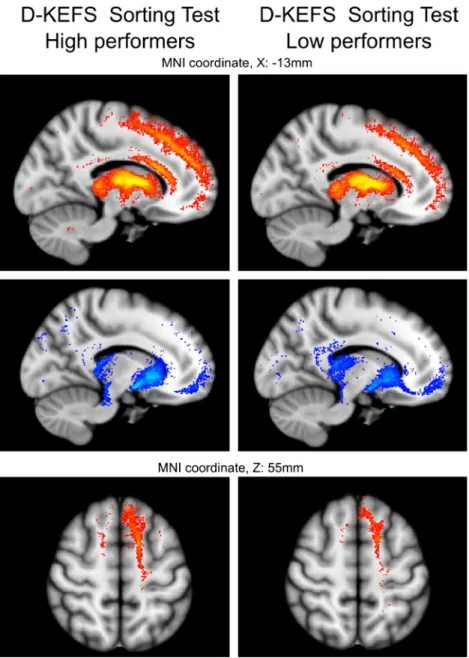
Eventually, we classified subjects into two groups, based on their performance in the Sorting Test, this allowed to create groupwise representations of the pathways arising from the MD clusters. Subject having higher“Free Sorting Description Score” subtest result of the D-KEFS Sorting Test were classified as high performers (n018), the cut off threshold was set to the 90th percentile value while low performer (n019) label was assigned if the individual had lower or equal performance than the 10 % of the popula-tion’s measurements (Sorting Test, Free Sorting Description Score; median value: 10, 10th percentile cut-off: 6, 90th percentile cut-off: 13). As revealed previously, high
performers in the Sorting Test tended to have relatively larger MDlat clusters therefore the separation of high and
low performers resulted in significantly different (P<0.001) MDlatcluster sizes between these two, newly formed groups
representing the extremities in this test. Interestingly, the summed connections from the MDlat clusters in the high
performer group covered slightly larger brain areas while the pattern of connectivity was shown to be similar to the overall representation of the population (see Fig. 2). This phenomenon of larger (and “denser” in terms of virtual connection tracing samples) cortical representation was ob-served for the prefrontal cortex, the connections of MDlat
clusters of high performers extended more anteriorly, reach-ing the frontal pole. However, we report that these differ-ences are subtle. Less visible differdiffer-ences in the connections to the orbitofrontal gyrus were found. Differences between the pathways were visually controlled for the high and low performer groups, illustrative cross-sectional representations are shown in Fig.3. For each connectivity map derived from the MDlator MDmedclusters, we have summed the
voxel-wise probability values over the brain, this variable was used as an indicator of the spatial extension of the fiber trajectories. Regarding the MDlatcluster, these values also
showed similar weak, but existing correlation with the Sort-ing Test results (r00.211, p<0.01).
In the online supplementary material, we provide a figure to illustrate the idea of single-subject level of connectional topography. In Supplementary Figure 3, individual cross-correlation matrices, MD cluster vol-umes and 3D visualizations of fiber trajectories are demonstrated.
Table 3 Connectivity-based parcellation of the thalamus mediodorsal nucleus: major interconnections to gray matter areas (Harvard-Oxford Cortical Atlas and Talairach Daemon nomenclature) and white matter structures (Jüelich Anatomical Fibers Atlas and Talairach Daemon nomenclature)
Name of connectivity cluster
Major connections from clusters, GM areas
Major connections from MD clusters, WM areas Medial cluster Frontal pole/Brodmann area 10.
(orbitobasal parts)
Anterior thalamic radiation Frontal orbital cortex Internal capsule, anterior limb Frontal medial cortex Corpus callosum, forceps minor
Temporal pole Corpus callosum, genu
Parahippocampal gyrus, anterior division
Inferior fronto-occipital fasciculus, anterior parts
Amygdala Inferior longitudinal fasciculus,
anterior parts Lateral occipital cortex, superior
division
Uncinate fasciculus Lateral cluster Frontal pole/Brodmann area 10. (superior parts) Anterior thalamic radiation
Superior frontal gyrus Internal capsule, anterior limb Middle frontal gyrus, anterior part Corpus callosum, forceps minor Inferior frontal gyrus, pars triangularis Corpus callosum, genu Supplementary motor cortex Corpus callosum, body Inferior fronto-occipital
fasciculus, anterior parts External capsule, anterior part
Discussion
The purpose of our study was to evaluate a possible single-subject level marker of connectional topography of the mediodorsal thalamic nucleus, and to reveal correlations with the subjects’ performance of executive functioning. This was done by automatically defining two regions within the MD that presented a coherent and correlated distribution of remote connections. As a continuation of studies attempt-ing to discern the human corticothalamic networks (Johan-sen-Berg et al.2005; Croxson et al.2005; Klein et al.2010), we report the identification of two separated cortico-mediodorsal networks that did not require the subsequent definition of atlas-based cortical targets when performing tractography. This is a major difference compared to the
study by Klein et al., where the delineation of the putative dorsolateral prefrontal cortex (DLPFC), lateral orbitofrontal cortex (LOFC) and anterior cingulate cortex (ACC) was necessary. The approach by Klein’s workgroup was found feasible to localize subdivisions of the human mediodorsal nucleus (namely the MDpc, MDfi and caudodorsal MD)
based on prior knowledge about cortical projections, more-over, they unveiled remarkable similarities with the ma-caque brain.
We identified two subdomains in the human mediodorsal nucleus that are separated by a border almost parallel to the sagittal plane. This separation created a medial segment which is similar to the MDmc, but slightly larger than that
and incorporates more than half of the total MD volume. When comparing this observation with earlier tract tracer Fig. 2 Anatomy of fiber tracts
emerging from the
connectivity-based subdivisions of the mediodorsal nucleus. Averaged representation of the examined population, connec-tion probabilities were overlaid onto the sagittal and coronal cross-sectional images of the MNI152 T1-weighted MR template. Blue (print: dark grey) overlay: tract trajectories from the MDmccluster. Red (print: white) overlay: tract tra-jectories from the MDlatcluster. A more detailed description of revealed interconnections is given in Table3
studies in primates, it was noticeable that such experiments also revealed a sagittally oriented, band-like organization in the MD connectivity patterns (Kievit and Kuypers 1977; Barbas et al. 1991; Ray and Price1993). The fiber tracts arising from the connectivity-based segments are in accor-dance with previous findings using in vivo techniques (Croxson et al.2005; Klein et al. 2010). The medial band has interconnections with the orbitofrontal cortex and the most rostral parts of the frontal convexities, the frontal pole; while the lateral band is connected to cortical strips that are more superiorly located, e.g. the dorsolateral prefrontal cor-tex. Klein and colleagues reported a third, cortico-mediodorsal circuit that matched the predictions from ma-caque: projections from the anterior cingulate cortex (ACC) and the lateral orbitofrontal cortex are separately located in
the mediodorsal nucleus, namely in the caudo-dorsolateral parts (Giguere and Goldman-Rakic1988). Our experiments did not allow separating more than two components of the cortex-mediodorsal thalamus circuitry; hence it is assumed that the thalamic sector with interconnections to the ACC remained undistinguishable from the MDlatcluster. As seen
in the Suppl. Fig.2, the probabilistic tractography method did not show significant connections to the ACC.
We revealed connections between the medial band of the MD (MDmed) and three target loci in the temporal lobe: the
temporal pole, amygdala and the anterior part of the para-hippocampal gyrus. Such connections to the amygdala are in agreement with the findings in Cynomolgus monkeys where predominantly the basal group gave rise to axons connecting to the magnocellular (medial) part of the medi-odorsal thalamic nucleus (Aggleton and Mishkin 1984). Classical tract tracing studies in primates confirm the exist-ing connection between the temporopolar cortex and the magnocellular division of the mediodorsal thalamic nucleus (Gower1989). The parahippocampal gyrus was found to be interconnected to both the caudal sector of the MD and the MDmc(Yeterian and Pandya1988), this only partially
over-laps with our observation that the medial band sends con-nections to the anterior parts of the parahippocampal gyrus. Inputs to the MD from visually responsive regions were also reported in cats, these were mainly projecting to the anterior and central sectors of the MD (Markowitsch et al. 1982); such connections were presumably located to the MDmed
volume in our definition.
Neuroanatomical models describe at least five distinct, segregated frontal-subcortical (i.e., cortico-striato-pallidal-Table 4 Correlations between connectivity-based cluster sizes of the
mediodorsal thalamic nucleus and measures of intelligence by the Wechsler Abbreviated Scale of Intelligence, WAIS (partial Pearson correlation coefficients, controlling for age and gender)
WAIS SUBTEST
Correlation with lateral mdlatcluster size, left hemisphere
Correlation with lateral mdlatcluster size, right hemisphere Full IQ 0.158 (p00.054) 0.134 (p00.104) Performance IQ 0.123 (p00.139) 0.12 (p00.149) Verbal IQ 0.179* (p00.032) 0.115 (p00.169) Vocab T 0.14 (p00.085) 0.06 (p00.461) Similarities 0.178* (p00.028) 0.138 (p00.09) Matrix 0.12 (p00.141) 0.086 (p00.289) Block design 0.111 (p00.174) 0.097 (p00.233)
Table 5 Correlations between connectivity-based cluster sizes of the mediodorsal thalamic nucleus and executive perfor-mance, measured using the Delis-Kaplan Executive Function System test, D-KEFS (partial Pearson correlation coefficients and significance levels, correlation was calculated to control for age and gender effects). MDlat: lateral connectivity-based cluster of the mediodorsal nucleus. For all D-KEFS subtest results, the scaled scores were used
D-KEFS Subtest Correlation with lateral
mdlatcluster size, left hemisphere
Correlation with lateral mdlatcluster size, right hemisphere
Sorting Test
Condition 1: Free Sorting Description Score 0.232** (p00.004) 0.232** (p00.004) Condition 1: Free Sorting
Confirmed Correct Sorts. 0.213** (p00.009) 0.207* (p00.011)
Condition 2: Sort Recognition Description Score 0.23** (p00.005) 0.228** (p00.005) Design Fluency Test
Condition 1 Filled Dots: Total Correct 0.155 (p00.058) 0.110 (p00.177) Condition 2 Empty Dots Only: Total Correct 0.168* (p00.04) 0.08 (p00.331) Condition 3 Switching: Total Correct 0.007 (p00.934) 0.027 (p00.741)
Design Accuracy 0.075 (p00.363) 0.049 (p00.548)
Design Fluency Total Correct 0.125 (p00.127) 0.077 (p050.348) Verbal Fluency Test
Category Fluency: Total 0.202* (p00.013) 0.05 (p00.542)
Category Switching: Total Correct 0.119 (p00.145) 0.040 (p00.63) Letter Fluency: Total Correct 0.081 (p00.321) 0.096 (p00.24) Category Switching: Switching accuracy 0.173* (p00.034) 0.117 (p00.152)
thalamocortical) circuits (Alexander et al.1986; Masterman and Cummings 1997). It is acknowledged that these net-works are organized in parallel but remain partially segre-gated from each other, especially at subcortical levels. Literature supports our observation that the segregated na-ture of such networks can be studied by using in vivo probabilistic diffusion tractography (Draganski et al. 2008) or functional MRI (Metzger et al.2010) and strong correlation can be revealed with previously reported invasive tracing studies. Two segregated networks are known to be involved in motor functioning, originating in the supplementary motor area and the frontal eye fields and mediating somatomotor and oculomotor functions, respectively. Masterman and Cummings (1997) emphasized that three of these circuits are particularly mediating aspects of cognition and behavior and the mediodorsal nucleus is accepted as an intermediary relay station for such functions, this role was acknowledged and
used as a basis for other works as well (Tekin and Cummings
2002; Liang et al.2011). These circuits are acknowledged to originate from the DLPFC, orbitofrontal cortex and the ACC. The trajectories of two “cognitive” circuits greatly coincide with the results of the present study suggesting that the two revealed subdivisions might be the thalamic representations of the DLPFC (MDlat) and the orbitofrontal (MDmed) segregated
networks. This is further supported by the fact that in our study, the algorithms were forced to search for two net-works that pass through or originate from the mediodorsal thalamic nucleus and differ from each other with the largest possible degree. The third network, originating from the ACC, remained undistinguishable during the clustering. This is a major difference to the classical model presented by Masterman and Cummings (1997), we putatively ascribe this error to the inability to depict connections to the cingulate cortex.
Fig. 3 Anatomy of fiber tracts emerging from the
connectivity-based clusters of the mediodorsal nucleus in high and low performers of the D-KEFS Sorting Test. Subgroups were created according to 90th percentile and 10th percentile performance in the executive test. Averaged tract trajectories of the two groups were overlaid onto the axial cross-sectional images of the MNI152 T1-weighted MR template
The thalamus was already reported to be actively participating in processing the information it receives (Wunderlich et al. 2005) and furthermore, a wide range of studies discovered correlation between higher cogni-tive functioning and markers of thalamic microstructure, connectivity or properties of fiber pathways arising from the thalamus. The DTI-based fractional anisotropy val-ues of white matter connecting the thalamus and the dorsal attention network activations (i.e. after analyzing resting state fMRI) were found to be positively corre-lated with executive performance (Ystad et al. 2011). Similarly, fractional anisotropy values in white matter of the frontal lobe regions were found to be correlated with tests of intelligence or performance in lexical de-cision tasks (Gold et al. 2007; Turken et al. 2008). We revealed significant correlations between executive tests by means of the D-KEF system and connectivity-based parcel sizes in the thalamus. This interaction was the most pronounced for the D-KEFS Sorting Test, which was designed to assess the subject’s abilities of problem solving and concept formation, it requires the transfer of conceptual knowledge into goal-directed behavior. A previous study discovered that both in normal controls and JME (epileptic) patients, the segmented frontal lobe and thalamic volumes were significant predictors of D-KEFS performance (Pulsipher et al. 2009). When relat-ing locations of lesions and the impairment of executive performance, the mediodorsal nucleus was reported to play a possible role in such functions (Radanovic et al.
2003; Little et al. 2010). The circuit originating from the DLPFC is commonly linked with executive func-tions. Moreover, it is acknowledged that connections from the anterior thalamus to the frontal cortex mediate executive functions (Van der Werf et al. 2000; Van der Werf et al. 2003). Our findings indirectly suggest that the DLPFC network is more dominantly involved in neuronal processes that are tested during the D-KEFS evaluation, it is assumed that in high performers, the mediodorsal nucleus is interconnected to a relatively larger prefrontal cortical area.
Our study has several limitations. Diffusion tensor imaging and tractography methods were found plausible in recognizing major white matter structures but it is impossible to identify functional connections, individual synapses or tract polarity. Data acquisition is limited to elementary volumes of 4–8 mm3
which is potentially composed of tens of thousands of individual axons that are not necessarily coherent but cross, converge or diverge. Thus the estimation of multiple fiber directions per voxels is necessary, the applied protocol with 64 allowed us to approximate two of such populations. We assume that more developed acquisition and image pro-cessing methods by means of high angular diffusion
imaging (Tuch et al. 2002) or diffusion spectrum imag-ing (Wedeen et al. 2008) can more credibly depict the connectional anatomy of the human brain. Such high angular resolution might help to follow fiber pathways between the thalamus MD and the ACC, which was not feasible in the current study and the third “cognitive” circuit remained undistinguishable. We highlight that to overcome the possible limitations of using a single modality, it would be necessary to conduct confirmatory studies using task-based or resting-state fMRI, where the main goal would be to reveal similar subdivision patterns and interactions with psychological measure-ments. Furthermore, the definition of gross mediodorsal nucleus borders represents a further possible source of errors. In our case, a mean representation of thalamus geometry and a non-linear matching method was used that have limited capabilities in tackling with individual variations of fine intrathalamic anatomy. Further studies are required to quantitatively study and validate such of atlas-to-patient registrations. As all calculations were carried out in standard MNI152 space, the currently unveiled correlations can rather be interpreted for the ratio of the MDlat and MDmed clusters and not real
volumetric values.
Conclusion
Connectivity-based segmentation of gray matter is a non-invasive, imaging-based computational method that outlines brain areas that share similar structural connectivities. Our study has successfully applied this method to reveal two subdomains in the human mediodorsal thalamic nucleus: MDmedand MDlat, these subdivisions show similar
macro-scopic organization to the cytoarchitecture based subdivi-sions: MDmcand MDpc. The connections arising from these
subdomains were shown to be mainly connected to the dorsolateral prefrontal cortex (MDlat) and to the
orbitofron-tal cortex (MDmed). An automatic approach was employed
that allows quantifying the relative size of the thalamic representation of these two distinct circuitries. Using a large number of subjects, we demonstrated that this single subject level marker of connectional anatomy weakly interacts with the individual’s executive performance.
Acknowledgements The authors gratefully acknowledge the valu-able comments of Anne Morel (Center for Clinical Research, Univer-sity Hospital Zürich) and the technical support of Saad Jbabdi (Centre for Functional Magnetic Imaging of the Brain, University of Oxford) and Gabor Szekely (Computer Vision Laboratory, ETH Zürich). Sub-ject data were kindly provided by the Nathan S. Kline Institute for Psychiatric research. A.J. is supported by the Sciex NMS-CH Fellowship.
Conflicts of interest The authors declare that they have no conflict of interest.
References
Aggleton, J. P., & Mishkin, M. (1984). Projections of the amygdala to the thalamus in the cynomolgus monkey. The Journal of Com-parative Neurology, 222(1), 56–68.
Alexander, G. E., DeLong, M. R., & Strick, P. L. (1986). Parallel organization of functionally segregated circuits linking basal gan-glia and cortex. Annual Review of Neuroscience, 9(1), 357–381. Barbas, H., Henion, T. H. H., & Dermon, C. R. (1991). Diverse
thalamic projections to the prefrontal cortex in the rhesus monkey. The Journal of Comparative Neurology, 313(1), 65–94. Basser, P. J., & Pierpaoli, C. (1996). Microstructural and physiological
features of tissues elucidated by quantitative-diffusion-tensor MRI. Journal of Magnetic Resonance. Series B, 111(3), 209–219. Behrens, T. E. J., Johansen-Berg, H., Woolrich, M. W., Smith, S. M., Wheeler-Kingshott, C., Boulby, P. A., & Matthews, P. M. (2003). Non-invasive mapping of connections between human thalamus and cortex using diffusion imaging. Nature Neuroscience, 6(7), 750–757.
Behrens, T. E. J., Woolrich, M. W., Jenkinson, M., Johansen-Berg, H., Nunes, R. G., Clare, S., & Smith, S. M. (2003). Characterization and propagation of uncertainty in diffusion-weighted MR imaging. Magnetic Resonance in Medicine, 50(5), 1077–1088.
Castellanos, F. X., Leventhal, B., & Milham, M. (2011). Nathan Kline Institute (NKI)/Rockland Sample. http://fcon_1000.projects. nitrc.org/indi/pro/nki.htmlAccessed 01 July 2011.
Catani, M. (2007). From hodology to function. Brain, 130(3), 602– 605.
Catani, M., Howard, R. J., Pajevic, S., & Jones, D. K. (2002). Virtual in vivo interactive dissection of white matter fasciculi in the human brain. NeuroImage, 17(1), 77–94.
Croxson, P. L., Johansen-Berg, H., Behrens, T. E. J., Robson, M. D., Pinsk, M. A., Gross, C. G., & Rushworth, M. F. S. (2005). Quantitative investigation of connections of the prefrontal cortex in the human and macaque using probabilistic diffusion tractog-raphy. The Journal of Neuroscience, 25(39), 8854–8866. Dauguet, J., Peled, S., Berezovskii, V., Delzescaux, T., Warfield, S. K.,
Born, R., & Westin, C. (2007). Comparison of fiber tracts derived from in-vivo DTI tractography with 3D histological neural tract tracer reconstruction on a macaque brain. NeuroImage, 37(2), 530–538.
Delis, D. C., Kramer, J. H., Kaplan, E., & Holdnack, J. (2004). Reliability and validity of the DelisKaplan Executive Function System: an update. Journal of the International Neuropsycholog-ical Society, 10, 301–303.
Draganski, B., Kherif, F., Kloppel, S., Cook, P. A., Alexander, D. C., Parker, G. J. M., & Frackowiak, R. S. J. (2008). Evidence for segregated and integrative connectivity patterns in the human basal ganglia. Journal of Neuroscience, 28(28), 7143–7152. Elias, W. J., Zheng, Z. A., Domer, P., Quigg, M., & Pouratian, N.
(2011). Validation of connectivity-based thalamic segmentation with direct electrophysiologic recordings from human sensory thalamus. NeuroImage, doi:10.1016/j.neuroimage.2011.10.049
Erickson, S. L., & Lewis, D. A. (2004). Cortical connections of the lateral mediodorsal thalamus in cynomolgus monkeys. The Jour-nal of Comparative Neurology, 473(1), 107–127.
Giguere, M., & Goldman-Rakic, P. S. (1988). Mediodorsal nucleus: areal, laminar, and tangential distribution of afferents and effer-ents in the frontal lobe of rhesus monkeys. The Journal of Com-parative Neurology, 277(2), 195–213.
Gold, B. T., Powell, D. K., Xuan, L., Jiang, Y., & Hardy, P. A. (2007). Speed of lexical decision correlates with diffusion anisotropy in left parietal and frontal white matter: evidence from diffusion tensor imaging. Neuropsychologia, 45(11), 2439–2446. Goldman-Rakic, P. S., & Porrino, L. J. (1985). The primate
mediodor-sal (MD) nucleus and its projection to the frontal lobe. The Journal of Comparative Neurology, 242(4), 535–560.
Gower, E. C. (1989). Efferent projections from limbic cortex of the temporal pole to the magnocellular medial dorsal nucleus in the rhesus monkey. The Journal of Comparative Neurology, 280(3), 343–358.
Hansen, B., Flint, J. J., Heon-Lee, C., Fey, M., Vincent, F., King, M. A., & Blackband, S. J. (2011). Diffusion tensor micros-copy in human nervous tissue with quantitative correlation based on direct histological comparison. NeuroImage, 57(4), 1458–1465.
Izquierdo, A., & Murray, E. A. (2010). Functional interaction of medial mediodorsal thalamic nucleus but not nucleus accumbens with amygdala and orbital prefrontal cortex is essential for adaptive response selection after reinforcer devaluation. The Journal of Neuroscience, 30(2), 661–669.
Jakab, A., Molnar, P., Bogner, P., Beres, M., & Berenyi, E. (2011). Connectivity-based parcellation reveals interhemispheric differ-ences in the insula. Brain Topography, doi: 10.1007/s10548-011-0205-y
Jbabdi, S., Woolrich, M. W., & Behrens, T. E. J. (2009). Multiple-subjects connectivity-based parcellation using hierarchical dirich-let process mixture models. NeuroImage, 44(2), 373–384. Johansen-Berg, H., & Rushworth, M. F. S. (2009). Using diffusion
imaging to study human connectional anatomy. Annual Review of Neuroscience, 32(1), 75–94.
Johansen-Berg, H., Behrens, T. E. J., Robson, M. D., Drobnjak, I., Rushworth, M. F. S., Brady, J. M., & Matthews, P. M. (2004). Changes in connectivity profiles define functionally distinct regions in human medial frontal cortex. Proceedings of the Na-tional Academy of Sciences of the United States of America, 101 (36), 13335–13340.
Johansen-Berg, H., Behrens, T. E. J., Sillery, E., Ciccarelli, O., Thompson, A. J., Smith, S. M., & Matthews, P. M. (2005). Functional–Anatomical validation and individual variation of diffusion tractography-based segmentation of the human thala-mus. Cerebral Cortex, 15(1), 31–39.
Jung, R. E., & Haier, R. J. (2007). The Parieto-Frontal Integration Theory (P-FIT) of intelligence: converging neuroimaging evi-dence. The Behavioral and Brain Sciences, 30(2), 135–154. Kievit, J., & Kuypers, H. (1977). Organization of the thalamo-cortical
connexions to the frontal lobe in the rhesus monkey. Experimental Brain Research, 29(3), 299–322.
Klein, J. C., Behrens, T. E. J., Robson, M. D., Mackay, C. E., Higham, D. J., & Johansen-Berg, H. (2007). Connectivity-based parcella-tion of human cortex using diffusion MRI: establishing reproduc-ibility, validity and observer independence in BA 44/45 and SMA/pre-SMA. NeuroImage, 34(1), 204–211.
Klein, J. C., Rushworth, M. F. S., Behrens, T. E. J., Mackay, C. E., de Crespigny, A. J., D’Arceuil, H., & Johansen-Berg, H. (2010). Topography of connections between human prefrontal cortex and mediodorsal thalamus studied with diffusion tractography. NeuroImage, 51(2), 555–564.
Krauth, A., Blanc, R., Poveda, A., Jeanmonod, D., Morel, A., & Székely, G. (2010). A mean three-dimensional atlas of the human thalamus: generation from multiple histological data. Neuro-Image, 49(3), 2053–2062.
Le Bihan, D., Breton, E., Lallemand, D., Grenier, P., Cabanis, E., & Laval-Jeantet, M. (1986). MR imaging of intravoxel incoherent motions: application to diffusion and perfusion in neurologic disorders. Radiology, 161(2), 401–407.
Liang, P., Wang, Z., Yang, Y., Jia, X., & Li, K. (2011). Functional disconnection and compensation in mild cognitive impairment: evidence from DLPFC connectivity using resting-state fMRI. PLoS One, 6(7), e22153.
Little, D. M., Kraus, M. F., Joseph, J., Geary, E. K., Susmaras, T., Zhou, X. J., & Gorelick, P. B. (2010). Thalamic integrity underlies executive dysfunction in traumatic brain injury. Neurology, 74(7), 558–564.
Luders, E., Narr, K. L., Thompson, P. M., & Toga, A. W. (2009). Neuroanatomical correlates of intelligence. Intelligence, 37(2), 156–163.
Markowitsch, H. J., Irle, E., & Streicher, M. (1982). The thalamic mediodorsal nucleus receives input from thalamic and cortical regions related to vision. Neuroscience Letters, 32(2), 131– 136.
Masterman, D. L., & Cummings, J. L. (1997). Frontal-subcortical circuits: the anatomic basis of executive, social and motivated behaviors. Journal of Psychopharmacology, 11(2), 107–114. Menke, R. A., Jbabdi, S., Miller, K. L., Matthews, P. M., & Zarei, M.
(2010). Connectivity-based segmentation of the substantia nigra in human and its implications in parkinson’s disease. Neuro-Image, 52(4), 1175–1180.
Metzger, C. D., Eckert, U., Steiner, J., Sartorius, A., Buchmann, J. E., Stadler, J., & Walter, M. (2010). High field fMRI reveals thala-mocortical integration of segregated cognitive and emotional pro-cessing in mediodorsal and intralaminar thalamic nuclei. Frontiers in Neuroanatomy. doi:10.3389/fnana.2010.00138. Morel, A. (2007). Stereotactic atlas of the human thalamus and basal
Ganglia. New York: Informa Healthcare USA, inc.
Mori, S., & van Zijl, P. C. M. (2002). Fiber tracking: principles and strategies? a technical review. NMR in Biomedicine, 15(7–8), 468–480.
Nanetti, L., Cerliani, L., Gazzola, V., Renken, R., & Keysers, C. (2009). Group analyses of connectivity-based cortical parcellation using repeated k-means clustering. Neuroimage, 47(4), 1666– 1677.
Negyessy, L., & Goldman-Rakic, P. (2005). Morphometric characteriza-tion of synapses in the primate prefrontal cortex formed by afferents from the mediodorsal thalamic nucleus. Experimental Brain Re-search, 164(2), 148–154.
Niemann, K., Mennicken, V. R., Jeanmonod, D., & Morel, A. (2000). The morel stereotactic atlas of the human thalamus: atlas-to-MR registration of internally consistent canonical model. NeuroImage, 12(6), 601–616.
O’Muircheartaigh, J., Vollmar, C., Traynor, C., Barker, G. J., Kumari, V., Symms, M. R., & Richardson, M. P. (2011). Clustering probabilistic tractograms using independent component analysis applied to the thalamus. NeuroImage, 54(3), 2020–2032.
Öngür, D., & Price, J. L. (2000). The organization of networks within the orbital and medial prefrontal cortex of rats, monkeys and humans. Cerebral Cortex, 10(3), 206–219.
Pouratian, N., Zheng, Z., Bari, A. A., Behnke, E., Elias, W. J., & DeSalles, A. A. F. (2011). Multi-institutional evaluation of deep brain stimulation targeting using probabilistic connectivity-based thalamic segmentation. Journal of Neurosurgery, 1–10. doi:10.3171/2011.7.JNS11250.
Pulsipher, D. T., Seidenberg, M., Guidotti, L., Tuchscherer, V. N., Morton, J., Sheth, R. D., & Hermann, B. (2009). Thalamofrontal circuitry and executive dysfunction in recent-onset juvenile myo-clonic epilepsy. Epilepsia, 50(5), 1210–1219.
Radanovic, M., Azambuja, M., Mansur, L. L., Porto, C. S., & Scaff, M. (2003). Thalamus and language: interface with attention, memory and executive functions. Arquivos De Neuro-Psiquiatria, 61(1), 34–42.
Rao, A., Aljabar, P., & Rueckert, D. (2008). Hierarchical statistical shape analysis and prediction of sub-cortical brain structures. Medical Image Analysis, 12(1), 55–68.
Ray, J. P., & Price, J. L. (1993). The organization of projections from the mediodorsal nucleus of the thalamus to orbital and medial prefron-tal cortex in macaque monkeys. The Journal of Comparative Neurology, 337(1), 1–31.
Siwek, D. F., & Pandya, D. N. (1991). Prefrontal projections to the mediodorsal nucleus of the thalamus in the rhesus mon-key. The Journal of Comparative Neurology, 312(4), 509–524. Smith, S. M., Jenkinson, M., Woolrich, M. W., Beckmann, C. F.,
Behrens, T. E. J., Johansen-Berg, H., Bannister, P. R., De Luca, M., Drobnjak, I., Flitney, D. E., Niazy, R., Saunders, J., Vickers, J., Zhang, Y., De Stefano, N., Brady, J. M., & Matthews, P. (2004). Advances in functional and structural MR image analysis and implementation as FSL. NeuroImage, 23(Suppl 1), S208–19.
Tekin, S., & Cummings, J. L. (2002). Frontal–subcortical neuronal circuits and clinical neuropsychiatry: an update. Journal of Psy-chosomatic Research, 53(2), 647–654.
Tomassini, V., Jbabdi, S., Klein, J. C., Behrens, T. E. J., Pozzilli, C., Matthews, P. M., & Johansen-Berg, H. (2007). Diffusion-weighted imaging tractography-based parcellation of the human lateral premotor cortex identifies dorsal and ventral subregions with anatomical and functional specializations. The Journal of Neuroscience, 27(38), 10259–10269.
Traynor, C., Heckemann, R. A., Hammers, A., O’Muircheartaigh, J., Crum, W. R., Barker, G. J., & Richardson, M. P. (2010). Repro-ducibility of thalamic segmentation based on probabilistic trac-tography. NeuroImage, 52(1), 69–85.
Tuch, D. S., Reese, T. G., Wiegell, M. R., Makris, N., Belliveau, J. W., & Wedeen, V. J. (2002). High angular resolution diffusion imag-ing reveals intravoxel white matter fiber heterogeneity. Magnetic Resonance in Medicine, 48, 577–582.
Turken, A. U., Whitfield-Gabrieli, S., Bammer, R., Baldo, J. V., Dronkers, N. F., & Gabrieli, J. D. E. (2008). Cognitive processing speed and the structure of white matter pathways: convergent evidence from normal variation and lesion studies. NeuroImage, 42(2), 1032–1044.
Van der Werf, Y. D., Witter, M. P., Uylings, H. B. M., & Jolles, J. (2000). Neuropsychology of infarctions in the thalamus: a review. Neuropsychologia, 38(5), 613–627.
Van der Werf, Y. D., Scheltens, P., Lindeboom, J., Witter, M. P., Uylings, H. B. M., & Jolles, J. (2003). Deficits of memory, executive functioning and attention following infarction in the thalamus; a study of 22 cases with localised lesions. Neuropsy-chologia, 41(10), 1330–1344.
Wechsler, D. (1999). Wechsler abbreviated scale of intelligence. San Antonio: The Psychological Corporation.
Wedeen, V. J., Wang, R. P., Schmahmann, J. D., Benner, T., Tseng, W. Y., Dai, G., Pandya, D. N., Hagmann, P., D’Arceuil, H., & de Crespigny, A. J. (2008). Diffusion spectrum magnetic resonance imaging (DSI) tractography of crossing fibers. NeuroImage, 41 (4), 1267–1277.
Wunderlich, K., Schneider, K. A., & Kastner, S. (2005). Neural corre-lates of binocular rivalry in the human lateral geniculate nucleus. Nature Neuroscience, 8(11), 1595–1602.
Yeterian, E. H., & Pandya, D. N. (1988). Corticothalamic connections of paralimbic regions in the rhesus monkey. The Journal of Comparative Neurology, 269(1), 130–146.
Ystad, M., Hodneland, E., Adolfsdottir, S., Haász, J., Lundervold, A. J., Eichele, T., & Lundervold, A. (2011). Cortico-striatal connec-tivity and cognition in normal aging: a combined DTI and resting state fMRI study. NeuroImage, 55(1), 24–31.