Upstream and downstream sequence elements determine the specificity of
the rice tungro bacilliform virus promoter and influence RNA production
after transcription initiation
Andreas Klöti
1,3, C´ecile Henrich
1, St´ephane Bieri
1, Xiaoyuan He
2, Gang Chen
2, Peter K.
Burkhardt
1, Joachim Wünn
4, Paola Lucca
1, Thomas Hohn
2, Ingo Potrykus
1and Johannes
Fütterer
1,∗1Institute of Plant Sciences, ETH Zürich, Universitätstrasse 2, 8092 Zürich, Switzerland (∗author for
correspon-dence); 2Friedrich Miescher Institute, P.O. Box 2543, 4002 Basel, Switzerland; 3present address: Paradigm
Genetics, 104 Alexander Drive, Durham, NC 27709, USA;4present address: Monsanto, European Crop Research Centre, Rue Laid Burniat 5, 1348 Louvain-la-Neuve, Belgium
Received 9 March 1998; accepted in revised form 18 January 1999
Key words: epidermis specifcity, promoter comparison, RNA polymerase processivity, transgenic rice
Abstract
The contribution of sequences upstream and downstream of the transcription start site to the strength and specificity of the promoter of rice tungro bacilliform virus was analysed in transgenic rice plants. The promoter is strongly stimulated by downstream sequences which include an intron and is active in all vascular and epidermal cells. Expression in the vascular tissue requires a promoter element located between−100 and −164 to which protein(s) from rice nuclear extracts bind. Elimination of this region leads to specificity for the epidermis. Due to the presence of a polyadenylation signal in the intron, short-stop RNA is produced from the promoter in addition to full-length primary transcript and its spliced derivatives. The ratio between short-stop RNA and full-length or spliced RNA is determined by upstream promoter sequences, suggesting the assembly of RNA polymerase complexes with different processivity on this promoter.
Introduction
In the analyses of plant promoters, most emphasis has been on sequences upstream of the transcription start site (Guilfoyle, 1997). However, in recent years, important regulatory sequences downstream of the transcription start site have been detected in an in-creasing number of plant promoters both in translated and untranslated regions (Bovy et al., 1995; Caspar and Quail, 1993; Curie et al., 1993; Curie and Mc-Cormick, 1997; De Almeida et al., 1989; Dean et al., 1989; Douglas et al., 1991; Fu et al., 1995; Hohn
et al., 1996; Kyozuka et al., 1994; Larkin et al., 1993;
Lois et al., 1989; Pierce et al., 1987; Sieburth and Meyerowitz, 1997; Wong et al., 1992). Particularly in monocots, enhancement of gene expression by down-stream sequences is often linked to the presence of
an intron (Callis et al., 1987; Donath et al., 1995; Fütterer et al.; 1994; Li et al., 1995; Luehrsen and Walbot, 1991; Maas et al., 1991; Mascarenhas et al., 1990; McElroy et al., 1990; Oard et al., 1989; Rathus
et al., 1993; Sinibaldi and Mettler, 1992; Tanaka et al.,
1990; Vasil et al., 1989; reviewed in Simpson and Filipowicz, 1996). In dicots, enhancement by introns is less pronounced (Genschick et al., 1994; Norris
et al., 1993; Tanaka et al., 1990), but a recent study
with transgenic Arabidopsis plants revealed that ex-pression was stimulated by introns of the PAT1 gene (Rose and Last, 1997). It appears that the splicing process itself often contributes to the enhancement. However, since not all intron-promoter combinations function in the same way and since in some cases posi-tion effects are observed (Callis et al., 1987; Snowden
features of these sequences are also important (e.g. intron-based enhancers; Gidekel et al., 1996). For the maize shrunken 1 gene, contribution of the first exon to enhanced expression has been proven in a tran-sient expression system (Clancy et al., 1994; Maas
et al., 1991), but again the underlying mechanism is
unclear. For the cauliflower mosaic virus (CaMV) 35S promoter it has been reported that expression can be enhanced by including CaMV sequences downstream of the transcription start site; however, the mecha-nism of this enhancement has not been studied further (Hohn et al., 1996; Pierce et al., 1987).
For many applications in monocot transformation, downstream exons and introns are incorporated into gene expression cassettes to achieve high expression levels. The CaMV 35S promoter is strongly en-hanced by insertion of monocot introns in some plant species. The promoters of the rice actin1 gene and the maize ubiquitin1 gene are the two other most widely used constitutive promoters for monocot transforma-tion (Christensen et al., 1992; McElroy et al., 1990). In these promoter cassettes, the first exon and intron are routinely present and without these sequences, the activity of the promoters is negligible.
Rice tungro bacilliform virus (RTBV) belongs to the badnaviruses which are one group of the plant pararetroviruses; RTBV is thus related to the caulimovirus CaMV (Hull, 1996). As part of our study of the molecular biology of RTBV we became inter-ested in the promoter that controls the synthesis of the genome-length, pregenomic RNA from the circu-lar DNA template. In addition to the 35S promoter of CaMV, the corresponding promoters of figwort mosaic virus (Sanger et al., 1990), commelina yellow mottle virus (CoYMV; Medberry and Olszewski, 1993), cas-sava vein mosaic virus (Verdaguer et al., 1996) and sugarcane bacilliform virus (Tzafrir et al., 1998) have been analysed and have always turned out to be strong in those tissues where they were active. The RTBV promoter has been studied in transformed rice plants and in transfected protoplasts. The transcription initi-ation site has been mapped to genome positions 7404 and 7405 (Bao and Hill, 1993; Yin and Beachy, 1995). In transgenic rice plants, phloem-specific activity was found first for a DNA fragment spanning positions 6671 to 7390 of the RTBV genome (Bhattacharyya-Pakrasi et al., 1993) (numbering according to Qu
et al., 1991) and later for fragments covering
posi-tions 6671 to 7449 (Matsumura and Tabayashi, 1995; Yin and Beachy, 1995). In protoplasts, the activity of the RTBV promoter depended not only on upstream
elements but also on stimulatory elements in the tran-scribed region (up to position 7500) (Chen et al., 1994, 1996), which were absent from the constructs tested so far in transgenic plants (Yin and Beachy, 1995). The first 250 nucleotides downstream of the transcription start site contain not only a DNA-dependent, independent enhancer element, but also a position-dependent element (Chen et al., 1996). In addition, a splice donor site to generate an mRNA for the open reading frame (ORF) IV (Fütterer et al., 1994), the transcription terminator for the generation of the ter-minally redundant RTBV pregenomic RNA (Rothnie, 1996), and elements involved in translation of the complex RTBV mRNA (Chen et al., 1994; Fütterer
et al., 1996) are present within this region.
In this report, we evaluate whether downstream promoter sequences (dps) contribute to RTBV pro-moter activity or influence the tissue specificity
in planta. Reporter gene constructs which express
β-glucuronidase (GUS) under the control of RTBV pro-moter fragments containing different deletions in the regions upstream and downstream of the transcription start site were analysed. The expression characteristic of the RTBV promoter was compared to the CaMV 35S promoter for which various levels of strength and specificity in rice have been previously reported (Battraw and Hall, 1993; Turner et al., 1996).
Our results show that the RTBV promoter that includes downstream sequences is active in a wider range of rice cell types than one where these sequences are lacking, and is comparable in strength to the CaMV 35S promoter, which is also enhanced by the RTBV downstream sequences. The analysis of RNAs produced under the control of the viral sequences re-vealed a complex picture, indicating that processes after transcription initiation are affected by deletions upstream and downstream of the transcription start site. The data also suggest that RNA polymerase II complexes with different activities may exist in plant cells.
Materials and methods Construction of plasmids
Plasmid CintG (Figure 1) was constructed by ex-change of the chloramphenicol acetyltransferase (CAT) ORF from plasmid pC4C1BB7253 (Fütterer
et al., 1994) with a GUS ORF (as HindIII-PstI
frag-ment). Insertion of a CaMV 35S promoter-aph4-CaMV 35S terminator cassette as a blunted KpnI
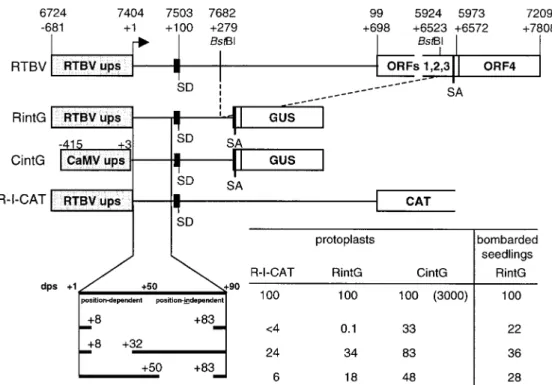
Figure 1. The structure of the RTBV transcription unit is indicated schematically. The locations of features important for the work described in this manuscript are indicated with their position in the genome (following the numbering of Hay et al. 1991) and relative to the transcription start site at position 7404 (+1). A line represents the leader sequence of the pregenomic RNA and a small black box the short ORF A. The other short ORFs in the leader are not shown. The splice donor (SD) and splice acceptor (SA) and the BstBI sites used to create the shortened version of the intron are indicated. RTBV ups: upstream promoter sequences of RTBV. In the lower part, the constructs with a CAT ORF fused to the first ORF downstream of the leader sequence (R-I-CAT) and with a GUS ORF fused to RTBV ORF IV downstream of a truncated version of the intron (RintG) are shown schematically and different deletion variants of these constructs with their respective expression levels are listed. Features of the downstream promoter sequences (dps) as characterized by Chen et al. (1996) are shown. The leader variants were also tested under the control of CaMV 35S upstream promoter sequences (CintG; the sequence coordinates relative to the CaMV transcription start site are given); the value in brackets in the CintG column represents the expression level relative to RintG, the other expression values are presented in relation to the value for the undeleted dps, which was set to 100. The data represent the average of 4 to 10 independent transfection experiments. Variation between different experiments was± 20% of the indicated value.
fragment from plasmid pSBH1 (Wünn et al., 1996) into the NaeI site of pCintG created pHCintG. The resulting plasmid contains the gene for aph4 and for GUS in the same orientation (see Figure 2). The junc-tion between the HindIII site and the GUS ORF is AAGCTTctaCCATGG (HindIII and NcoI restriction sites in capital letters, GUS start codon underlined) creating an optimized translation context for the GUS start codon. The GUS ORF together with parts of the intron was transferred from pHCintG to RTBV pro-moter constructs containing various deletions in the regions upstream and downstream of the transcription start site (Chen et al., 1994, 1996) as a BstBI (par-tial) to PstI fragment inserted into the respective sites of the RTBV promoter constructs. The hygromycin resistance gene was inserted as a KpnI fragment (as above) into the KpnI site of the RTBV promoter-GUS plasmids downstream of the polyadenylation signal in
the same transcription orientation as the GUS gene (Figure 2).
The plasmid for the antisense probe contains a
MunI-BamHI fragment from HRintG inserted into the EcoRI and BamHI site of pGem1 (Promega). The
probe covers the first 140 nt of the GUS ORF, the intron and the first exon plus 220 nt of the promoter.
RTBV sequences are derived from the clone de-scribed by Hay et al. (1991).
Transient expression assays
Assays were performed with protoplasts derived from a rice Oc suspension culture which were transfected with circular plasmid DNA by PEG-mediated trans-formation as described previously (Fütterer et al., 1994). GUS expression was normalized to a cotrans-fected CAT expression construct. For bombardment of
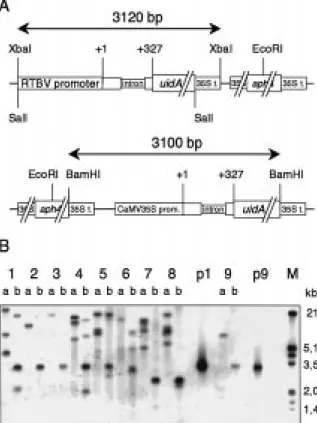
Figure 2. Southern analysis of transgenic rice plants. A. The struc-ture of the transgenes is shown schematically (not to scale). The re-striction sites used to either excise the promoter-GUS region (XbaI, SalI or BamHI, respectively) or to cut once in the unit (EcoRI) are indicated and the size of the expected fragment (for the full-length promoter) is given. 35S t.: CaMV polyadenylation signal. B. South-ern analysis. The probe was specific for the GUS coding region. Lanes: a, digestion with the single cutting enzyme EcoRI; b, di-gestion to release a complete GUS gene (1–4, p1: XbaI; 5–8: SalI, 9, p9: BamHI). One exemplary transgenic line for each construct is shown: 1, HRintG-680, 2, HRintG18-83; 3, HRintG18-32; 4, HRintG150-83; 5, HRintG-280; 6, HRintG-218; 7, HRintG-101; 8, HRintG-54; p1, plasmid HRintG-680; 9, HCintG; p9, plasmid HCintG; M, size marker.
seedlings, surface-sterilized seeds of rice (cv. Taipei 309) were germinated and grown for 4 days in the dark and bombarded with gold microparticles conju-gated to the respective DNA with a Biolistic PDS-100 system (BioRad). GUS expressing cells were visu-alized after vacuum infiltration with GUS staining solution (0.1 M sodium phosphate buffer pH 7.0, 0.5 mg/ml 5-bromo-4-chloro-3-indolyl glucuronide (X-gluc, Biosynth, Switzerland), 10 mM Na-EDTA, 5 mM potassium ferricyanide, 5 mM potassium ferro-cyanide) (Mendel et al., 1989), incubation overnight at 37◦C, rinsing in sodium phosphate buffer, fixation in 5% formaldehyde, 5% acetic acid and 20% ethanol, and removal of chlorophyll by overnight incubation in
70% ethanol. Blue cells were counted under a light microscope.
Plant transformation
Transgenic plants were obtained by particle bombard-ment of immature rice embryos (cv. Taipei 309) as described by Burkhardt et al. (1997).
Southern analysis
DNA isolation and Southern analysis was performed as described (Burkhardt et al., 1997). Genomic DNA was digested with EcoRI, which cuts in the aph4 gene and only once in the transgene, or with SalI, XbaI or BamHI, which all release an (almost) complete copy of the GUS coding region fused to the respec-tive promoter. Different enzymes had to be used for the different constructs since the restriction sites at the 50 end of the promoters vary (Figure 2). DNA blots were probed with a digoxygenin-labelled 320 bp frag-ment derived from the GUS region (Burckhardt et al., 1997).
Histological GUS assay
Explants were either stained whole or first sliced man-ually with a razor blade and then the slices were stained in filter-sterilized GUS staining solution (as above, but with 1 g/l X-Gluc and 1 g/l Triton X-100) at room temperature for 45 min to 16 h. The staining was stopped and chlorophyll was removed by incubating the slices for 30 min in 96% ethanol. Whole explants were photographed with a stereo-microscope, slices were inspected and photographed in 80% glycerol under an inverted light microscope.
Fluorometric GUS assay
Fluorometric GUS assays were performed as de-scribed by Jefferson (1987). Ca. 200 mg of callus material or different parts of rice seedlings of vari-able age were ground in 300 µl extraction buffer. For each extract, the respective parts of three plants were analysed. Extracts were shock-frozen in liquid nitrogen and stored at−80◦C until further process-ing. Protein concentration was determined by Brad-ford staining. GUS enzyme activity was determined as the production in nmol per minute per micro-gram of protein of 4-methylumbelliferone (MU) from 4-methylumbelliferyl-β-D-glucuronide.
RNA analysis
Total RNA was isolated from six-day old seedlings by the method of Chomczynski and Sacchi (1987) and 3 to 5 µg subjected to an RNase A/T1 map-ping as described (Fütterer et al., 1994). The anti-sense RNA was generated by in vitro transcription of the MunI to BamHI fragment described above by T7 RNA polymerase in the presence of [α-32P]UTP (30 TBq/mmol). RNA quantification were performed in two or three independent analyses with one or two independent transgenic lines per construct (construct pHRintG-54 was analysed only once). The amount of the different RNA species was measured by de-termination of the radioactivity in the different bands, correction for the length and U content of the particu-lar protected region, and normalization with respect to the first exon of the rice actin1 mRNA.
Gel retardation assays
Protein extracts from suspension cultures or from rice seedlings were prepared as described (Chen et al., 1996). Preparation of labelled probes and of com-petitor fragments, reaction with the protein extracts and analysis by gel electrophoresis were performed as described (Chen et al., 1996). As probe, a syn-thetic double-stranded DNA oligonucleotide covering the RTBV genome from position 7250 to 7307 was used.
Results
RTBV promoter-GUS constructs and analysis of transient expression
To test the influence of upstream or downstream pro-moter sequences (ups and dps, respectively) on RTBV promoter activity in transgenic rice plants, we con-structed a number of reporter genes containing dif-ferent RTBV ups and dps regions, a shortened ver-sion of the RTBV intron, and a GUS ORF fused to RTBV ORF IV (RintG, Figure 1). These constructs were first tested in transfected rice protoplasts and compared to previously described constructs with a chloramphenicol acetyltransferase (CAT) ORF fused to RTBV ORF I (R-I-CAT, Figure 1; Chen et al., 1994, 1996). For both types of constructs efficient expres-sion was heavily dependent on downstream promoter sequences. Upstream sequences beyond−54 were not required (not shown) whereas a deletion between+8
and+83 drastically reduced expression. Partial dele-tions in the dps also reduced expression, although less dramatically (RintG and R-I-CAT, Figure 1).
Replacement of the RTBV ups by the CaMV 35S ups resulted in a 30-fold enhancement of expression. In this case, the influence of the RTBV dps was much less significant (CintG, Figure 1). Constructs contain-ing the RTBV promoter with different deletions in the dps region were also bombarded into 4-day old rice seedlings and promoter activities were quantified as number of blue-staining cells. Similar results as in the protoplast assay were obtained except that the com-plete removal of the dps (deletion+8 to +83) resulted in a much less severe reduction of activity (Figure 1) compared with the results in protoplasts.
Generation of transgenic plants
The different RTBV promoter/GUS cassettes or equiv-alent constructs with the CaMV 35S ups were each combined in one plasmid with a CaMV 35S promoter-driven aph4 gene; the latter gene confers hygromycin resistance (Waldron et al., 1985). Transgenic rice plants (cv. Taipei 309) were obtained after gene trans-fer by particle bombardment to calli derived from the scutellum of immature embryos. In total, 233 trans-genic plants were regenerated, 84 (36%) of which expressed GUS in the T0 generation. Of these, 41 independent lines were identified by Southern analy-sis. Between one and six transgene copies had been integrated in the plant genomes, as estimated from Southern analysis (a representative blot is shown in Figure 2). GUS activity was analysed in the T0 plants. As is usually the case in transformation exper-iments, GUS activities of independent transformants containing the same expression cassette sometimes varied widely. However, RNA analysis revealed that all plants with a comparatively low GUS activity produced additional, unexpected RNAs (not shown). Since such RNAs are probably indicative of either re-arrangement of the transgene or post-transcriptional gene silencing, the corresponding plants were ex-cluded from further analysis and will be described elsewhere. After elimination of these plants, GUS ex-pression levels of a given construct were quite uniform between independent lines. For each construct two to four lines were chosen for a more detailed analysis in the T1generation.
Figure 3. Histological GUS staining showing the activities of the RTBV (A, C, D, G, H, L–P, V, W) and the CaMV 35S (B, E, F, I, K, Q–U) promoter, combined with the RTBV downstream promoter sequences, in transgenic rice plants. A, B. Cross sections of 6-day old seedlings at the base; 160×. C, E. Cross sections of the blade of leaf 2 of 6-day old seedlings, showing large vascular bundles; 400×. D, F. Cross sections of the sheath of leaf 2 of 4-day old seedlings, showing large vascular bundles; 400×. G, I. Cross sections of the blade of leaf 3 of 8- or 16-day old seedlings; 160×. H, K. Cross sections of the midrib of a leaf blade of 60-day old plants, showing large vascular bundles; 400×. L, Q. Tips of primary roots of 4-day old seedlings; 160×. M, R. Anthers and pistils of flowering plants. N, S. Pollen of flowering plants. O, T. Cross sections of mature T2 seeds. P, U. Primarily transformed callus after 30 min in GUS staining solution. V. Cross section of 6-day old seedling at the base of a pHRintG-218 transformed plant; 400×. W. Cross sections of the flag leaf of flowering plants: top: pHRintG18-83; bottom: pHRintG-680. vb, vascular bundles; pa, sheath parenchym; ep, epidermis cells; mo, motor cells; gu, guard cells; pbs, parenchymal bundle sheath; mbs, mestome bundle sheath; xy, xylem cells; ph, phloem cells; me, mesophyll cells; rc, root cap; em, embryo; en, endosperm.
Tissue-specific activity of the full-length RTBV promoter in transgenic rice
So far, RTBV promoter analyses focused on up-stream sequences and promoter activity has been found mainly in phloem tissue (Bhattacharyya-Pakrasi
et al., 1993; Yin and Beachy, 1995; Yin et al., 1997b).
In the presence of the dps, the full-length RTBV pro-moter shows strong activity in all cells of the vascular bundle, including xylem parenchyma, mestome and parenchymal bundle sheath cells, and in epidermal cells, including differentiated cells like guard cells and motor cells (Figure 3A, C, D, V). Activity is also clearly detectable in parenchyma cells of the leaf sheath (Figure 3A, D) and, albeit more weakly, in the mesophyll cells of the leaf blade (Figure 3G). Pro-moter activity is strongest in young tissues and drops gradually with the age of a leaf, persisting longest in the vascular bundles (Figure 3G, H). In the root, most GUS activity can be detected in the vascular bundle and in the root cap as judged from staining of whole roots from young seedlings (Figure 3L). In the spikelet, low GUS activity is detected in the anthers (Figure 3M) and in pollen (Figure 3N). In the seed, promoter activity is detectable in the endosperm and the embryo (Figure 3O). The promoter is also highly active in undifferentiated callus tissue (Figure 3P).
The activity of the RTBV ups was compared to that of the corresponding CaMV ups (Figure 3). The activity of the CaMV 35S promoter in rice plants has been described either as predominantly vascular (Terado and Shimamoto, 1990) or as more or less ubiquitous and constitutive (Battraw and Hall, 1990). In the presence of the RTBV dps, the CaMV promoter was active in almost all rice tissues and cell types. If rapidity and intensity of the histological GUS staining is taken as a measure of promoter activity, the CaMV 35S ups confers lower activity than the RTBV ups in the vascular bundles but higher in the mesophyll, re-sulting in similar overall GUS activity in extracts from transgenic plants (Table 1). In most cells, activities
of RTBV and CaMV ups are similar but not identical (Figure 3D, F, M, R; N, S; O, T; P, U). The activity of the CaMV ups seems to be more stable in the course of plant development and can also be detected in most older leaves (Figure 3I, K), whereas the activity of the RTBV promoter is reduced to phloem cells or is no longer detectable (Figure 3G, H). In roots, the RTBV promoter is mainly active in the vascular tissue and the root cap (Figure 3L), whereas the CaMV 35S ups con-fers similar activity in all the tissues (Figure 3Q). The differential activities of the two promoters in the dif-ferent tissues show that the specificity of GUS staining is not due to experimental artefacts like preferential uptake of staining solution or specific inhibition of GUS enzyme activity in certain cells. The staining of single cells also confirms that the staining patterns reflect expression patterns and are not influenced sig-nificantly by diffusion of enzymes or products under the staining conditions used (see e.g. Figure 3V).
Deletions in the RTBV promoter upstream of the transcription start site
Deletion of DNA sequences upstream of −218 did not result in major changes of apparent gene expres-sion or specificity (Figure 4B). However, as shown below, GUS expression does not necessarily reflect the complete transcriptional activity of the different promoters.
Further deletion up to position −101 or −54 strongly reduced expression in the vascular bundle whereas expression in the epidermis remained un-changed (Figure 4C, D). GUS expression was found exclusively in epidermal cells in four out of eleven lines (36%) in constructs deleted to position−101 and in five out of eight lines (63%) in constructs deleted to position−54. The remainder of the lines showed some GUS activity in and around the vascular bundle or in the parenchymal cells of the leaf sheaths, but did not have the clearly defined expression pattern of the ‘full-length’ promoter (Figure 4E). It is likely that
Figure 4. Histological GUS staining showing the activity of the RTBV promoter, either ‘full-length’ (pHRintG-680) or with different deletions in up- or downstream sequences in transgenic rice plants. Fluorometrically determined GUS activities measured in parallel with the same tissue are given. A. RTBV ‘full-length’ promoter. B. RTBV promoter with deletion of sequences upstream of−218. C. RTBV promoter with deletion upstream of−101. D. RTBV promoter with deletion upstream of −54. E. RTBV promoter with deletion upstream of −101. Unusual expression type. F. RTBV promoter with deletion in dps (18-32). G. RTBV promoter with deletion in dps (150-83). H. RTBV promoter with deletion in dps (18-83). vb, vascular bundles; ep, epidermis cells, mo, motor cells.
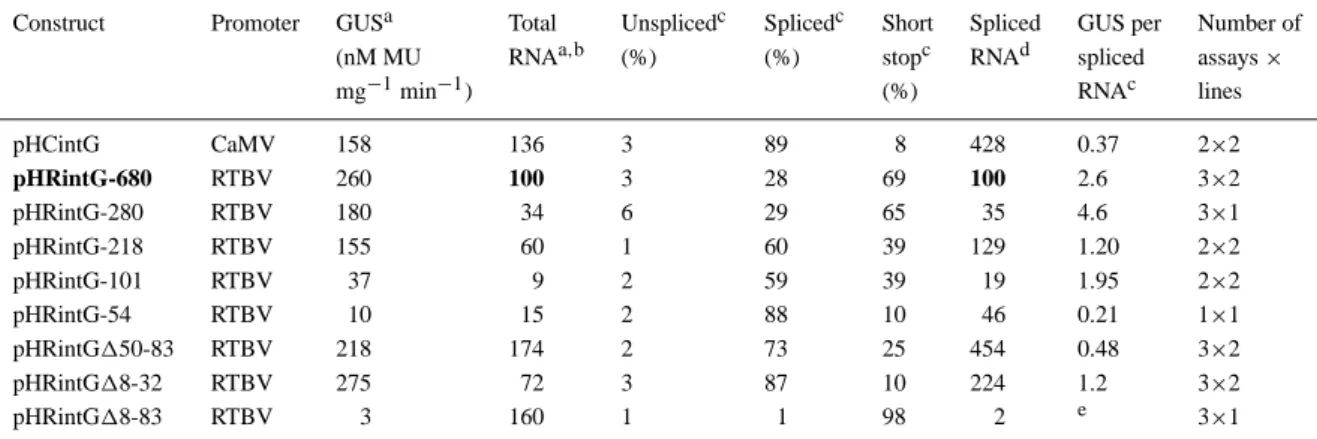
Table 1. Quantitative correlation between GUS expression and RNA products.
Construct Promoter GUSa Total Unsplicedc Splicedc Short Spliced GUS per Number of (nM MU RNAa,b (%) (%) stopc RNAd spliced assays×
mg−1min−1) (%) RNAc lines
pHCintG CaMV 158 136 3 89 8 428 0.37 2×2 pHRintG-680 RTBV 260 100 3 28 69 100 2.6 3×2 pHRintG-280 RTBV 180 34 6 29 65 35 4.6 3×1 pHRintG-218 RTBV 155 60 1 60 39 129 1.20 2×2 pHRintG-101 RTBV 37 9 2 59 39 19 1.95 2×2 pHRintG-54 RTBV 10 15 2 88 10 46 0.21 1×1 pHRintG150-83 RTBV 218 174 2 73 25 454 0.48 3×2 pHRintG18-32 RTBV 275 72 3 87 10 224 1.2 3×2 pHRintG18-83 RTBV 3 160 1 1 98 2 e 3×1
aAbsolute values for GUS expression or RNA production for indendent lines deviated by about± 30% from the indicated average. bTotal RNA is the sum of detected unspliced, spliced and short-stop RNA and is given in arbitrary units relative to that of the full-length RTBV promoter construct (pHRintG-680).
cThe proportions of the different RNAs and the GUS/mRNA correlation factor varied by±10% of the indicated average. dAmount of spliced RNA relative to pHRintG-680.
eNot calculated because the measured values for spliced RNA and GUS are too low to be determined with accuracy.
gene expression in the vascular bundles in these lines is due to a weak regulator element that is present in the remaining promoter fragment.
A protein binding site between−101 and −164
The deletion analysis of upstream promoter elements suggests that a sequence element that confers efficient gene expression in vascular tissue is located between
−218 and −101. In a previous analysis by Yin and
Beachy (1995), such an element was postulated to re-side between−164 and +45. Protein binding studies suggested that sequence elements from −53 to −39 and−3 to +8 are major determinants of tissue speci-ficity and promoter strength (Yin and Beachy, 1995; Yin et al., 1997a). Later a protein binding element important for vascular expression was also localized in the−164 to −101 region (Yin et al., 1997b). We have independently tested protein extracts from the nuclei of rice seedlings or cell suspension cells for protein binding activity to the−163 to −100 region and also found strong band shifts with both extracts (Figure 5 and data not shown). The exact pattern varied between different extracts but protein binding always led to the appearance of two shifted major bands, indicative of
binding of two different (forms of) proteins or of for-mation of a multiprotein complex. The binding was sequence-specific. Only a DNA fragment covering the promoter region from−1 to −100 competed slightly for both binding complexes whereas other oligonu-cleotides from outside of the binding region did not influence protein binding efficiency (Figure 5B). In the previous work (Yin et al., 1997b) a GATA motif was suggested to be responsible for protein binding. Our competition experiments with smaller portions from the binding region showed also that oligonucleotides containing the GATA motif (−125 to −150) would compete in the assay, albeit more weakly than the longer−125 to −163 fragment, but an oligonucleotide covering−140 to −163, lacking the GATA sequence, competed as well (Figure 5). This suggests that the GATA sequence may not be involved directly in pro-tein binding but rather the region between−140 and
−150 or a motif present in both subfragments.
Pre-liminary evidence indicates that an AGAAG motif, which occurs twice in this region and also twice fur-ther upstream in the promoter, is important for binding (not shown). Flanking sequences may also be required,
Figure 5. Gel shift assays with RTBV promoter fragment−101 to−163. A. Position of DNA fragments used for competition is shown schematically. The sequence of the binding region F1 is given with the coordinates (relative to the transcription start site) of subfragments used to determine the binding site. A GATA motif as defined in by Yin et al. (1997b) is underlined, two AGAAG mo-tives are double-underlined. B. Protein from nuclei of rice seedlings was bound to a synthetic, labelled, double-stranded oligonucleotide (probe) representing the RTBV promoter region from −100 to
−163. Specificity of binding was ascertained by competition with
50- to 1000-fold molar excess of other RTBV DNA fragments. Experiments in the two parts were performed with independently isolated protein extracts.
since a fragment from−137 to −153 did not compete for binding in these assays.
Deletions downstream of the transcription start site
The expression pattern of the RTBV promoter in transgenic rice plants described here differs from the previously reported one (Bhattacharyya-Pakrasi et al., 1993; Yin and Beachy, 1995) which was obtained with constructs lacking at least large parts of the down-stream promoter regions. To investigate whether and how the downstream region is responsible for the ob-served differences, we analysed three deletion mutants in transgenic rice plants.
In protoplasts, the dps had been dissected in two regions: one between +50 and +83 containing a position-independent enhancer element, and an ele-ment that is inactivated by a deletion between+8 and
+32 containing a position-dependent element (Chen et al., 1996). A complete deletion of the+8 to +83
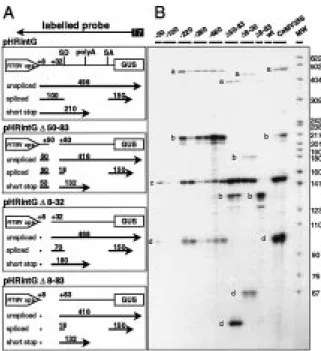
Figure 6. Analysis of RNA from transgenic rice plants by RNase A/T1 protection. A. The ‘full-length’ RTBV promoter (pHRintG-680) and constructs with different deletions in the dps are shown schematically. Position and extent of the anti-sense probe created by T7 RNA polymerase is indicated at the top. Expected RNAs with the sizes of the protected fragments are shown below each construct. B. Results of a RNase protection assay with RNAs from different transgenic plants transformed with the different dele-tion constructs. The posidele-tions of molecular weight markers are given with the fragment size in nucleotides. The relevant protected frag-ments are labelled at the left side: a, unspliced RNA; b, short-stop RNA; c, fragments derived from the 50end; d, spliced RNA, 30 exon-derived.
Figure 7. Organization of elements influencing expression from the RTBV promoter. The locations of regions containing different el-ements with apparent activity in transcription control that can be deduced from the presented work are indicated below a schematic presentation of the transcription unit; stippled lines: supposed activ-ities. Sequence elements defined by others (Yin and Beachy, 1995; Lin et al., 1997a, 1997b) are indicated above. Positions are given relative to the transcription start site. GAGA-like elements are indi-cated by∗; SD, splice donor; SA, splice acceptor; lppc+, regions stimulating assembly of low processivity polymerase complexes.
region led to a strong reduction of GUS activity in transgenic plants (pHRintG18-83; Figure 4H); ex-pression was very low in the blade of the youngest leaf. GUS activity was detected in the vascular tis-sue of the leaf sheath and the guard cells. Protein extracts from these plants contain only about 2 to 7% of the GUS activity of typical plants transformed with the full-length promoter construct (Table 1, Figure 4). However, in older tissue, such as the blade of the flag leaf at flowering stage, clear phloem-specific expres-sion was detected with pHRintG18-83, whereas with the ‘full-length’ promoter construct (pHRintG-680), no expression was detected (Figure 3W). The expres-sion pattern obtained with the +8 to +83 promoter deletion construct resembles that described by Yin and Beachy (1995) for a promoter fragment ending at po-sition +46. This suggests that the dps does, in fact, contribute to expression strength in planta and allows visualization of promoter activity in cells outside the phloem. However, in contrast to the effects described for protoplasts (Chen et al., 1996), removal of either one of the two subregions of the dps did not result in a drastic decrease of GUS activity in transgenic plants. In some staining experiments, an increase of GUS activity without change of the cell specificity was ob-served (18-32, Figure 4F; 150-83, Figure 4G). This is reflected in the faster staining in histochemical GUS assays and in the increase of GUS activity in protein extracts (compared to the full-length promoter; Fig-ure 4). These latter findings indicate that the region downstream of the transcription start site may also contain elements that can negatively influence expres-sion from the reporter constructs and that the effects of this region depend on the assay system.
Upstream and downstream sequences influence RNA types and levels in transgenic plants
Sequences downstream of the transcription start site can influence expression at many different levels, par-ticularly in a complex situation like that of the RTBV pregenomic RNA, where signals for transcription ini-tiation, transcription termination, splicing, translation and possibly other processes are located within this re-gion (Rothnie et al., 1994). Based on our earlier work in protoplasts (Fütterer et al., 1994), we expected both spliced and unspliced RNA to be generated from the transformed expression constructs. While this work was in progress, it became clear that an RNA prod-uct resulting from transcription termination and/or polyadenylation at the promoter proximal
polyadeny-lation signal in the intron might also be generated (Fütterer et al., 1997). This was initially unexpected since for CaMV it had been shown that a polyadenyla-tion signal in this proximity to the promoter is almost inactive (Sanfaçon and Hohn, 1990). The RNA gener-ated by the use of the promoter-proximal polyadeny-lation signal has been termed short-stop RNA and has counterparts in some animal retroviruses such as hu-man immunodeficiency virus type 1 (HIV-1) (Scott and Imperiale, 1997).
Spliced, unspliced, and short-stop RNA could be detected by RNase protection assays in the total RNA fraction from all GUS-expressing transgenic plant lines (Figure 6).
RNAs produced from the CaMV 35S promoter differ from those from the RTBV promoter by the ad-dition of a few nucleotides at the very 50 end. It is possible that this difference causes some alterations in RNA stability. Since deletions in the dps alter the respective transcripts and possibly the stability of these transcripts, expression levels for dps deletion constructs may be influenced by post-transcriptional processes. In contrast, RNAs produced from ups vari-ants of the RTBV promoter are identical and their levels thus truly reflect the transcriptional activity.
Splicing in transgenic plants proved to be more efficient than expected from our previous work with transfected protoplasts (Fütterer et al., 1994). In all transgenic plants only very small amounts of un-spliced RNA was detected (Figure 6, Table 1). Spliced RNA appears as two protected fragments: one of 150 nucleotides in length, representing the second exon which is identical for all constructs, and one of 100 nucleotides or less, representing the first exon, which varies for the different dps deletion constructs (Fig-ure 6). For the full-length RTBV or CaMV promoters, upstream deletion variants of the RTBV promoter, and for the downstream deletion variant 18-32, both ex-ons were present in equimolar amounts. For the dps deletion 18-83, the first exon is too short to be de-tectable and for dps deletion 150-83, the protected fragment representing the RNA 50end can be derived from all the RTBV promoter-derived RNAs since its size is determined by the deletion endpoint and not by RNA processing.
For different constructs, the amount of spliced RNA represented a variable proportion of the total transgene-derived RNA. In the lines containing the full-length RTBV promoter or the −280 upstream deletion variant, 30% of the total RNA was spliced RNA and around 70% was short-stop RNA (Table 1).
When more of the upstream promoter sequence was deleted, the proportion of spliced RNA increased to 60% for the−218 and −101 and to 88% for the −54 deletion mutants. Similar high proportions of spliced RNA are produced from the CaMV 35S promoter and are observed for the two partial deletion variants of the dps. The 18-83 variant produced almost exclusively short-stop RNA (Table 1).
Since all the upstream deletion variants of the RTBV promoter produce identical transcripts and the CaMV 35S promoter at least a very similar one, these latter findings show that the generation of short-stop RNA is linked to transcriptional features and not only caused by sequences in the transcript acting in a post-transcriptional processing step. Sequence ele-ments between−280 and −218 and between −101 and−54 influence the ratio between spliced and short-stop RNA; the CaMV 35S promoter seems to lack features that lead to the synthesis of short-stop RNA.
Based on total RNA levels, the CaMV 35S pro-moter is slightly stronger than the full-length RTBV promoter; similarly the 18-32 and 150-83 variants may be stronger than the full-length promoter. The upstream deletion to−280 reduces RNA levels about three-fold (Table 1), suggesting the presence of an enhancer element in this region.
A comparison of the levels of spliced RNA and GUS activity (determined in the same batch of rice seedlings) suggests that GUS expression does not nec-essarily reflect the transcriptional activity of a given promoter but that other, probably post-transcriptional, processes can influence the amount of gene products. In general, less GUS per RNA is produced in plants with relatively high mRNA levels, for example plants containing GUS transgenes with either the CaMV pro-moter or the RTBV propro-moter dps deletion variants
18-32 and 150-83 (Table 1). In order to correlate
GUS activity and RNA levels, the data from plants transformed with the−54 and −101 deletion variants must be treated separately since GUS is expressed in these plants only in a subset of cells and thus total RNA levels translate into different RNA concentra-tions per cell. For these two deletion variants, RNA usage seems to be also significantly more efficient in lines with a lower RNA level.
Discussion
The dps expands the tissue specificity of the RTBV promoter
In previous studies, RTBV promoter activity was re-ported mainly in the phloem of transgenic plants (Bhattacharyya-Pakrasi et al., 1993; Matsumara and Tabayashi, 1995; Yin and Beachy, 1995; Yin et al., 1997a, 1997b). In these studies the RTBV promoter used contained at most 45 bp downstream of the tran-scription start site. In a rice protoplast system, RTBV promoter activity depended on at least two sequence elements located downstream of the transcription start site (Chen et al., 1994, 1996). In the present analy-sis, 680 bp of upstream promoter sequences were supplemented with 278 bp of downstream promoter sequences (dps), containing these two elements and a shortened version of the RTBV intron. The RTBV promoter including the dps showed activity in a wider range of cells than previously observed in the absence of the dps. We found that expression was not restricted exclusively to phloem cells, but was also detected in other cells of the vascular bundles, in the epidermis, in the parenchyma cells of the leaf sheath and, albeit weakly, in leaf mesophyll cells. Promoter activity was detected mainly in young tissues and was lost grad-ually with increasing age. The overall effect of the dps may be a strong general enhancement of expres-sion, which is reflected in higher GUS levels in plant extracts and a much more rapid staining of individ-ual cells than obtained with the 18-83 dps variant. This is in line with our expectations from the analyses performed in transfected rice protoplasts (Chen et al., 1994, 1996). The dps may also contain additional specificity elements for expression in the epidermis and the sheath parenchyma. The dps effects were ap-parent in our study with the 18-83 variant, which showed a very similar expression pattern (restricted to the vascular tissue) as a previously described construct including only the first 45 transcribed nucleotides (Yin and Beachy, 1995). Expression from the 18-83 con-struct, albeit low, persisted in plants much longer than that from the other constructs (Figure 3W) suggest-ing that also tissue- or development-specific, negative regulators may be involved in expression control or that the relatively high expression levels with the full-length promoters lead to consistent silencing of the transgenes later in development.
Partial deletions of the dps did not lead to a change in tissue specificity or expression strength,
suggest-ing that the elements involved are either redundant or present in the undeleted region between+32 and +50. Recently a rice transcriptional activator interact-ing with RTBV promoter elements located between nucleotides −53 and −39 was reported (RF2a); an-tibodies raised against RF2a showed the presence of this activator protein in most cell types in the vas-cular bundles, in parenchyma and in epidermal cells (Yin et al. 1997a). This localization correlates exactly with the expression pattern of the RTBV promoter supplemented with the dps as described here.
Upstream specificity elements for expression in the vascular bundle
Promoter sequences upstream of−218 were dispens-able for the reported activity. However, a deletion to
−101 abolished expression in the vascular bundle in
many transgenic lines, while strong expression in the epidermis remained. This effect was even stronger with a promoter deleted to −54. Combining these data with the promoter analysis by Yin and Beachy (1995) suggests that no essential promoter elements are located upstream of −164 and that an element very important for expression in the vascular tissue is located between −163 and −101. Previously, the phloem specificity element was tentatively localized to two regions closer to the transcription start site (BoxII from−32 to −66 and ASL Box from −66 to
−103) because binding of nuclear proteins (including
the bZIP protein RF2a) could be detected at these re-gions (Yin and Beachy, 1995; Yin et al., 1997a). Only recently, a protein binding site in a GATA-like motif has been identified at a position around −140 (Yin
et al., 1997b). Individual mutations of these motifs led
to strong reduction of protein binding and slight re-duction of phloem-specific expression. A combination of any two of these mutations led to strong reduc-tion, and a combination of all three mutations led to a complete abolishment of phloem-specific expression (Yin et al., 1997b). We also found protein binding to a DNA fragment from −163 to −101 with extracts prepared from rice nuclei. A binding assay resulted in two differently shifted DNA fragments, suggesting the binding of two proteins. Our competition experi-ments suggest that binding is determined by sequences outside the GATA sequence (Figure 5) either between
−140 and −150 or, more likely, by two redundant
motifs. The sequence AGAAG, which is also indicated by an ongoing more detailed mutagenesis analysis (X. He and T. Hohn, unpublished observations), may
rep-resent such a motif. The published data about protein binding to this promoter region (Yin et al., 1997b) are compatible with AGAAG as the actual binding site since this sequence was altered in the attempt to inac-tivate the GATA motif. The work of Yin et al. (1997b) suggests that the three motifs (GATA, ASL and BoxII) equally contribute to phloem-specific expression. Our data show that for a promoter including the dps, dele-tion of the−101 to −163 region has a more drastic effect for vascular tissue-specific expression than ad-ditional deletion of the ASL box and part of BoxII. The−101 to −163 region may itself act as a speci-ficity element or as a quantitative element modulating specificity element(s) within −101 and +8 or even further downstream. Interestingly, we found that the protein binding to the−101 to −164 region is weakly competed by the region from−100 to −1.
Promoter strength and potential usefulness
The promoter constructs described here might be use-ful for expression of transgenes in rice. The overall strength of the ‘full-length’ RTBV promoter is com-parable to a CaMV 35S promoter, which itself seems to be enhanced in the context of the RTBV dps and the intron. Soluble extracts from transgenic plants con-tained an average GUS activity of about 200 nM MU per minute per mg protein for both promoters. For some deletion variants of the RTBV promoter up to 530 nM MU per minute per mg protein were obtained in some experiments. This compares favourably to val-ues obtained with other promoter-GUS constructs in transgenic rice and analysed with comparable proto-cols (Battraw and Hall, 1990; Cornejo et al., 1993; Terada and Shimamoto 1990; Verdaguer et al., 1996; Xu et al., 1993, 1995; Yin and Beachy, 1995).
It is likely that the presence of an intron con-tributes to the strength of expression. Both the RTBV and the CaMV promoter constructs are much more active in a seedling bombardment assay when the in-tron is included (our unpublished observation), and for the CaMV promoter a direct comparison of an intron-containing expression construct and a cDNA derivative showed a difference of up to 50-fold in transfected protoplasts (Fütterer et al., 1994). Simi-lar effects have been described for a number of other promoter-reporter cassettes, particularly in monocots (see Introduction). In our hands, the magnitude of this effect is very variable (our unpublished observations). The value of the RTBV promoter as a tool for gene ex-pression in rice may reside in its preferential activity in
the vascular bundle and the epidermis in young leaves. It also may be useful to express gene products that can interfere with RTBV infection, which can cause severe yield losses (Hibino, 1996).
Correlation between GUS protein and mRNA levels
Simultaneous determination of GUS mRNA and en-zyme levels revealed that not only differences in overall transcriptional activity are responsible for the different GUS levels. More GUS protein was synthe-sized per mRNA molecule when levels of RNA were low, such as with the full-length RTBV promoter, up-stream promoter deletions, or the 18-83 deletion. In plants that produced higher RNA levels, for example from the promoter downstream deletions 8–32 and 50– 83 or the CaMV 35S promoter, apparently 2–3-fold less GUS protein was produced per available mRNA. This might be due to differences in mRNA transport or translation, which could be caused by the sequence differences due to deletions in the dps region or due to a few additional 50 nucleotides from the CaMV 35S transcription initiation site. It also appears possible that a post-transcriptional process might become sat-urated. In some experiments (e.g. Figure 3), the plant lines showing this inefficient RNA usage exhibited a higher GUS activity than measured in the particu-lar experiments (summarized in Table 1) where also the RNA levels were determined. We cannot exclude the possibility that growth conditions or differences between individual seedlings influence mRNA matu-ration or usage. Discrepancies between RNA and pro-tein production have been observed previously with a number of different transgenic plants displaying fea-tures of post-transcriptional gene silencing (discussed in Depicker and Van Montague, 1997).
Short-stop RNA and transcription processivity
A striking feature of most of our plant lines is the pro-duction of short-stop RNA. This RNA might be gen-erated by 30 end processing of full-length pre-mRNA in competition with splicing or by co-transcriptional 30 end processing at the promoter proximal polyadenyla-tion signal. In the first case, the ratio between spliced RNA and short-stop RNA would depend on post-transcriptional competition of the respective signals for processing factors; the ratio would thus depend on the RNA sequence and not on the promoter. However, our results show that the ratio is influenced drastically by the untranscribed promoter sequence: while short-stop RNA constitutes about 70% of the steady-state
RNA from the full-length RTBV promoter and from the−280 deletion derivative, this value drops to 10– 40% with variants with larger upstream deletions and to less than 10% with the CaMV promoter. The best explanation for these findings is that the termination or 30end processing activity is a property of the tran-scription complex which associates with the respective initiator regions and that these complexes are different for the different promoters.
Our data obtained with the full-length RTBV pro-moter are compatible with the association of two dif-ferent polymerase complexes: one with a high proces-sivity that generates long primary transcripts that ma-ture mainly by splicing, and one with a low processiv-ity that generates only short transcripts. Gene-specific control of transcription processivity is a feature of many genes in pro- and eukaryotes (Gu and Reines, 1995; Krumm et al., 1995; Rasmussen and Lis, 1995; Reeder and Hawley, 1996; Wang et al., 1997). For instance, the promoter of HIV-1 produces short-stop RNA (Scott and Imperiale, 1997), requires activation to produce long instead of short transcripts (Jones, 1997; Jones and Peterlin, 1994; Keen et al., 1997) and may associate with polymerase complexes of different processivity (Lu et al., 1993). The short transcripts initially produced from such genes are normally un-stable and difficult to detect. In RTBV, the presence of a proper polyadenylation signal may enhance pausing of low-processivity complexes and also stabilize the ensuing short transcripts. In the better studied cases of HIV-1 and Drosophila hsp genes, GAGA or comple-mentary TCTC sequences and interacting factors are crucial to recruite low-processivity complexes (Jones and Peterlin, 1994; Shopland et al., 1995; Wilkins and Lis, 1997). GAGA-binding proteins have been identified in plants (Frustaci et al., 1995). The RTBV dps contains four copies of this sequence motif (Fig-ure 7). In the dps deletion variant and in the −54 mutant compared to the−101 mutant, the number of these motifs is reduced (Figure 7) and in the respective plants, the proportion of short-stop RNA drops and the amount of spliced RNA increases. The increase could be due to increased binding of high-processivity complexes either because of lack of competition by the low-processivity complex for binding to the initiator region or because of the absence of a negative ele-ment. The RTBV promoter region upstream of−280 influences production of short-stop RNA and spliced RNA equally. In contrast, the region between−280 and −218 contains an element that specifically af-fects short-stop RNA production since its deletion
leads to reduced short-stop RNA levels. Concomi-tantly, an increase in spliced RNA (compared to the
−280 deletion) is observed similarly as for the dps
mutations.
Differences among assay systems
In this and previous studies a number of sequence regions with effect on RTBV promoter activity have been identified (Figure 7). Many have been defined only roughly and probably more exist. Some of those described here are not apparent if GUS expression is taken as the only indication of transcriptional activ-ity. Their presence is only revealed when RNA levels are analysed directly. The activity of the elements may also vary in different assy systems. The 18-32 and 150-83 mutants express GUS as well as the full-length promoter in plants while they express less in protoplasts. The dps region from+8 to +83 was of much lower importance in the seedling bombardment assay than either in protoplasts or transgenic plants. The CaMV 35S promoter is about 30 times more ac-tive than the RTBV promoter in protoplasts but both have a similar activity in plants. The reasons for these differences remain obscure. All this probably reflects the complexity of the transcription unit and the many possible levels of regulation.
For instance, DNA topology can have dramatic ef-fects on promoter activity or specificity (Frisch et al., 1995). One function of the GAGA factor, or of GAGA-dependent assembly of low-processivity poly-merase complexes, is the alteration of nucleosome association with promoter regions (Shopland et al., 1995; Wal et al., 1995; Wilkins and Lis, 1997). Such processes might well be different on linear and circular templates and nucleosome association with plasmid DNA in transient expression experiments may be very different from that of low-copy-number integrated genes.
Analysis of a plant viral promoter outside its vi-ral context has been most extensively performed with the CaMV 35S promoter (reviewed by Lam, 1994). Several crucial elements in the CaMV 35S promoter are dispensible for virus viability (Turner et al., 1996), suggesting that the control within the virus context can be different again from what can be concluded from all isolated promoter studies. Nevertheless, such studies remain of great value for our general knowledge about transcription control in plants and for the generation of efficiently expressed transgenes.
Acknowledgements
We thank for the help of Sandra Corsten, Na-nia Schärer-Hernandez, and Yakandawala Nandadeva with protection assays, Christoph Sautter for help with the microscope and Katrin Konya and Sabine Klarer for maintenance of plants. We also thank He-len Rothnie for critical comments on the manuscript. We gratefully acknowledge financial support from the Swiss National Foundation of Sciences.
References
Bao, Y., Hull, R. 1993. Mapping the 50-terminus of rice tungro bacilliform viral genomic RNA. Virology 197: 445–448. Battraw, M. and Hall, T. 1990. Histochemical analysis of CaMV
promoter-β-glucuronidase gene expression in transgenic rice plants. Plant Mol. Biol. 15: 527–538.
Bhattacharyya-Pakrasi, M., Peng, J., Elmer, J.S., Laco, G., Shen, P., Kaniewska, M.B., Kononowizc, H., Wen, F., Hodges, T.K. and Beachy, R.N. 1993. Specificity of a promoter from the rice tungro bacilliform virus for expression in phloem tissues. Plant J. 4: 71–79.
Bovy, A., van den Berg, C., de Vrieze, G., Thompson, W.F., Weis-beek, P. and Smeekens, S. 1995. Light-regulated expression of the Arabidopsis thaliana ferredoxin gene requires sequences up-stream and downup-stream of the transcription initiation site. Plant Mol. Biol. 27: 27–39.
Burkhardt, P.K., Beyer, P., Wünn, J., Klöti, A., Armstrong, G.A., Schledz, M., von Lintig, J. and Potrykus, I. 1997. Transgenic rice (Oryza sativa) endosperm expressing daffodil (Narcissus pseudonarcissus) phytoene synthase accumulates phytoene, a key intermediate of provitamin A biosynthesis. Plant J. 11: 1071–1078.
Callis, J., Fromm, M. and Walbot, V. 1987. Introns increase gene expression in cultured maize cells. Genes Dev. 1: 1183–1200. Caspar, T. and Quail, P.H. 1993. Promoter and leader regions
in-volved in expression of the Arabidopsis ferredoxin A gene. Plant J. 3: 161–174.
Chen, G., Müller, M., Potrykus, I., Hohn, T. and Fütterer, J. 1994. Rice tungro bacilliform virus: transcription and translation in protoplasts. Virology 204: 91–100.
Chen, G., Rothnie, H.M., He, X., Hohn, T. and Fütterer, J. 1996. Efficient transcription from the rice tungro bacilliform virus pro-moter requires elements downstream of the transcription start site. J. Virol. 70: 8411–8421.
Chomczynski, P. and Sacchi, N. 1987. Single step method of RNA isolation by acid guanidinium thiocyanate-phenol-chloroform extraction. Anal. Biochem. 162: 156–159.
Christensen, A.H., Sharrock, R.A. and Quail, P.H. 1992. Maize polyubiquitin genes: structure, thermal perturbation of expres-sion and transcript splicing, and promoter activity following transfer to protoplasts by electroporation. Plant Mol. Biol. 18: 675–689.
Clancy, M., Vasil, V., Hannah, L.C. and Vasil, I.K. 1994. Maize shrunken-1 intron and exon regions increase gene expression in maize protoplasts. Plant Sci. 98: 151–161.
Cornejo, M.J., Luth, D., Blankenship, K.M., Anderson, O.D. and Blechl, A.E. 1993. Activity of a maize polyubiquitin promoter in transgenic rice. Plant Mol. Biol. 23: 567–581.
Curie, C., Axelos, M., Bardet, C., Atanassova, R., Chaubet, N. and Lescure, B. 1993. Modular organization and developmental activity of an Arabidopsis thaliana EF-1α gene promoter. Mol. Gen. Genet. 238: 428–436.
Curie, C. and McCormick, S. 1997. A strong inhibitor of gene expression in the 50untranslated region of the pollen-specific LAT59 gene of tomato. Plant Cell 9: 2025–2036.
De Almeida, E.R.P., Gossele, V., Muller, C.G., Dockx, J., Rey-naerts, A., Botterman, J., Krebbers, E. and Timko, M.P. 1989. Transgenic expression of two marker genes under the control of an Arabidopsis rbcs promoter: sequences encoding the Rubisco transit peptide increase expression levels. Mol. Gen. Genet. 218: 78–86.
Dean, C., Favreau, M., Bond-Nutter, D., Bedbrook, D. and Duns-muir, P. 1989. Sequences downstream of translation start regulate quantitative expression of two petunia rbcs genes. Plant Cell 1: 201–208.
Depicker, A. and Van Montagu, M. 1997. Post-transcriptional gene silencing in plants. Curr. Opin. Cell. Biol. 9: 373–382. Donath, M., Mendel, R., Cerff, R. and Martin, W. 1995.
Intron-dependent transient expression of the maize GapA1 gene. Plant Mol. Biol. 28: 667–676.
Douglas, C.J., Hauffe, K.D., Ites-Morales, M.-E., Ellard, M., Paszkowski, U., Hahlbrock, K. and Dangl, J.L. 1991. Exonic sequences are required for elicitor and light activation of a plant defense gene, but promoter sequences are sufficient for tissue specific expression. EMBO J. 10: 1767–1775.
Frisch, D.A., van der Geest, A.H.M., Dias, K. and Hall, T.C. 1995. Chromosomal integration is required for spatial regulation of expression from the β-phaseolin promoter. Plant J. 7: 503–512. Frustaci, J.M., Sangwan, I. and O’Brian, M.R. 1995. gsa1 is a
uni-versal tetrapyrrole synthesis gene in soybean and is regulated by a GAGA element. J. Biol. Chem. 270: 7387–7393.
Fu, H., Kim, S.Y. and Park, W.D. 1995. High-level tuber expression and sucrose inducibility of a potato Sus4 sucrose synthase gene require 50and 30flanking sequences and the leader intron. Plant Cell 7: 1387–1394.
Fütterer, J., Potrykus, I., Valles Brau, M.P., Dasgupta, I., Hull, R. and Hohn, T. 1984. Splicing in a plant pararetrovirus. Virology 198: 663–670.
Fütterer, J., Potrykus, I., Bao, Y., Li, L., Burns, T.M., Hull, R. and Hohn, T. 1996. Position-dependent ATT initiation during plant pararetrovirus rice tungro bacilliform virus translation. J. Virol. 70: 2999–3010.
Fütterer, J., Rothnie, H.M., Hohn, T. and Potrykus, I. 1997. Rice tungro bacilliform virus open reading frames II and III are trans-lated from polycistronic pregenomic RNA by leaky scanning. J. Virol. 71: 7984–7989.
Genschick, P., Marbach, M., Uzé, M., Feuerman, B., Plesse, B. and Fleck, J. 1994. Structure and promoter activity of a stress and developmentally regulated polyubiquitin-encoded gene of Nicotiana tabacum. Gene 148: 195–202.
Gidekel, M., Jimenez, B. and Herrera-Estrella, L. 1996. The first intron of the Arabidopsis thaliana gene coding for elongation factor 1β contains an enhancer-like element. Gene 170: 201–206. Gu, W. and Reines, D. 1995. Identification of a decay in tran-scription potential that results in elongation factor dependence of RNA polymerase II. J. Biol. Chem. 270: 11238–11244. Guilfoyle, T.J. 1997. The structure of plant gene promoters. Genet.
Engin. 19: 15–47.
Hay, J.M., Jones, M.C., Blackebrough, M.L., Dasgupta, I., Davies, J.W. and Hull, R. 1991. An analysis of the sequence of an infectious clone of rice tungro bacilliform virus, a plant pararetrovirus. Nucl. Acids Res. 19: 2615–2621.
Hibino, H. 1996. Biology and epidemiology of rice viruses. Annu. Rev. Phytopath. 34: 249–274.
Hohn, T., Corsten, S., Rieke, S., Müller, M. and Rothnie, H. 1996. Methylation of coding regions alone inhibits gene expression in protoplasts. Proc. Natl. Acad. Sci. USA 93: 8334–8339. Hull, R. 1996. Molecular biology of rice tungro viruses. Annu. Rev.
Phytopath. 34: 275–297.
Jefferson, R.A. 1987. Assaying chimeric genes in plants: the GUS gene fusion system. Plant Mol. Biol. Rep. 5: 387–405. Jones, K.A. 1997. Taking a new TAK on Tat transactivation. Genes
Dev. 11: 2593–2599.
Jones, K.A., Peterlin, B.M. 1994. Control of RNA initiation and elongation at the HIV-1 promoter. Annu. Rev. Biochem. 63: 717– 743.
Keen, N.J., Churcher, M.J. and Karn, J. 1997. Transfer of Tat and release of TAR RNA during the activation of the human im-munodeficiency virus type-1 transcription elongation complex. EMBO J. 16: 5260–5272.
Krumm, A., Hickey, L.B. and Groudine, M. 1995. Promoter-proximal pausing of RNA polymerase II defines a general rate-limiting step after transcription initiation. Genes Dev. 9: 559–572.
Kyozuka, J., Olive, M., Peacock, W.J., Dennis, E.S. and Shi-mamoto, K. 1994. Promoter elements required for the devel-opmental expression of the maize Adh1 gene in transgenic rice. Plant Cell 6: 799–810.
Lam, E. 1994. Analysis of tissue-specific elements in the CaMV 35S promoter. In: I. Nover (Ed.), Results and Problems in Cell Dif-ferentiation, Springer-Verlag, Berlin/Heidelberg, pp. 181–196. Larkin, J.C., Oppenheimer, D.G., Pollock, S. and Marks, M.D.
1993. Arabidopsis GLABROUS1 gene requires downstream se-quences for function. Plant Cell 5: 1739–1748.
Li, Y.-Z., M, H.-M., Zhan, J.-L., Wan, Z.-Y. and Hon, M.-M. 1995. Effects of the first intron of rice Waxy gene on the expression of foreign genes in rice and tobacco protoplasts. Plant Sci. 108: 181–190.
Lois, R., Dietrich, A. and Hahlbrock, K. 1989. A phenyalanine ammonia-lyase gene from parsley: structure, regulation and identification of elicitor and light responsive cis-acting elements. EMBO J. 8: 1641–1648.
Lu, X., Welsh, T.M. and Peterlin, B.M. 1993. The human immuno-deficiency virus type 1 long terminal repeat specifies two differ-ent transcription complexes, only one of which is regulated by Tat. J. Virol. 67: 1752–1760.
Luehrsen, K.R. and Walbot, V. 1991. Intron enhancement of gene expression and the splicing efficiency of introns in maize cells. Mol. Gen. Genet. 225: 81–93.
Maas, C., Laufs, J., Grant, S., Korfhage, C. and Werr, W. 1991. The combination of a novel stimulatory element in the first exon of the maize shrunken-1 gene with the following intron enhances reporter gene expression 1000-fold. Plant Mol. Biol. 16: 199– 207.
Mascarenhas, D., Mettler, I.J., Pierce, D.A. and Lowe, H.W. 1990. Intron mediated enhancement of heterologous gene expression in maize. Plant Mol. Biol. 15: 913–920.
Matsumura, T. and Tabayashi, N. 1995. Transformation of rice plants by plant reovirus genes. Semin. Virol. 6: 133–139. McElroy, D., Zhang, W. and Wu, R. 1990. Isolation of an efficient
Medberry, S.L. and Olszewski, N.E. 1993. Identification of cis-elements involved in commelina yellow mottle virus promoter activity. Plant J. 3: 619–626.
Mendel, R.R., Müller, B., Schulze, J., Kolesnikov, V. and Zelenin, A. 1989. Delivery of foreign genes to intact barley cells by high-velocity microprojectiles. Theor. Appl. Genet. 78: 31–34. Norris, S.R., Meyer, S.E. and Callis, J. 1993. The intron of
Ara-bidopsis thaliana polyubiquitin genes is conserved in location and is a quantitative determinant of chimeric gene expression. Plant Mol. Biol. 21: 895–906.
Oard, J.H., Paige, D. and Dvorak, J. 1989. Chimeric gene expression using maize intron in cultured cells of breadwheat. Plant Cell Rep. 8: 156–160.
Pierce, D.A., Mettler, I.J., Lachmansingh, A.R., Pomeroy, L.M., Weck, E.A. and Mascarenhas, D. 1987. Effect of 35S leader modifications on promoter activity. In: J.L. Key and L. McIntosh (Eds.), Plant Gene Systems and their Biology, UCLA Symposia on Molecular and Cell Biology, New series 62: 301–310. Qu, R., Bhattacharyya, M., Laco, G.S., de Kochko, A., Rao, S.,
Kaniewska, M.B., Elmer, S., Rochester, D.E., Smith, C.E. and Beachy, R.N. 1991. Characterization of the genome of rice tun-gro bacilliform virus, comparison with commelina yellow mottle virus and caulimoviruses. Virology 185: 354–364.
Rasmussen, E.B. and Lis, J.T. 1995. Short transcripts of the ternary complex provide insight into RNA polymerase II elongational pausing. J. Mol. Biol. 252: 522–535.
Rathus, C., Bower, R. and Birch, R.G. 1993. Effects of promoter, intron and enhancer elements on transient expression in sugar-cane and carrot protoplasts. Plant Mol. Biol. 23: 613–618. Reeder, T.C. and Hawley, D.K. 1996. Promoter proximal sequences
modulate RNA polymerase II elongation by a novel mechanism. Cell 87: 767–777.
Rose, A.B. and Last, R.L. 1997. Introns act post-transcriptionally to increase expression of the Arabidopsis thaliana tryptophan pathway gene PAT1. Plant J 11: 455–464.
Rothnie, H.M., Chapdelaine, Y. and Hohn, T. 1994. Pararetroviruses and retroviruses, a comparative review of viral structure and gene expression strategies. Adv. Virus Res. 44: 1–67.
Rothnie, H.M. 1996. Plant mRNA 30-end formation. Plant Mol. Biol. 32: 43–61.
Sanfaçon, H., Hohn, T. 1990. Proximity to the promoter inhibits recognition of cauliflower mosaic virus polyadenylation signal. Nature 346: 81–84.
Sanger, M., Daubert, S.D. and Goodman, R.M. 1990. Characteris-tics of a strong promoter from figwort mosaic virus: comparison with the analogous 35S promoter from cauliflower mosaic virus and the regulated mannopine synthase promoter. Plant Mol. Biol. 14: 433–443.
Scott, J.M. and Imperiale, M.J. 1997. Promoter-proximal poly(A) sites are processed efficiently, but the RNA products are unstable in the nucleus. Mol. Cell. Biol. 17: 2127–2135.
Shopland, L.S., Hirayoshi, K., Fernandes, M. and Lis, J.T. 1995. HSF access to heat shock elements in vivo depends critically on promoter architecture defined by GAGA factor, TFIID, and RNA polymerase II binding sites. Genes Dev. 9: 2756–2769. Sieburth, L.E. and Meyerowitz, E. 1997. Molecular dissection of
the AGAMOUS control region shows that cis elements for spatial regulation are located intragenically. Plant Cell 9: 355–365. Simpson, G.G. and Filipowicz, W. 1996. Splicing of precursors to
mRNA in higher plants: mechanism, regulation and sub-nuclear organisation of the spliceosomal machinery. Plant Mol. Biol. 32: 1–41.
Sinibaldi, R.M. and Mettler, I.J. 1992. Intron splicing and intron-mediated enhanced expression in monocots. Prog. Nucl. Acids Mol. Biol. 42: 229–257.
Snowden, K.C., Buchholz, W.G. and Hall, T.C. 1996. Intron posi-tion affects expression from the tpi promoter in rice. Plant Mol. Biol. 31: 689–692.
Tanaka, A., Mita, S., Ohta, S., Kyozuka, J., Shimamoto, K. and Nakamura, K. 1990. Enhancement of foreign gene expression by a dicot intron in rice but not in tobacco is correlated with an increased level of mRNA and an efficient splicing of the intron. Nucl. Acids Res. 18: 6767–6770.
Terada, R. and Shimamoto, K. 1990. Expression of CaMV 35S-GUS gene in transgenic rice plants. Mol. Gen. Genet. 220: 389– 392.
Turner, D.S., McCallum, D.G. and Covey, S.N. 1996. Roles of the 35S promoter and multiple overlapping domains in the patho-genicity of the pararetrovirus cauliflower mosaic virus. J. Virol. 70: 5414–5421.
Tzafrir, I., Torbert, K.A., Lockhart, B.E.L., Somers, D.A. and Olszewski, N.E. 1998. The sugarcane bacilliform badnavirus promoter is active in both monocots and dicots. Plant Mol. Biol. 38: 347–356.
Vasil, V., Clancy, M., Ferl, R.J., Vasil, I.K. and Hannah, L.C. 1989. Increased gene expression by the first intron of maize shrunken-1 locus in grass species. Plant Physiol. 91: 1575–1579.
Verdaguer, B., deKochko, A., Beachy, R.N. and Fauquet, C. 1996. Isolation and expression in transgenic tobacco and rice plants, of the cassava vein mosaic virus (CVMV) promoter. Plant Mol. Biol. 31: 1129–1139.
Waldron, C., Murphy, E.B., Roberts, J.L., Gustafson, G.D., Armour S.L. and Malcolm, S.K. 1985. Resistance to hygromycin B: a new marker for plant transformation studies. Plant Mol. Biol. 5: 103–108.
Wal, G., Varga-Weisz, P.D., Sandaltzopoulos, R. and Becker, P.B. 1995. Chromatin remodeling by GAGA factor and heat shock factor at the hypersensitive Drosophila hsp26 promoter in vitro. EMBO J. 14: 1727–1736.
Wang, D., Severinov, K. and Landick, R. 1997. Preferential inter-action of the his pause RNA hairpin with RNA polymerase β subunit residues 904-950 correlates with strong transcriptional pausing. Proc. Natl. Acad. Sci. USA 94: 8433–8438.
Wilkins, R.C. and Lis, J.T. 1997. Dynamics of potentiation and ac-tivation: GAGA factor and its role in heat shock gene regulation. Nucl. Acids Res. 25: 3936–3968.
Wong, E.Y., Hironaka, C.M. and Fischoff, D.A. 1992. Arabidopsis thaliana small subunit leader and transit peptide enhances the expression of Bacillus thuringiensis proteins in transgenic plants. Plant Mol. Biol. 20: 81–93.
Wünn, J., Klöti, A., Burkhardt, P.K., Ghosh Biswas, G.C., Lau-nis, K., Iglesias, V.A. and Potrykus, I. 1996. Transgenic Indica rice breeding line IR58 expressing a synthetic cryIA(b) gene from Bacillus thuringiensis provides effective insect pest control. Bio/technology 14: 171–176.
Xu, D., McElroy, D., Thornburg, R.W. and Wu, R. 1993. Systemic induction of a potato pin2 promoter by wounding, methyl jas-monate, and abscisic acid in transgenic rice plants. Plant Mol. Biol. 22: 573–588.
Xu, D., Lei, M. and Wu, R. 1995. Expression of the rice Osgrp1 promoter-GUS reporter gene is specifically associated with cell elongation/expansion and differentiation. Plant Mol. Biol. 28: 455–471.
Yin, Y. and Beachy, R.N. 1995. The regulatory regions of the rice tungro bacilliform virus promoter and interacting nuclear factors in rice (Oryza sativa L). Plant J. 7: 969–980.
Yin, Y., Zhu, Q., Da, S., Lamb, C. and Beachy, R.N. 1997a. RF2a, a bZIP transcriptional activator of the phloem-specific rice tungro bacilliform virus promoter, functions in vascular development. EMBO J. 16: 5247–5259.
Yin, Y., Chen, L. and Beachy, R. 1997b. Promoter elements required for phloem-specific gene expression from the RTBV promoter in rice. Plant J. 12: 1179–1188.