The Adsorption of Radionuclides on Bitumen
Part I: Strontium
By L. R. Van Loon and Z. Kopajtic
Paul Scherrer Institute, Wfirenlingen and ViUigen, CH-5232 ViUigen PSI, Switzerland (Received January 16,1991; revised February 25, 1991)
Bitumen / Adsorption / Surface complexation / Radionuclides / Strontium
Abstract
The adsorption of "Sr^"^ on bitumen emulsions with well characterized surfaces was studied as Function of pH and ionic strength of the equilibrium Solution. The bitumen/solution In-terface is negatively charged due to the deprotonation of weakly acidic carboxyl groups present at the surface. The surface group density is calculated to be 1.37 • 10'® groups/m^ and the deprotonation behaviour can be fairly well desribed by the lonizable Surface Group Model with a pKH=6.6.
Sr^'^ adsorbs on the bitumen by an outer sphere complexa-tion reaccomplexa-tion in which one surface carboxyl group is involved in the adsorption of one Sr^'^-ion. The adsorption depends on the ionic strength and pH of the contact Solution. The higher the ionic strength, the lower the adsorption. Sorption increases with increasing pH due to the deprotonation of carboxyl groups.
In a cementitious environment, Sr^ adsorption on bitumen is negUgible due to the strong competition of Na , K and Ca^ present in the cement pore water.
NaOH (pH = 11) were added and the mixture heated to 8 0 - 9 0 ° C and then stirred vigorously at 24000 rpm for 5 minutes by a high speed mixer (Ultra-Turrax, T-25; Janke and Kunkel, IKA). After cooling to room temperature, the emulsion was poured in an Erlenmeyer flask and left Standing overnight.
A 50 ml aliquot of the emulsion was placed in a dialysis bag (Dialysis Tubing-Visking, Medicell London) and equilibrated with 10"^ M NaOH con-taining different NaC104 concentrations. The solu-tions were replaced 4 times at intervals of about 2 hours. After the fourth replacement, the conditioned bitumen emulsion was filtered through a 40 um nominal pore size nylon membrane (Nytal, nylon monofilament). The filtered Solution was used for adsorption experiments, dry weight determination, particle size analysis and surface group density mea-surements.
Introduction
Bitumen is used world wide as a matrix for incor-porating low level and intermediate level radioactive waste mainly because of its good leach resistant properties. When the matrix also has a significant adsorption capacity, this can be regarded as an ad-ditional positive effect which contributes to the reten-tion of radionuclides in the near field of a repository. It is interesting for the safety assessment studies to know whether or not radionuclides do adsorb on the matrix.
The adsorption of radionuclides on bitumen has not received much attention in the past [1 — 3] and almost no Information on the adsorption mechanisms is available. This work describes the adsorption of Sr^ on bitumen emulsions in which the particles have well characterized surface properties as a function of pH, ionic strength and the presence of complexing ligands.
Materials and methods
P r e p a r a t i o n a n d c o n d i t i o n i n g of t h e b i t u m e n e m u l s i o n
About 10 g of bitumen (Mexphalt 80/100) were placed in a 500 ml flask. Approximately 400 ml of a 10"^ M
D r y w e i g h t d e t e r m i n a t i o n
10 ml of the bitumen emulsion were placed in a pre-weighted petri-dish and dried at 50 °C for 24 hours. After correction for the presence of salts, the dry weight was calculated.
P a r t i c l e size a n a l y s i s
The particle size distribution of the emulsion was mea-sured with a Coulter-Multisizer (Coulter Electronics Limited). The Coulter Counter determined the num-ber and size of particles suspended in an electrically conducting liquid by forcing the suspension through a small aperture having an immersed electrode on either side. As a particle passes through the aperture, the resistance between the electrodes changes and produces a voltage pulse whose magnitude is pro-portional to the particle size. Isoton(II) was used as the conducting fluid and an orifice tube of 50 um was selected, which has a measurement ränge from 1 to 30 um. The apparatus was calibrated by latex particles with a nominal diameter of 5.8 |xm. Size distributions for particles smaller than 1 um were determined with a laser diffraction particle size distribution analyzer (Horiba LA-500). This apparatus had a measurement ränge from 0.1 um to 200 um. The specific surface
area (SSA) was calculated from the size distributions assuming the particles to be spherical.
S u r f a c e g r o u p d e n s i t y d e t e r m i n a t i o n
The functional group density was determined by the adsorption of Co(NH3)6'^ on the bitumen surface. This technique has recently be used successfully to determine the functional group capacity of humic acids [4] and in previous studies to measure the cation exchange capacities of metal oxides [5], clay minerals [6] and polyacrylic acids [7],
Co(NH3)6 is stable in aqueous solutions between pH 2 and 12. It adsorbs only due to Coulombic inter-action and a charge reversal due to over-equivalent adsorption is excluded [5]. The negative charge on the surface is almost completely neutralized by the electrostatically adsorbed CoCNHj)!"^. One mole of adsorbed Co(NH3)6"^ represents three moles of nega-tive charges on the surface [4, 5, 7]. Co(NH3)6"^ can therefore be used very well to determine the functional group density on bitumen under conditions where they are completely dissociated (high pH).
An adsorption isotherm of CoCNHs)^'^ on bitu-men was determined. 20 ml aliquots of the bitubitu-men emulsion, conditioned in 10"^ M N a O H (pH = 11), were placed in teflon centrifuge tubes (Oak Ridge Type, 50 ml) and different volumes of a Solution con-taining 10"^ M Co(NH3)i+ and M NaOH were added. The volume in each centrifuge tube was then made up to 30 ml by 10"^ M NaOH. The mixtures were shaken end-over-end for 24 hours at room tem-perature. After equilibration, the solutions were cen-trifuged at HOOG g (Heraeus Sepatech, Biofuge 17S) for 30 minutes. The clear supernatant was analyzed for Co by ICP-AES. The amount of Co(NH3)i"" adsorbed was calculated from the difference in Co concentration before and after equilibrium.
A d s o r p t i o n of ^^Sr^""
20 ml aliquots of the bitumen emulsion, conditioned in 10"^ M NaOH and containing different concen-trations of NaC104 in the ränge 10"^ M and 9 • 10"^ M, were transferred to the 50 ml teflon centri-fuge tubes. 5 ml of the equilibrium Solution, spiked with , were added. The final Sr^ concentration was 1 0 " ' " M. The mixtures were shaken end-over-end for 24 hours whereafter phase Separation was performed by centrifugation at 11000 g for 30 minutes. 2 ml of the clear supernatant were sampled and analyzed for by liquid scintillation counting (Packard, Tricarb 2250 CA) using Instagel (Packard) as the scintillation cocktail. The amount of Sr^"^ adsorbed was calculated from the difference in concen-tration before and after equilibrium.
To study the pH dependency of the Sr^"^-adsorp-tion, bitumen emulsions were equilibrated in dialysis bags at different pH values between 7 and 11. Because
of the low buffering capacity of the bitumen emul-sion, 5 • lO""^ M TRIS (Tris(hydroxymethyl)-amino-methane) was used to buffer the pH in the ränge 7 to 8.6. Beyond pH 9, the pH was adjusted with NaOH to the desired value. The ionic strength of the solutions was fixed at 0.001 M. The same adsorption procedure was used as described earlier.
The effect of complexing substances on the adsorp-tion of Sr^ on bitumen was studied by adding NTA (nitrilotriacetic acid) to the liquid phase. The concen-tration of NTA was varied from 10"® M to lO"'^ M. The total Na"^ concentration amounted to 1.5 • 10"^ M and the pH was fixed at 11. The adsorption was performed in the same way as described above.
Results and discussion
The emulsification described previously yields bitu-men-in-water emulsions with 0.2—0.3% dry matter content. The particle diameter ranges from 0.1 to 30 um, resulting in a specific surface area of 3.5 — 4.5 m^/g.
The negative surface charge of the bitumen is caused by the deprotonation of carboxyl groups at the bitumen/water Interface. The electric properties of the Interface can be explained by the lonizable Surface-Group Model [8]. A brief description of the model is given here.
For the deprotonation reaction of a carboxyl group on a surface:
R C O G H ^ R C O O " + H +
the deprotonation constant is given by:
Kh = {RC00-}[H+]3
{RCOOH}
(1)
(2) where [H"^]^ is the concentration of hydrogen ions dose to the surface in mol/1. The concentration of protonated and deprotonated groups on the surface is expressed as groups/cm^. The concentration of H"^ on the surface [H"^]s is related to the bulk H"^ concen-tration [H'^lb by the Boltzmann equation:
[H+L = [H+]bexp(-yo)
(3)
where 7o is the reduced surface potential, defined as
eWo Yo =
kT
with: e = elementary charge (1.6 • 10"^® C) xpo = surface potential (V)
k = Boltzmann constant (1.38 • 1 0 " " J K " ^ ) T = absolute temperature (K).
As the potential \po is negative for bitumen, the term exp(— r o ) > 1, and this implies that the hydrogen ion concentration on the surface is higher than the hydro-gen ion concentration of the bulk Solution, or, the surface pH is lower than the Solution pH. This phenomenon has been investigated and described earlier by Danielli [9]. The difference in pH between
surface and bulk Solution can amount to several p H Units. For instance, when the surface potential ipo equals — 200 mV, the pH of the surface is 4 pH units lower than the pH of the bulk Solution. Weakly acidic functional groups at solid-liquid interfaces display an apparently acidic character arising from, and deter-mined in magnitude by, the electrical potential tpo generated upon ionization of the Interface. As a result, the dissociation of the weakly acidic surface groups will only be complete at higher pH values in Solution than would be the case for a monomeric weak acid in Solution [10].
The surface Charge of the bitumen is given by:
CTo = - e • {RCOO"}
(4)
and the total surface density of functional groups (N^, groups/cm^) is:Ns = {RCOO-} + {RCOOH}.
(5)
The surface charge (o^o^ C/cm^) can thus be written as:
(To =
-eN,
1 + ([H+]b/KH)exp(- Yo) (6) The surface charge has to be neutralized by the Charge in the diffuse electrical double layer (a^, C/cm^):
«To = —Cd-
(V)
The Charge density in the diffuse double layer can be related to the surface potential by applying the Gouy-Chapman theory:
(7d =
-(SnekTy'^smh{zYo/2)
(8)
with: n = number of counter ions per unit volume (cm-3)
z = valency of the counter ions
e = permittivity of the medium (C V~ ^ c m " Combination of equations (6) and (8) provides an explicit relationship between surface charge and sur-face potential as a function of pHb, the salt concen-tration and the amount of functional groups N^ on the surface:
pHb = - ro/2.303
-I- pKh - log
sinhizYo/l)
e
- 1(9)
where 6 =
(SnekT)'!^ •
- e N ,
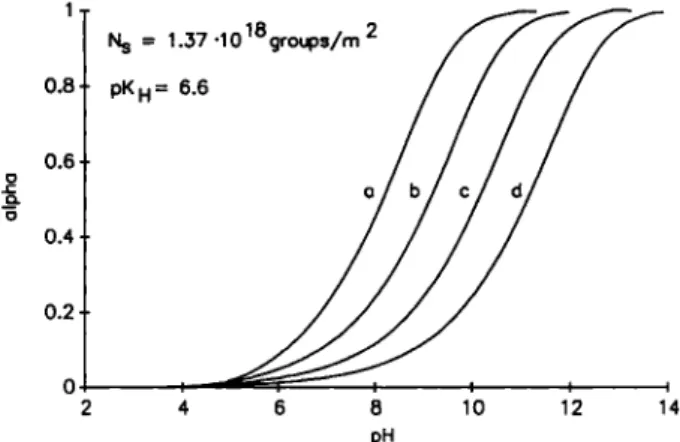
This relationship enables the surface potential at a given pHb, ionic strength and functional group density to be calculated. The corresponding CTq can be obtained by applying equation (8), assuming that <7o = — Figure 1 displays the relationship between the level of dissociation a and the bulk pHb as a func-tion of the salt concentrafunc-tion in the Solufunc-tion for a functional group density on the surface of 1.37 • 10^® groups/m^, with a:
1
Fig. 1. Deprotonation of surface carboxyl groups on bitumen as a function of pH. Surface group density: 1.37 • 10'® groups/m^;
P K H = 6.6. a) 1 = 0 . 1 M ; b) 1 = 0 . 0 1 M ; c) 1 = 0 . 0 0 1 M ; d ) 1 = 0 . 0 0 0 1 M . 3.5 3 2.5 2 1.5 1 0.5 0 E > a . t N_ = 2 . 3 ± 0 . 4 ( l e q / m ' 2 0 40 60 8 0 100 120 140 fieq/L
Fig. 2. Adsorption isotherm of Co(NH3)6^ on bitumen at pH = l l (NaOH 10-3 M, 7'=20°C). Af, = 2.3±0.4 neq/m^ =
1.37 - 10'»groups/m^
a = —
e - K
gp(10)
It is clear that the deprotonation behaviour of the carboxyl groups is complex and depends strongly on the surface group density and ionic strength of the medium.
Figure 2 shows the adsorption isotherm of Co(NH3)6'^ on bitumen. The adsorption isotherm shows a maximum adsorption level of 2.3 ± 0.4 ^eq/ m^. This corresponds to a carboxyl group density of 1.37 • 10'® groups/m^. From Fig. 1 we can see that at p H = 11 and 1 = 0.001 M, not all the carboxyl groups have been deprotonated. Adsorption of Co(NH3)6'^, however, causes the surface potential to become less negative with the consequence that a complete deprotonation occurs at a pH value lower than shown in Fig. 1. The maximum adsorption level of Co(NH3)6 thus represents the surface group density. The value of the functional group density given here is in good agreement with those reported in the litera-ture [8]. The latter values, however, were not deter-mined directly but were estimated by modelling experimental results of electrophoretic movement of bitumen particles.
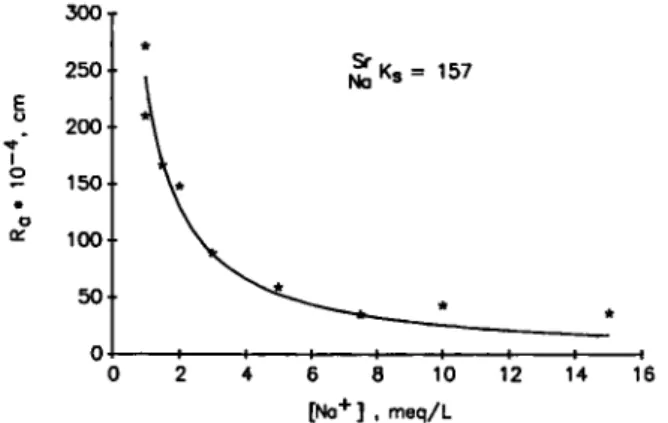
300 250 200 2 150 100 50 Ks = 157 0 2 4 6 8 10 12 14 16 [Na+] , meq/L
Fig. 3. Adsorption of Sr^"^ on bitumen as a function of the Na"^
concentration in the liquid phase at pH = l l . *: experimental points, — : calculated from equation (22).
Figure 3 shows the adsorption of ^^Sr^"^ as func-tion of the Na"^ concentrafunc-tion in the equiUbrium Solu-tion at a p H = 11. The concentraSolu-tion ratio { I ^ , cm) decreases with increasing Na"^ concentration. The concentration ratio is defined as:
Sr adsorbed |imol Sr/cm^
(11)
Sr in Solution ^mol Sr/cm^
Initially, the adsorption of Sr^ was assumed to be an ion exchange process. The heterovalent ion exchange reaction can be written as follows:
2Na+ + + 2Na+. The selectivity coefficient is defined by:
^sr • m ' ? • yk
Sr f _
(12)
(13) with: zsr and ZNa = fractional occupancy of
the surface by Sr^^ and Na+
[Sr^+] and [Na+] = concentration of +
and Na"*" in Solution (|xmol/cm')
= amount of Na"^ and Sr^"^
adsorbed (|xmol/cm^) = activity coefficient of Na"^ a n d Sr^"^ in Solu-tion. N ä ^ a n d ^ yNa a n d ysr
Since we are dealing with a system containing a macroelectrolyte Na"^ and a trace dement Sr^"^, the composition of the bitumen surface does not change significantly when Sr^"^ adsorbs. The activity coef-ficient ratio of the adsorbed species is constant and is included in the ne^c value [11]. The aqueous activity coefficient ratio can be calculated from the extended Debye-Hückel [12] theory and is denoted by F in the ^ b s e q u e n t equations. The term ZST can be replaced by Sr/CEC:
Sr — Na-J^c — Sr/CEC • [Na^]^
zäa • 2 • [Sr^+] (14) - 1 . 4 - 1 . 6 Z -1.8 o o: -2 - 2 . 2 - 2 . 4 - 2 . 6 slope = - 0.72 0.2 0.4 0.6 0.8 Log [No+] 1.2
Fig. 4. Log-log plot of A^'a • F as a function of/nN,- *:
experimen-tal points; — : regression analysis.
with F = TNa/^sr ^nd CEC is the amount of deprotonated carboxyl groups or the actual cation exchange capacity.
The factor 2 in equation (14) is introduced because the concentration of Sr^ on the surface is expressed on equivalent basis.
Since ZNa = 1 at trace level occupancy of Sr^ and Sr/(2 • [Sr^"^]) = Ä®'(cm), equation (14) can be written as: Na^c(^Sr ' • 0 ) = Rf • [Na+]" CEC or R f r = Sr V-NaJ^c CEC (15) (16)
log(;?? • F) = + logCEC - 2 • log[Na+]. (17) In case of a pure ion exchange process, the log-log plot of Rf • F as a function of [Na"^] yields a straight line with a slope — 2. Figure 4 represents such a log-log plot. The slope of the straight line equals - 0 . 7 2 in-stead of — 2. As this is dose to — 1, it can be concluded that 1 mol of Na"^ is exchanged by 1 mol of Sr^ . This Observation thus suggests that the adsorption of Sr^ on bitumen is not a stoichiometric ion exchange pro-cess, but has a specific interaction character.
If we assume that the reaction of Sr^^ with the bitumen surface (carboxyl group) can be written as:
RCOONa -1- Sr^+ ;?^RCOOSr+ Na+ then
Sr _
Na^s — {RCOOSr^} -[Na^l-yNa {RCOONa} • [Sr2+] • Vsr
(18)
(19) Since we are dealing with trace amounts of Sr^"^, the composition of the surface does not change signifi-cantly when Sr^^ adsorbs. The surface charge and Potential are completely determined by the p H and the N a ^ concentration in Solution. Consequently, {RCOONa} equals the actual CEC of the bitumen. As R f = {RCOOSr"'}/[Sr^"'], equation (19) takes the form:
' CEC and „Sr _ Na^s " CEC RV = (20)
(21)
[Na+] • r where T =yNa/7sr-Fig. 1 shows that the deprotonation of the surface carboxyl groups depends strongly on the ionic strength below pH = 13. Consequently, the CEC cannot be considered to be constant. Since CEC = a • CECmax> equation (21) is modified in:
CECmax
[Na+] • r (22)
where: a = degree of dissociation.
The value of a can be calculated for specific pH and I values by applying equation (7), (8), (9) and (10). The solid line in Fig. 3 shows a least Square fit of the experimental R^ (cm) by equation (22). The value of Na^s was derived from this least Square fit and equals 157 + 7. The intrinsic deprotonation constant (pKn) to calculate a was 6.6 and the CEC„a, was taken 2.3 |ieq/m^. The experimental data can be reasonably good described by equation (22). In the model it has been assumed that one carboxyl group reacts with one Sr^"^ ion to form a surface complex (or surface ion-pair). As the adsorption depends on the Na"^ concen-tration in Solution, the complex is an outer-sphere complex. This means that the complex formation is caused by an electrostatic attraction between ligand and metal atom, both of which conserve their hy-dration sphere [13]. The Sr^"^ ion is thus still located in the diffuse part of the double layer and not in the Stern layer.
Evidence for a complexation reaction with one surface carboxyl group only is provided by the surface group density. The functional group density is calcu-lated to be 1.37 • 10'® groups/m^ or 1.37 groups/nm^. One carboxyl group is thus localized on a surface of 0.7 nm^. The mean distance between adjacent car-boxyl groups equals +0.9 nm, which corresponds to 4 C — C bonds. This distance is too large to allow a chelation reaction with two carboxyl groups.
This conclusion is also supported by the Obser-vation that the stability constants of complexes of bicarboxylic acids and metals decrease with increasing distance between the two carboxylic groups. As soon as the carboxyl groups are separated by two or more C-atoms, the stability constant is low (log K=2) and changes little with increasing distance [14].
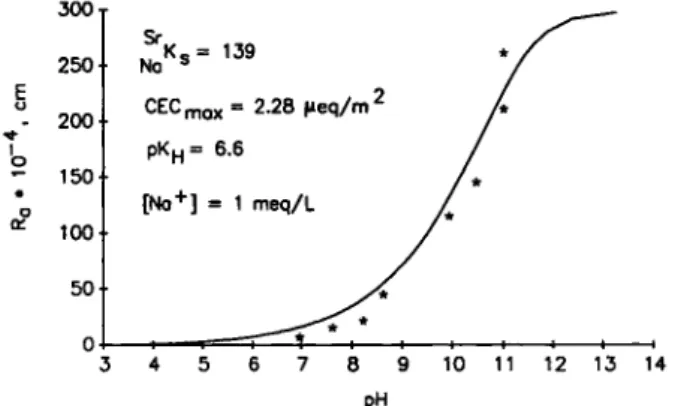
Figure 5 shows the adsorption of Sr^ on bitumen (/?aO as a function of the pH of the liquid phase. As expected, the adsorption is lower for lower pH values. The solid line in Fig. 5 shows the Variation of ü f as a function of pH as calculated from equation (22). The value of Na^s was derived from this least Square plot and equals 139 + 8. There is a good agreement between the calculated and experimental values. A good fit
No
CECmox = 2.28 (ieq/m2 PKh= 6.6
[No+] = 1 meq/L
Fig. 5. Adsorption of Sr^ on bitumen as function of pH at 1 = 0.001 M. experimental points; —: calculated from
equa-tion (22).
value of the deprotonation constant pKn for the exper-imental data in Figure 5 was found to be 6.6. This is somewhat greater then the typical values of 4.5 to 4.8 quoted in the literature for surface carboxyl groups and the pKn value of 4.5 calculated by Takamura and Chow [8] for carboxyl groups on bitumen. A reasonable explanation for this difference cannot be given at the moment because no Information is avail-able on the nature and chemical environment of the carboxyl groups on the bitumen surface. A value of 6.6, on the other hand, is not an implausible value. The pKn values observed for the carboxyl groups of different Compounds in Solution have a Gaussian dis-tribution, exhibiting values from 0.5 to 8.5 [15].
As soon as competing complexation reactions (hy-drolysis, ion pair formation, complexation with humic acids and organics such as EDTA, DTPA, NTA ...) occur in the liquid phase, the above model must be extended to account for their influence.
Assume that the following 1:1 complexation reac-tion takes place in the liquid phase:
:SrL. (23)
The stability constant of the complex is defined as: [SrL]
^SrL — (24)
The total concentration of Sr is:
[Sr],„, = [Sr^+] + [SrL] (25)
= + (26)
= [Sr^+](l + ^srL-[L^-]). (27) Hydrolysis of Sr^"^ can be neglected. At a pH of 11,
99.6% of the Sr is present as Sr^"^ and only 0.4% as Sr(OH)+.
As shown previously, the adsorption of Sr^"^ can be described by:
, {RCOOSr^} • [Na^] Na^s
= 174
[No+] = 1.5 meq/L
Fig. 6. Adsorption of Sr^^ on bitumen at pH = 11 and 1 = 0.0015 M as a function of [NTA] in the liquid phase.
exper-imental results; —: calculated from equation (30).
Table 1. Overview of Na-^s values obtained from different expenments Experiment S r f l O g ^ f a ^ s Variable [Na+] 157 + 7 2.20 Variable pH 139 + 8 2.14 NTA 1 7 4 + 9 2.24 With: {RCOONa} and {RCOOSr2+/[Sr],„, [Sr],. (1 + W L ' " ] ) = CEC = Rf
equation (28) takes the form:
[ N a ^ ] Sr t ' _ Na^s — RV = Rf CEC/(1 + ^srL • [L Na/S^s • CEC ] 2
-])
(29) (30) Figure 6 shows the adsorption of Sr^ ^ (expressed as /?aO as a function of the NTA concentration in Solution. NTA forms 1:1 complexes with Sr^ ^ with a stability constant of log A:=5.0 (1 = 0.1 M) [14]. The adsorption experiments were carried out at pH = 11 and a N a ^ concentration of 0.0015 M. The value of the stability constant of NTA with Sr^"^ equals 5.2 at this ionic strength. At pH = l l , 76% of the carboxyl groups are deprotonated so that the CEC has a value of 1.73 ^eq/m^The figure clearly demonstrates the inhibiting effect of NTA on the adsorption of Sr^"^. The solid line in Fig. 6 represents a least Square fit of Rl' as function of NTA as calculated from equation (30). Equation (30) describes the experimental results well. This is in fact not surprising since equation (30) forms the basis of the Schubert method for the determination of stability constants of complexes [16]. The ^"aATs was derived from the least square fit and equals 174 ± 9 .
Equation (30) is a general equation which describes the adsorption of Sr^"^ as a function of pH, ionic strength and the concentration of complexing ligands
Table 2. Composition of a Standard Portland cement water SPP [17] Parameter Cement SPP Temperature [°C] 25 pH 13.2 Ionic strength [M] 0.23 £h(niV) + 139 Na"- [M] 6 . 5 2 x 1 0 " ^ K M M ] 1.61x10"» [M] 1 . 0 0 x 1 0 " ' [M] 2 . 2 5 x 1 0 " ' Fe,„. [M] 1 . 0 0 x 1 0 " ' AI [M] 2.00x10""^ Alkalinity [N] 2.31 X 1 0 " ' SiOj [M] 2.00x10"-»
in Solution. Depending on the chemical conditions, equation (30) can be simplified.
The values of Na-^s obtained from the different experiments are summarized in Table 1. The values are very similar and it can be concluded that a value of 160 (log A" = 2.2) characterizes the adsorption of Sr^^ in presence of N a ^ and K"^. In case of Ca^^ as counter-ion, the value of c^ATj is expected to be + 1 because of the similar chemistry of both Sr^"^ and Ca^ . Complexes of carboxylic acids with Ca^ and Sr^"^ show similar stability constants [14].
Equation (30) can be used to calculate the adsorp-tion (/?f) of Sr^ ^ on bitumen under near field con-ditions (cementitious environment). If it is assumed that the bitumen is in contact with a cement pore water having the composition as given in Table 2 [17], then all carboxyl groups are deprotonated (a = l) so that the CEC value attains its maximum value of 2.3 |xeq/m^. The hydrolysis reaction of Sr^"^ becomes more important at this high pH (Sr^ + : 80%); Sr(OH)+: 20%) but can be neglected because is still the dominant species. Equation (30) is thus re-duced to its most simple form :
nSr _ Na^s ' CECmax .. [ N a - i r • ^^^^
The Na/STs is expected to be the same as SO that equation (31) can be written as
Na.K^s • C E C max
Rf = (32)
([Na+] + [ K + ] ) r
-The activity coefficient ratio T is equal to 2.45 at an ionic strength of 0.22 M. A mean value of 160 for Na^s was taken. This value, of course, is a maximum value operating at trace levels of Sr^ ^. At higher con-centrations of Sr^"^, the value of Na-^s is expected to be lower since interaction of Sr^"^ with less specific surface groups might occur when the loading of the bitumen surface with Sr^ increases. The subsequent calculations thus represent the maximum Rl" value that can be expected.
The value of Rf is calculated to be:
RV = 160 • 2 . 2 8 • 10
226.2 • 2.45 - 4
Taking the effect of Ca^ into account, the predicted Rf value is < lO"'^ cm. It may therefore be concluded that in a cementitious environment, Sr^ exhibits neg-ligible small sorption on the bitumen due to competi-tive effects of Na , K and Ca^ present in the cement pore water.
Acknowledgements
The authors like to thank Dr. B. Baeyens, Dr. M. Bradbury and Prof. R. Grauer for the fruitful dis-cussions. Thanks also to R. Keil for the chemical analysis.
This work was supported fmancially by the Swiss National Cooperative for the Storage of Radioactive Wastes, NAGRA.
References
1. Bumay, S. G.: Sorption effects in the leaching o f ' '''Cs from organic matrix waste forms. AERE R 12421 DOE/RW/ 87.083, August 1987.
2. Hietanen Raija, Alaluusua Maarit, Jaakkola Tino: Sorption of Cesium, Strontium, lodine, Nickel and Carbon in mix-tures of concrete, crushed rock and bitumen. Report YJT-85-38,1985.
3. Alaluusua Maarit, Hakanen Martti: Sorption of Cesium, Strontium, Cobalt and Technetium in mixtures of concrete, crushed rock and bitumen. Report YJT-87-10, 1987. 4. Maes, A., van Elewijck, F., Vancluysen, J., Tits, J., Cremers,
A.: Cobaltihexammine as an index cation for measuring the cation exchange capacity of humic acids. Proceedings of the International Symposium on Humic Substances in the Aquatic and Terrestrial Environment, Linkoping, Sweden, August 2 1 - 2 3 , 1989. In Press in Lecture Notes in Earth Sciences.
5. Dalang, F.: Zur Adsorption von Kationen an die Metalloxid-Wasser-Grenzfläche: Die Adsorption von
robusten Kobaltkomplexen. Ph. D. Thesis, Diss. Nr. 5916, ETH Zürich, Switzerland 1977.
6. Morel, R.: Etudes experimentales des phenomenes d'echange sur differentes mineraux argileux. Ann. Agron. 6, 5 - 9 0 (1975).
7. Eldridge, R. J., Treloar, F. E.: Rinding of counterions to polyacrylate solutions. J. Phys. Chem. 74, 1446—1449 (1970).
8. Takamura, K., Chow, R. S.: The Electric Properties of the Bitumen/Water Interface, Part II: Application of the lonizable Surface-Group Model. Colloids Surf. 15, 3 5 - 4 8 (1985).
9. Danielli, J. F.: The Relations between Surface pH, Ion Con-centrations and Interfacial Tension. Proc. R. Soc. London, Ser. B, 122, 155-174(1937).
10. Stone-Masui, J., Watillon, A.: Characterization of Surface Charge on Polystyrene Latices. J. Colloid Interface Sei. 52, 4 7 9 - 5 0 3 (1975).
11. Diamond, R. M., Whitney, D. C.: Resin selectivity in dilute to concentrated aqueous solutions. In: Ion exchange, Vol-ume I, (J. A. Marinsky, ed.), Marcel Dekker, In., New York 1966.
12. Novozamsky, I., Beek, J., Bolt, G. A.: Chemical Equilibria. In: Soil Chemistry, A: Basic Clements (G. Bolt and M. Bruggenwert, eds.), Elsevier Scientific Publishing Company. Amsterdam-Oxford-New York 1978.
13. Buffle, J.: Complexation Reactions in Aquatic Systems: an Analytical Approach, Ist ed., Ellis Horwood Limited 1988, p. 692.
14. Sillen, L. G., Martell, A. C.: Stability constants of metal-ion complexes, Special Publicatmetal-ion 25, Chemical Society, Burlington House, W1 London 1971.
15. Perdue, E. M., Reuter, J. H., Parrish, R. S.: A Statistical Model of Proton Rinding by Humus. Geochim. Cosmochim. Acta 48,1257-1263 (1984).
16. Van Loon, L. R., Kopajtic, Z.: Complexation ofCu^+, and UOi^ by radiolytic degradation products of bitumen, PSI report no. 66, Würenlingen and Villigen, Switzerland 1990.
17. Anderson, K.: Transport of radionuclides in Water/Mineral systems. Ph. D. Thesis, ISBN 91-7032-105-1, Chalmers Uni-versity, Goteborg 1983.
![Table 1. Overview of Na-^s values obtained from different expenments Experiment S r f l O g ^ f a ^ s Variable [Na+] 157 + 7 2.20 Variable pH 139 + 8 2.14 NTA 1 7 4 + 9 2.24 With: {RCOONa} and {RCOOSr2+/[Sr],„, [Sr],](https://thumb-eu.123doks.com/thumbv2/123doknet/14887053.647419/6.892.462.805.158.381/overview-obtained-different-expenments-experiment-variable-variable-rcoona.webp)