HAL Id: hal-02480139
https://hal.archives-ouvertes.fr/hal-02480139
Submitted on 15 Feb 2020
HAL is a multi-disciplinary open access archive for the deposit and dissemination of sci-entific research documents, whether they are pub-lished or not. The documents may come from teaching and research institutions in France or abroad, or from public or private research centers.
L’archive ouverte pluridisciplinaire HAL, est destinée au dépôt et à la diffusion de documents scientifiques de niveau recherche, publiés ou non, émanant des établissements d’enseignement et de recherche français ou étrangers, des laboratoires publics ou privés.
Social inequalities and indigenous populations in
Mexico: a plural approach
Olivier Barbary
To cite this version:
Olivier Barbary. Social inequalities and indigenous populations in Mexico: a plural approach. Patrick Simon; Victor Piché; Amélie A Gagnon. Social Statistics and Ethnic Diversity: Cross-National Perspectives in Classifications and Identity Politics, Springer, pp.209-228, 2015, 978-3-319-20095-8. �10.1007/978-3-319-20095-8_11�. �hal-02480139�
Social inequalities and indigenous populations in Mexico: a plural
approach
Olivier Barbary (Institut de Recherche pour le Développement) Introduction
The 2000 census of the Mexican population clearly marks a turning point in the history of statistical identification of the country’s indigenous population. After categorization by race or customs related to dress, food, etc. was abolished in 1895, the census of indigenous Mexicans was exclusively based on a linguistic criterion throughout the entire twentieth century. In 2000, the National Institute of Statistics and Geography1 introduced a second criterion with a question for self-reporting ethnicity asked to every individual age five and older. This innovation creates a significant gap between the estimated sizes of the indigenous population based on the two criteria just when, after the neo-Zapatista uprising, the political and social issues related to the Indian question and measuring discrimination have increased, as in most Latin American countries (Barbary and Urrea, 2004, Barbary, ed. 2006, Gros 1998, Wade 1997). This was followed by a revival of the worldwide and rich debate on “indigenous statistics” categories, their legitimacy, their relevance (definitions, question formulation, etc.), and their demographic, sociological and anthropological significance (Beaucage 1987, Cifuentes 1998, Dauzier 1997, Fernández Ham 2000, Florescano 1997, Gros 1999, Lartigue and Quesnel, eds. 2003, Lavaud and Lestage 2005, Stavenhagen 1992, Various authors 1985).
From a purely linguistic point of view, change in indigenous population is based on the transmission of languages (down through generations) that were historically dominated by Spanish. This transmission is rapidly eroding for many indigenous groups due to migration from areas of origin and urbanization, situations where speakers of indigenous languages are often stigmatized. The number of people who report as “hablantes”2 has sharply decreased over several decades,3 even though many specific cultural, economic and social characteristics that are just as important as language prevail among non-speakers. This persistence, confirmed by anthropological studies, including those conducted in large cities, has led Martinez Casas and De la Peña (2002, 2005) to speak of moral communities (communidades morales). For many analysts, the linguistic criterion causes an underestimation of contemporary indigenous population—and reality—particularly outside regions historically populated by Indians. Self-reporting allows for inclusion in an ethnic group without any reference to a particular “objective” characteristic. Detractors criticize this; however, as Fernández Ham (2000) points out, this involves a “statistical approach to perceived indigenous identity.” By authorizing this expression of identity in the census, the government only recognizes the emergence of new manifestations of ethnicity in Mexico where the numerical impact is far from negligible.
To move beyond the issue of numbers and better guide these new problems, we will argue in favor of an approach comparing several possible statistical definitions that combine two ways—individual and collective—of understanding “indigenous identity” using census information. Combining the two criteria produces 17 types of households (including non-indigenous households) that we present in the first section. The final meaning and true significance of this categorization is disclosed by a multivariate analysis of demographic and socio-economic profiles of the various segments of the country’s population and
1 INEGI: Instituto Nacional de Estadística, Geografía e Informática. 2
The word “hablantes” means “speaker” in Spanish.
3 Hence, Delaunay (2005, p.9) notes a decrease of about 6% to 10% according to generations when comparing the percentages of speakers from the 1990 and 2000 censuses.
particularly in highlighting the high heterogeneity of the indigenous universe (second section). In the contemporary dynamics marked by emigration, urbanization and linguistic acculturation, the variety of “Indian conditions” can no longer be reduced to “traditional” cultural and linguistic differences. It is mainly based on, perpetuated by, or changed by its relationship to differences in access to resources and modern mechanisms for socio-economic organization. The “Indian condition” is differentiated and even segregated according to a set of demographic, spatial, economic and cultural processes.4
1. Indigenous individuals and households: possible definitions
- Three separate criteria: speakers, mono- or bilingualism and self-identified ethnicity The two questions concerning linguistic and ethnic identification for the population age five and older resulted in the following figures for total indigenous population published by the INEGI in 2000: the total number of speakers of indigenous languages was 6,320,250 persons (7.33% of the total population age five and older), to which is added 1,109,990 non-speakers who self-identify as belonging to an indigenous ethnic group,5 amounting to an indigenous population (IP) of 7,430,240, or 8.62% of the population age five and older. However, a more systematic approach can be applied to the responses to the two questions by distinguishing at an individual level: (i) monolingual speakers (speaking one indigenous language, non-Spanish speaking, 1,068,654 individuals), for whom the vast majority (86%) self-identify, (ii) self-identified and bilingual speakers (3,265,966), (iii) non-self-identified and bilingual speakers (1,985,630), (iv) self-identified and non-speakers (1,109,990) and lastly (v) speakers and self-identified persons who will be considered non-indigenous (78,793,234).
Linguistic and ethnic identity for individuals can be classified based on these relatively balanced numbers (none of these categories is statistically marginal), and allows for an immediate quick interpretation. But further analysis is needed to confirm this interpretation and should enable qualifying and specifying it. On one extreme, 14.4% of the IP who are monolingual speakers, almost all of who identified as indigenous, constitute a kind of solid core of “traditional” indigenous identity, based on homogeneity in terms of language and settlement concentration in historically Indian territories. Its demographic erosion is not only due to the lack of intergenerational transmission of language mentioned above, but also to migrations resulting in inter-penetration of indigenous and non-indigenous living spaces. This leads to generalized bilingualism and the relativization and relaxation of ethnic identity according to contexts involving residence and inter-community interaction. This is evidenced by the two groups of bilingual speakers, now the majority: those who self-report their ethnic identity (44% of the IP) and those who do not (26.7% of the IP). Lastly, unlike the first group living in contexts that are much more racially mixed (mestizo) and in light of recent political and social issues concerning ethnicity, one notes the emergence of a new identity based on ethnic identification within the indigenous population of non-speakers (at least self-reporting as such). For the first time, the 2000 census conducted a countrywide assessment of this group: 14.9% of the IP.
However, based on the standard critique made in Mexico and elsewhere until now, this individual-level approach to identities is insufficient: demographic, socio-economic and anthropological dynamics influence collective units (households, families, communities) and the various types of indigenous identity are shaped within them. Yet, the census data naturally lend themselves to an approach at the household level.
4 The thesis developed here should be supported in an upcoming article by determining models (logistic regression) of social and economic household differences by linguistic and ethnic identity, all other things being equal.
- Household structure and collective identity: a criterion of linguistic and ethnic homogeneity
Many studies in Mexico have used a statistical approach to the ethno-linguistic identity of households.6 When figures and socio-economic characterization are important political issues, the debate easily focuses on the question of the “correct definition” of indigenous population and the justification of various strategies to reach households. Until now, the favored options oscillate between two approaches: (1) a maximalist choice that consists of counting any household where at least one individual of five years or older, regardless of his/her kinship tie to the head of household (HoH), is a speaker or self-identifies (CONAPO, 2001); and (2) a definition restricted to the household’s main adult nucleus, constituted by the HoH and his/her partner (Janssen and Martinez Casas, 2004). The first results in a total population of indigenous households of 12,658,899 persons; the second totals 11,361,634 persons.7 Beyond these very different estimations,8 sticking with one single definition (one or the other) does not allow for studying and comparing the different types of ethno-linguistic composition of indigenous households and the characteristics of the population groups. This is why this paper proposes a more systematic approach.
Using census information, a statistical understanding of “collective indigenous” identity of households can be constructed and justified by considering both the linguistic and ethnic attributes of individuals and their kinship links. To this end, we have distinguished four situations:
i) The HoH and his/her partner share the same linguistic characteristics (mono- or bilingual speakers or non-speakers) and report the same ethnic identity (indigenous or not). By combining these two criteria, four types of households are obtained around a main adult homogenous nucleus where a strong “identity coherence” can be expected for all members of the household. This situation concerns a total of 995,766 households, or 38.6% of indigenous households (IHs).
ii) The HoH and his or her partner have different characteristics (at least one of the two is a speaker or self-identified).9 Hence, the household characteristic is then based— arbitrarily—on the “most indigenous” person, in the following order: monolingual speaker self-identifying his/her indigenous identity, self-identified bilingual speaker, non-self-identifying speaker and self-non-self-identifying non-speaker. Thus, taken together they amount to 1,369,431 households, or 53.1% of IHs.
iii) The adult couple at the head of the family has no indigenous characteristics. This case will first concern the household adults from collateral or ascendant generations of the HoH or his/her partner: brothers and sisters, cousins, parents, uncles and aunts, grandparents, etc. Again, among these household members, those who have the most indigenous
6
Serrano, Embriz and Fernández Ham 2002. This work certainly constitutes the most complete and serious data analysis to date on the indigenous population from the 2000 census. See also: CONAPO, 2002, Fernández Ham, 1998, Fernández Ham, 2000, Janssen and Martinez Casas, 2004, Valdés L. M., 1998, etc. 7 To make comparisons with our own estimations, we have used results from our own calculations, based on data from the 10% ordinary household sample of the 2000 census (cf. Barbary O. and Muller L., 2006). According to the CONAPO definition, the total indigenous population was projected to amount to 13,851,503 on 1 June 2008.
URL: http://www.conapo.gob.mx/00cifras/indigenas/repMexicana.xls 8
Serrano, Embriz and Fernández Ham (2002) have adopted an intermediary option by only regarding indigenous households as those where they consider that: “the persons having indigenous characteristics have a determining kinship link in lifestyle choices and the intergenerational transmission of socialization, in other words the HoH, his or her partner and their parents.” The total population of these households amounts to 11,639,778 persons.
9 The single-parent households where the HoH is a speaker or self-identified have been incorporated into this group.
attributes determine the ethno-linguistic status of the household. These households number 48,703, or 1.9% of the IHs.
iv) Finally, when the HoH, his/her partner or their relatives in the collateral or ascendant generations are not speakers and do not self-identify, the household’s indigenous status could stem from speakers or self-identified persons from descendant generations (if they exist): children, grandchildren, nieces or nephews, etc. of the HoH or partner. Thus, we obtained the four last types, transmitted to the household by the “most indigenous” person among these generations. These total 164,528 households or 6.4% of the IHs.
- Population size: a statistical partition of the indigenous world
Finally, crossing individual linguistic and ethnic attributes with the position of these individuals in the household family structure makes it possible to assign all households having speakers or those who self-identify (except for missing information) into 16 distinct ethno-linguistic types. Beyond taking into account the household’s collective identity, we thus respond to criticism frequently aimed at the overall indigenous category that was created and analyzed following the 2000 census: “it mixes together the fact of being indigenous through language and the desire, or not, to demonstrate this origin” (Delaunay 2005, p.28).
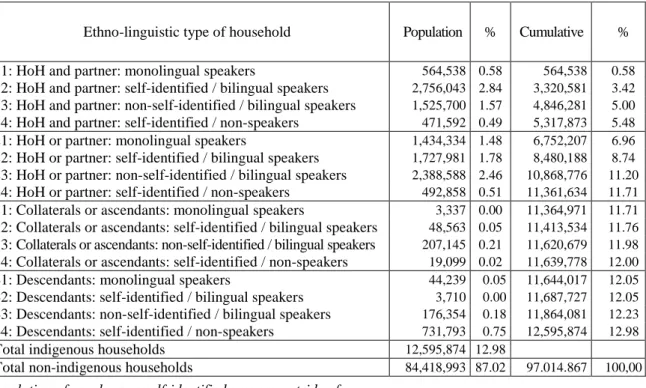
Table 1: Population in households according to their ethno-linguistic category
Ethno-linguistic type of household Population % Cumulative %
11: HoH and partner: monolingual speakers 564,538 0.58 564,538 0.58
12: HoH and partner: self-identified / bilingual speakers 2,756,043 2.84 3,320,581 3.42
13: HoH and partner: non-self-identified / bilingual speakers 1,525,700 1.57 4,846,281 5.00
14: HoH and partner: self-identified / non-speakers 471,592 0.49 5,317,873 5.48
21: HoH or partner: monolingual speakers 1,434,334 1.48 6,752,207 6.96
22: HoH or partner: self-identified / bilingual speakers 1,727,981 1.78 8,480,188 8.74
23: HoH or partner: non-self-identified / bilingual speakers 2,388,588 2.46 10,868,776 11.20
24: HoH or partner: self-identified / non-speakers 492,858 0.51 11,361,634 11.71
31: Collaterals or ascendants: monolingual speakers 3,337 0.00 11,364,971 11.71
32: Collaterals or ascendants: self-identified / bilingual speakers 48,563 0.05 11,413,534 11.76
33: Collaterals or ascendants: non-self-identified / bilingual speakers 207,145 0.21 11,620,679 11.98
34: Collaterals or ascendants: self-identified / non-speakers 19,099 0.02 11,639,778 12.00
41: Descendants: monolingual speakers 44,239 0.05 11,644,017 12.05
42: Descendants: self-identified / bilingual speakers 3,710 0.00 11,687,727 12.05
43: Descendants: non-self-identified / bilingual speakers 176,354 0.18 11,864,081 12.23
44: Descendants: self-identified / non-speakers 731,793 0.75 12,595,874 12.98
Total indigenous households 12,595,874 12.98
Total non-indigenous households 84,418,993 87.02 97.014.867 100,00
Population of speakers or self-identified persons outside of
indigenous households 68,602 0.07%
Total Indigenous Population 12,664,476 13.05%
This construction stems from ethno-linguistics and indigenous anthropology in Mexico, although it could never totally replace or guarantee them; it has a different goal. It is a statistical construction of the aggregate population living in indigenous households that we want to be as complete and detailed as possible using the census information. Following Mexican demographers, we will call it the “indigenous household population” (IHP). It is focused on a socio-demographic analysis of the various population groups, while highlighting their common points and specificities. Thus, we are interested in what the 16 types demonstrate about the continuum of identity situations in the contemporary indigenous world. However, the different analyses must not be confused: statistical
conclusions are not based on anthropology and the interpretation of underlying social facts must use ethnographic data too.
Despite using a slightly more restrictive definition, the total for IHP that we obtain is quite close to the one published by the CONAPO for all households where at least one individual of five years and over is a speaker and self-identified (12,658,899). More important is the impact of including indigenous individuals in the HoH’s or partner’s descendant generations, which increases the total IHP by nearly one million people compared with the number calculated by Serrano, Embriz and Fernández Ham (11,639,778). Yet, this definition especially reveals a recent trend in re-appropriating the language and self-identification of ethnic identity among young generations; as indicated below, the concerned households occupy a very specific socio-economic position within the indigenous population. By comparison, the role of the HoH’s or partner’s collateral or ascendant generations is less significant: less than 300,000 individuals belong to households for which the indigenous identity stems from collateral and ascendant generations. In fact, the greater majority of the IHP lives in households where the “indigenous attributes” prevail in the main conjugal nucleus: 11,361,634 persons or 90.2% of the IHP.
These initial results relativize the statistical stakes in the controversies surrounding the definition of IHP. When taking into account the indigenous population outside of indigenous households—which increases as the definition is restricted—the gap between the more restrictive definition (HoH or partner) and the broader one (at least one individual related to the HoH or his/her partner) does not exceed one million. This amounts to knowing whether the entire indigenous population is 12% or 13% of the national total; this is not the main issue. What is most important in this exercise is that it provides a statistical baseline to divide up the universe of indigenous households into nine main categories: the eight types of households where identity is assigned by the HoH or his/her partner and the households where it stems from the HoH’s or partner’s descendants who are bilingual speakers and non-self-identified. These nine categories with significantly varied weights (between 4.5% and 21.9% of the IHP) combine to total 96% of the indigenous population. The seven remaining categories describe the other types of households where persons outside of the main conjugal nucleus assign indigenous identity. Despite their low weights, they can reveal noteworthy linguistic and ethnic identity reconstruction processes. Detailed analysis of the demographic and socio-economic characteristics of these households will demonstrate the true significance of these categories.
2. Indigenous specificity and heterogeneity: multivariate analysis of household characteristics
During the 2000 census, linguistic and ethnic identification did not involve all Mexican households; only a sample of 10% — representative on a national scale— responded to the “extended” questionnaire. As compensation for this restriction — with no statistical consequences on our level of analysis— we have more thorough data at our disposal than in the exhaustive database. It covers the following topics: (i) geographic localization of the households’ place of residence, (ii) occupancy status and physical characteristics of housing, (iii) access to public services and household consumer goods, (iv) household composition and demographic characteristics of individuals, (v) fertility for females age 12 and over, (vi) educational capital of individuals age 5 and over, (vii) social security and health, (viii) economic activity of individuals age 12 and over, (ix) individuals’ incomes and (x) lifetime migration, migration since 1995 and international migration since 1995. We carried out a multi-dimensional factorial analysis (Multiple Correspondence Factorial Analysis (MCFA), Benzécri 1973, 1980) to observe how various types of indigenous households are placed within the main structures of socio-demographic differentiation for
all Mexican households.10 The introduction of supplementary elements makes it possible to project variables relative to the linguistic and ethnic characteristics and the description of households’ residence contexts using census data onto the factorial planes. The supplementary elements do not contribute to determining the axes. The first supplementary variable is the households’ linguistic and ethnic classification into 17 categories. For indigenous households where at least one person is a speaker, we also know what language was spoken according to the nomenclature for 79 linguistic groups developed by the INEGI and INALI in 2005, from which we have kept the 16 main ones (each one spoken in more than 30,000 households).11 The third supplementary variable is the household’s place of residence (federal entity) at time of the census (“entidad federal”: the 32 states of Mexico). Lastly, five modalities of the size of the locality of residence were projected onto factorial planes.
- A strong relationship between social position and ethno-linguistic characteristics
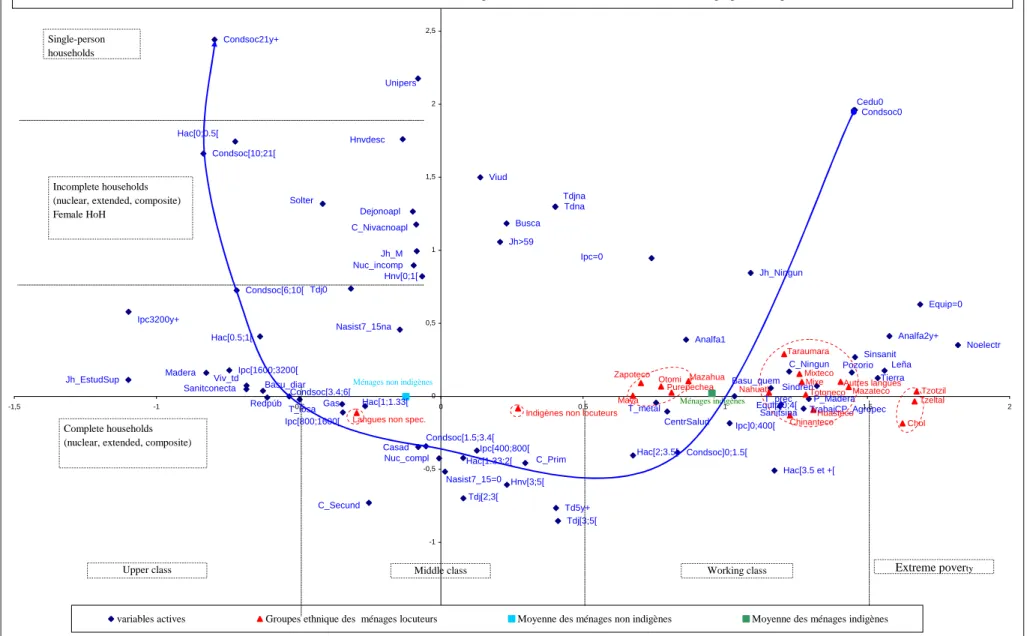
Not surprisingly, the socio-economic differentiation largely dominates the hierarchy of the structures present in the data (cf. Diagram 1). The first factor indicates the households’ social positioning (and accounts for 54% of total inertia), whether the contributing variables are directly related (household’s index of social position, socio-professional category of the HoHs, income, household equipment) or that they have a strong correlation (illiteracy; household’s educational climate12 and educational capital of the HoHs and their partners, housing conditions and overcrowding, access to public services, etc.). For convenient interpretation, the diagram can be divided into four equal parts (separated by black dotted lines): the upper class occupies the segment on the far left (abscissa below -0.5), followed by the middle class centered around the origin (-0.5, +-0.5), then the working class (0.5 to 1.5) and to the extreme right, the poorest class (1.5 to 2.5).
The second factor is correlated to the households’ demographic composition and differentiation (and accounts for 21% of total inertia). It separates single-person or incomplete (headed by only one person) households or those headed by women from complete nuclear households that have the highest fertility and juvenile dependency rates. The roughly parabolic shape of the cloud of modalities and that of households (not reproduced here) is known as the Guttman effect. It appears frequently in correspondence analysis and indicates a non-linear relationship between the social position and the demographic structure of households: the second factor is close to being a parabolic function of the first factor (second-degree polynomial). The blue curve connecting the modalities of the social conditions’ index in the diagrams illustrates this relationship and could be a reference point to construe both socio-economic and demographic differentiations of indigenous households. However, in conforming to the title and length of this article, we will only comment on the first and most important factor of heterogeneity across households: socio-economic inequality.
We now consider the projection of ethno-linguistic types of households.13 The non-indigenous households comprise the greater majority (their mid-point is a light blue square) and deviate very little from the origin, yet with socio-economic positioning that is slightly higher than the mean. In contrast, the indigenous household mean (green square) and nearly all the categories for indigenous households (red triangles) are situated to the far
10
All of the information was first summarized into 37 household variables (a total of 205 modalities after discretization of quantitative variables), to account for their demographic, socio-economic, migratory, etc. characteristics. These are the active variables for the multiple correspondence factorial analysis.
11 The other languages form a single modality of the variable to facilitate diagram readability. 12
This is the mean number of years of education for all adults in the household.
13 Since ethnic identity did not contribute to defining the axes, their position is significant of the gap between their socioeconomic profile and the average profile of all households (located at the origin of the plane).
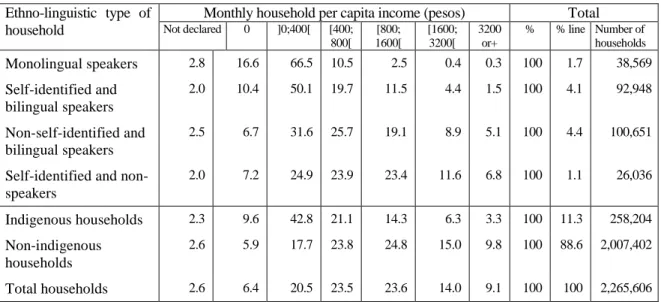
right; this attests to the socio-economic inequality that affects them as a whole. The highly contrasted household distribution by monthly per capita income (Table 2) summarizes this situation. Poverty (less than 400 pesos per month per person, or approximately 40 US dollars) affects more than 52% of indigenous households as opposed to less than 24% among non-indigenous ones; in the population of monolingual indigenous households, it reaches 83% while only 3.2% of the households have an income greater than 800 pesos. Table 2: Monthly per capita income for various types of households
Monthly household per capita income (pesos) Total
Ethno-linguistic type of
household Not declared 0 ]0;400[ [400;
800[ [800; 1600[ [1600; 3200[ 3200 or+ % % line Number of households Monolingual speakers 2.8 16.6 66.5 10.5 2.5 0.4 0.3 100 1.7 38,569 Self-identified and bilingual speakers 2.0 10.4 50.1 19.7 11.5 4.4 1.5 100 4.1 92,948 Non-self-identified and bilingual speakers 2.5 6.7 31.6 25.7 19.1 8.9 5.1 100 4.4 100,651
Self-identified and non-speakers 2.0 7.2 24.9 23.9 23.4 11.6 6.8 100 1.1 26,036 Indigenous households 2.3 9.6 42.8 21.1 14.3 6.3 3.3 100 11.3 258,204 Non-indigenous households 2.6 5.9 17.7 23.8 24.8 15.0 9.8 100 88.6 2,007,402 Total households 2.6 6.4 20.5 23.5 23.6 14.0 9.1 100 100 2,265,606
As seen, the indigenous population is not a homogeneous block. The multivariate approach can articulate several differentiation factors to characterize its socio-economic segmentation.
What is most striking about the analysis of the diagram, beyond the significant disadvantage that affects the Indian population overall, is its heterogeneity throughout the socio-economic range of the middle, working and poorest classes. This is all the more so given that this variability in social conditions proves to be strongly linked to the households’ linguistic characteristics and self-reporting of ethnic identity. To demonstrate this, we have separated all of the indigenous households into four main groups indicated by ellipses drawn in dotted red lines on the graph.
The first group on the extreme right is in a situation of extreme poverty marked by unreliable construction materials for housing, exclusion from basic services (water, electricity, sanitation and sewers and waste management), the lack of monetary income and household goods and social marginality (illiteracy, no access to education and health services). It is formed from two household categories that are demographically significant and where the conjugal nucleus (HoH and/or partner) are monolingual speakers who—in most cases—self-report their ethnic identity (104,882 and 278,713 households, respectively). Therefore, the most traditional and homogeneous collective indigenous identity within the households is clearly associated with the greatest socio-economic disadvantage.
The second group is distributed along the entire range of the working class segment, centered around: low incomes (monthly per capita income [MPCI] lower than 400 pesos per month); difficulties in access to services (water, sanitation), education and health; agricultural socio-professional categories and overcrowding in dwelling units varying between 2 to over 3.5 persons per room. It includes the four categories of households containing the bilingual speakers who self-report their ethnic identity. The two most
numerous correspond to households where the HoH and his/her partner are bilingual and self-identified—506,274 households—and those where only one of the two has these attributes—407,709 households. This also includes the households where the two partners of the main nucleus are bilingual speakers but do not self-identify as indigenous (284,545 households). Compared to the first group, the introduction of bilingualism slightly alleviates socio-economic segregation.
The third group, relatively better off socio-economically and within the lower middle class, is organized around the category with the largest number of households: those where only one of the two partners is a bilingual speaker who has not reported ethnic identity (554,308 households). The living conditions, access to goods and services, the professional and financial situation for these households, etc., are very homogenous for this category and close to those for the household average. However, a significant disadvantage is noted relative to educational capital; quite frequently, the partner of the HoH has only completed a primary education. This group includes some households of non-self-identified and bilingual speakers (those where only one of the two partners has these characteristics and households involving the members from the HoH’s or partner’s collateral or ascendant generations) and some identified and non-speaker households (those for which self-identification occurred for only one of the two partners or members of HoH’s or partner’s descendent generations). Households where the two partners are non-self-identified and speakers that hold an intermediate social position between the lower middle class and the working class can also be included here. Again, compared to the previous group, the absence of identified ethnicity in the households of speakers or the opposite, self-identified ethnicity in the households that report no longer speaking an indigenous language, is accompanied by a clear improvement in their average social conditions, which is no longer significantly below the average for non-indigenous households.
The last group, which accounts for just over 5% of indigenous households, is the only one to occupy a negative position on the axis (halfway left from the central ellipse). The households for whom indigenous identity is determined by descendants of the HoH or partner who are bilingual speakers but who do not self-report their ethnic identity make up the largest proportion (126,997 households) with a socio-economic profile nearly identical to the mean profile for all households. The only category clearly located within the upper middle class is the one for whom indigenous identity is due to self-identification by HoHs’ or partners’ ascendants or collaterals who are non-speakers; in fact, this is one of the smallest groups (3,568 households). In the universe of indigenous households, it stands out as much for its satisfactory social and economic integration—good housing conditions and access to public services, overcrowding lower than one person per room, secondary education level for the partner, etc.—as for an ethnic identity, often linked to previous migrations outside of areas traditionally populated by indigenous peoples. This could be qualified as “peripheral”: individuals outside of the conjugal nucleus that have ceased to speak their indigenous language but who self-identify as indigenous.
Thus, a very coherent pattern appears within the heterogeneous universe of indigenous households that links their social positions to their linguistic characteristics and their self-perception of ethnicity. We used two concepts to classify the households: the actual ethno-linguistic dimension—ranging from self-identified and monolingual speakers to non-speakers who only self-identified—and the collective dimension—graduated according to the homogeneity of ethno-linguistic attributes and the approximate “central” position of individuals who possess these attributes. These two concepts produce two “orders” of identity that can be translated almost systematically in the social hierarchy. In the diagram, the socioeconomic gradient linked to the ethno-linguistic dimension can be assessed by connecting all the points corresponding to a same distribution of attributes in the household (red dotted lines) and the one from the collective identity configuration of the household by
connecting all the households corresponding to a same combination of attributes (black dotted lines).
The first gradient covers nearly all of the social space where indigenous populations have been confined. Nearly all households with the most “traditional” ethno-linguistic identity (self-identified and monolingual speakers) experience extreme poverty due to their economic exclusion and marginalization by institutional apparatus. The households of self-identified and bilingual speakers clearly stand apart from this extreme situation through their “integration” into what we have termed the working class. There is a correspondence between the identity of households of bilingual speakers who do not report their ethnic identity—more marked by biological and cultural mixing (and probably also by racial stigmatization)—and more heterogeneous positions in the social scale from the “center” of the working class through the lower middle class to the beginning of the upper middle class. Finally, the social space that characterizes the self-identified and non-speaker households is spread throughout the middle class up to the upper-class boundary.
Within the four large ethno-linguistic groups, the second gradient functions identically, yet while producing a lesser degree of social heterogeneity. The relationship between the socio-economic status and the “identity configuration” of the households is once again obvious. Households with a homogenous conjugal nucleus through their ethno-linguistic attributes face the most difficult socio-economic situation, followed by those where the HoH and his/her partner have different attributes, then those where the linguistic or ethnic identity is determined by individuals outside of the conjugal nucleus.
- Social differentiation, economic geography and segregation of ethnic groups
Diagram 1 simultaneously displays the extent of the overall socio-economic disadvantage of indigenous households and the range of differences between them. However, these inequalities do not only affect the indigenous world. They must be placed in the economic and social segmentation for the entire Mexican population while specifically considering one of its main determinants: heterogeneity of development in the national territory. Diagram 2 enables an evaluation of the impact on the socio-economic conditions of indigenous and non-indigenous households from a context of their shared place of residence (state and size of locality). By observing the distribution of states along the first axis, the country’s very unequal socio-economic geography is evident.14 We have outlined its broad features here by linking them to household living conditions.
On the right of the diagram, clearly isolated from the rest of the national socio-economic space, the states of Chiapas, Oaxaca and Guerrero form an enclave of poverty where the greater majority of households experience economic insecurity (housing conditions, income, household goods) and exclusion from access to public services (water, electricity, sanitation), education, health, etc. Thus, for example, households where the MPCI is below 400 pesos are 60% of the total in Chiapas, 55% in Oaxaca and 47% in Guerrero (versus a national average of 27%). Viewed overall, this is even more so for the entire rural areas of these three states. The mean socio-economic profiles for all of the country’s other states are distributed fairly equally around the national average. Four geographic patterns have been distinguished (ellipses drawn in dotted red lines).
The first pattern is made up of the predominantly rural central and southern states: Veracruz, Hidalgo, Tabasco, Puebla, Campeche, Yucatán, San Luis Potosí and Michoacán in increasing order of mean social conditions. For all of these states, this is definitely
14 This geography has been fully analyzed by the social sciences in Mexico. For the case of the indigenous population, see for example: Delaunay, 1995; De la Vega Estrada, 2001.
below the national average; it corresponds to the bottom third of the middle class and to a locality profile where population numbers between 2500 and 15,000 inhabitants. The second pattern includes Zacatecas, Nayarit, Tlaxcala, Guanajuato, Durango, Morelos, Sinaloa, Querétaro and Quintana Roo, where intense agriculture and the development of the service industry within the urban economy has replaced traditional agriculture and the failing industry, not without serious social impacts. The mean socio-economic level of households gradually increases (in the order listed), but overall, the profiles are homogeneous and concentrated around the national average. The third group brings together most of the western and northern states: Tamaulipas, Sonora, México, Colima, Chihuahua, Baja California Sur, Baja California, Coahuila, Jalisco and Aguascalientes, which are further along than the preceding group in the same economic transition process (urbanization, development of the service industry and agricultural and industrial modernization). The socio-economic profiles of the households, included between the two points that represent the populations of medium cities (15,000 to 100,000 inhabitants) and large cities (100,000 to 500,000 inhabitants), are therefore distinguished by the importance of the middle and even upper urban classes in the case of Baja California, Coahuila, Jalisco and Aguascalientes. Lastly, unlike the situation of extreme poverty in the three southwest states, the average social conditions for households in the state of Nuevo Léon (metropolis of Monterey) and certainly Mexico City (Federal District) appear to be strongly pushed upwards due to high incomes generated by accumulated capital in modern industry and specialized services.
For households of indigenous speakers, we can deepen the investigation of socio-economic heterogeneity using the projection of the country’s main ethnic groups onto the factorial plane (Diagram 3).
As expected by the distribution of types of households on the social scale, all the mean socio-economic profiles for households of indigenous language speakers are concentrated in the working and poorest class; this attests to the socio-economic boundary that separates them from indigenous households that no longer use their indigenous language. Within the population of indigenous-language speakers, three subsets have been distinguished (ellipses drawn in dotted red lines). The first one, composed of Chol, Tzotzil and Tzeltal households (the largest ethnic groups in Chiapas), is the most entrenched in terms of poverty and marginalization due to their exclusion from access to resources: housing, education, employment, public and social services, household goods, etc. As we have seen, this is a common trait for the entire population of Chiapas. Yet, in this already depressed local context, the indigenous ethnic groups are even more disadvantaged: within these communities, the percentages of households for whom the MPCI is below 400 pesos are 80% for the Tzotzils and the Chols and 77% among the Tzeltals (versus 60% for the state average) and for whom illiteracy rates are 70%, 62% and 67% respectively (versus 44% for the state average. We cannot help considering these important gaps as one of the key factors for the start of the neo-Zapatista uprising; its leaders regularly point out this situation in public speeches and statements through the press or the Internet. The second subset, the largest, is concentrated in the lower half of the working class where, very likely, a high percentage of households fall below the threshold of 400 pesos per capita. Located here are the largest ethno-linguistic groups of the country’s center and north—Nahuatl, Huasteco, Mixteco, Chinanteco, Mixe, Mazateco, Totonaca and Tarahumara—as well as all the households of speakers of other indigenous languages. The last group, composed of Mayan, Zapotecos, Purepecha, Otomi and Mazahua households, occupies a relatively better socio-economic position in the upper half of the working class.
These socio-economic inequalities result from multiple causes interacting within a space that has been extremely divided up in terms of local and regional development, which characterizes the Mexican territory. Therefore, migrations play a large role in socio-ethnic
differentiation. “Regions of refuge” (Aguirre Beltran, 1973) is the most frequently used— but also discussed—explanatory model in Mexico. The indigenous populations that are the most isolated geographically and in terms of access to technology and infrastructure (roads, electricity, telephone, etc.) have been excluded the most from national development. This is typically the case for the Indians of Chiapas who, for the great majority, without any migratory dynamics outside of the state are still assigned residence in completely insulated territories. The same isolation characterizes the Sierra Tarahumara but with older and more marked emigration. Clearly, intensive migrations toward cities and the agro-industrial regions of Mexico and the United States do explain the greatest part of socio-economic progression, limited yet global, of large ethnic groups from northern and central Mexico (Nahuatl, Huasteco and Mixteco) and their integration into the working class. Finally, for the third group, the best socially and economically “integrated” one, the articulation of two major factors can be advanced: access to education is combined with migration toward cities to allow for massive professional integration in the service sector. This has been the case for a long time among the Zapotecs and the Purepechas whose long tradition of education has enabled their penetration into civil service and more recently, trade. With the development of tourism in the Yucatan and Quintana Roo, the Mayans have valorized their educational and cultural capital in this sector for about 20 years now. However, despite relatively high salaries in the national context, the parallel rise in the cost of living in tourist areas hinders their social mobility in the regional context, leading to migrations of greater distances. The Otomis and the Mazahuas, who generally do not have as much educational capital as the other groups, have been pioneers, following the Mixtecos and other Nahua groups, in the massive migration toward the country’s large cities—Mexico City, Monterrey and Guadalajara—and border cities (Tijuana, Mexicali, Ciudad Juarez, etc.), where they work in artisan activities, industry and informal business. Therefore, overall, social and economic integration of the various indigenous groups of Mexico is to a large extent dependant on their mobility and capacity to interact with regions and social sectors that are better positioned in terms of technology, business, industry or access to infrastructure. However, despite these factors of social heterogeneity common to the indigenous and non-indigenous populations, it must be noted that with just nearly one exception, all the ethnic groups occupy an average socio-economic position below the average for the population of their state of origin. The only case where this relationship is the opposite is for the Zapotecs who are on average less marginalized than Oaxaca’s population overall. The explanation is paradigmatic of the relationships between social differentiation, economic geography and ethnic segregation because it depends on a combination of three factors: their tradition for improved education going back further than any other groups; their position within the Mexican institutional apparatus since the 19th century (with the symbolic image of President Benito Juarez); their mobility toward cities and integration into the bureaucracy and teaching profession.
Conclusion
The high level of segregation for the Mexican indigenous population has been verified by many anthropological and socio-demographic studies; the latter are most often based on synthetic demographic and poverty indexes (Fernández Ham 1993, Serrano, Embriz Osorio and Fernández Ham 2002, Lartigue and Quesnel, eds. 2003). Our analysis enables a better understanding of the diversity and accumulation of factors related to economy, place of residence, access to education and employment, etc., which determine the level of poverty of the indigenous population.
The sheer range of socio-economic inequalities between households involves the three dimensions that we have analyzed: (i) linguistic characteristics and household composition; (ii) spatial segmentation of economic development; and (iii) ethnic identity. Taken independently, each one produces considerable differentiation where the amplitude, nearly
equal for the three, covers approximately two-thirds of the socioeconomic scale conveyed by the first axis. However, the centers of gravity for the three clouds of points have clearly shifted. In increasing order of social conditions, the mean point for ethnic groups (all indigenous households based on speakers) is followed by the one for indigenous households and lastly the one for all Mexican households. This gap provides a measurement for the gross socio-economic disadvantage for the different categories of indigenous households. Yet, the analysis also clearly reveals that ethnic identity does not act independently of other social differentiation factors. On the contrary, strong statistical relationships exist between the various gradients in the study. At the bottom of the social scale, the most traditional and homogeneous linguistic identity on the household level coincides with belonging to most underprivileged ethnic groups and living in territorial contexts that have experienced the most marginalization in terms of economic and social development. At the other extreme of the hierarchy are the most biologically and culturally mixed households and the most mobile or best integrated due to their migratory dynamics toward central and reticular spaces of economic activity and the most developed territories. Specifically how much does each factor (net differences) contribute in explaining the gross differences observed within and between all indigenous households?
Once again, the recurring question in sociological or anthropological studies regarding ethnic discrimination has been posed here through descriptive statistics—and in concrete terms with the example of the Zapotecs—: What is the ethnic component—or even the ‘racial’ one as in the concept of racial domination developed by L. Wacquant (1997)—of socio-economic segregation faced by the indigenous population? The statistical response implies to reason, all other things being equal, by controlling for all households the main variables that determine their social conditions: “individual” variables (household composition, age and sex of HoH, educational level and type of employment for working population, migration, etc.) and contextual factors (geographic location of the place of residence, size of the locality, local socio-economic development indicator, ethnic context, social and political public movements, etc.). This approach consists in making inferences on explanatory factors by using linear or logistic models; however, this falls outside of this article’s framework. It is developed, from a multi-level analysis of the demographic and socio-economic characteristics of Mexico’s indigenous population, by Delaunay (2005) and will be revisited with logistic regressions by Barbary and Martinez in a forthcoming article.
References
Aguirre Beltran G., 1973, Teoría y práctica de la educación indígena. Fondo de Cultura Económica, México.
Barbary O., Urrea F. eds., 2004, "Gente negra en Colombia: Dinámicas sociopolíticas en Cali y el Pacifico", co ed. IRD/Universidad del Valle, Cali, 539 p.
Barbary O. and Muller L., 2006, “Anuario estadístico de los datos del censo 2000 sobre los hogares indígenas mexicanos”, Guadalajara, sep. 2006, 144 p.
Barbary O. (coord.), 2006, Seminaire Internacional IRD-CIESAS : "Construcción y uso de las variables étnicas en las estadísticas publicas: lógicas y dinámicas intra e internacionales, Cocoyoc, 11-13 octobre 2006, actes p.
Barbary O., Martinez Casas R., 2008, Un fait social ‘total’ : la ségrégation des indigènes au Mexique, forthcoming CIESAS/ IRD Ed, Mexico D.F.
Beaucage, P., 1987, "Démographie, culture, politique : la condition indienne au Mexique",
Benzécri J.-P., 1973, L’analyse des données. Tome 2 : L’analyse des correspondances (2eme éd. 1976), Dunod, Paris.
Benzécri J.-P. and Benzécri F., 1980, Pratique de l’analyse des données. Tome 1 : Analyse des correspondances et classification : exposé élémentaire, Tome 2 : Abrégé théorique : étude de cas modèles, Dunod, Paris.
Cifuentes, B., 1998, Historia de los pueblos indígenas de México: Multilingüismo a través de la
historia, INI, Mexico
CONAPO, 1997, « La population indigène », in La situation démographique du Mexique, Conseil National de la Population, Mexico.
CONAPO, 2001, «Evaluation de la population indigène mexicaine», in La population du Mexique
au nouveau siècle, Conseil National de la Population, Mexico.
De la Peña, G. y Martínez Casas, R., 2005, Pobreza, exclusión social y procesos culturales: perspectivas antropológicas. En Mónica Gendrau (coord) Los rostros de la pobreza IV. Universidad Iberoamericana, México, pp: 69-95.
De la Vega Estrada S., 2001, Índice de desarrollo social de los pueblos indígenas, INI-PNUD, Mexico D.F.
Delaunay D., 1995, « Fracturas espaciales de un desarrollo discriminatorio ». Estudios
Demográficos y Urbanos, vol. 10, n°2 : pp. 347-374.
Delaunay D., 2005, ‘Análisis individual y contextual en la identificación de los pueblos indígenas
de México (1990-2000)’, paper presented at the Conference “Pueblos indígenas y
afrodescendientes de América Latina y el Caribe: relevancia y pertinencia de la información sociodemográfica para políticas y programas”, CEPAL, Santiago de Chile, April 27-29 2005, 17 p.
Dauzier, M., 1997, “Elites indiennes au Chiapas. Création sous influence et réappropriation ethnique, 1970-1995”, Caravelle n° 67, Toulouse, pp. 155-169.
Fernández Ham, P. 1993, La mortalité infantile parmi la population indigène. Retard et contrastes, in Demos (6). Carta demográfica de México,, UNAM, Mexico.
Fernández Ham, P. 1998, Montants de la population indigène. Trois approchements analytiques», in Demos (11), Carta demográfica de México, UNAM, Mexico.
Fernández Ham P., 2000, La population indigène. Parlants et régions indigènes, in Demos (13), Carta demográfica de México,, UNAM, Mexico.
Florescano, E., 1997, Etnias, estado y nacion : ensayo sobre las identidades colectivas en México, México, Aguilar, 511 p.
Gros Ch., 1998, Pour une sociologie des populations indigènes et paysannes de l’Amérique Latine, L’Harmattan, Paris, 304 p.
Gros Ch., 1999, « Paradojas de la identidad », Análisis Político, n° 36.
Jansen E. and Martinez Casas R., 2004, ‘Una propuesta para estimar la población indígena en
México, a partir de los datos censales’, Ciesas – Guadalajara, reprogaph. 12p.
Lartigue F. and Quesnel A coords., 2003, Las dinámicas de la población indígena, cuestiones y
debates actuales en México, Ciesas, Ird, Miguel Ángel Porrua eds., México, 470 p.
Lavaud J.P. Lestage F., 2005 « Compter les indiens : Bolivie, Etats-Unis, Mexique », L’Année Sociologique, vol 55, n°2, p. 487-520.
Martinez Casas R., 2002, La comunidad moral como comunidad de significados: el caso de la
migración otomí en la ciudad de Guadalajara, en Alteridades, Vol. 23, pp. 125-139.
Serrano Carreto E., Embriz Osorio A. and Fernández Ham P., eds., 2002, Indicadores
socioeconómicos de los pueblos indígenas de Mexico, 2002, INI-PNUD, CONAPO Mexico
D.F.
Stavenhagen, R., 1992, « La cuestion étnica : algunos problemas teórico-metodológicos », Estudios
Valdés L. M., 1998, Estimation de la population indigène du Mexique, Faculté D’Humanités,
UNAM, Mexico
Various authors (Varios autores), 1985 ¿Existe demografía étnica? Mesa redonda, Coordinación de Humanidades, UNAM, México.
Wacquant L., 1997, For an Analytic of Racial Domination, Political Power and Social Theory, vol 11.
Wade P. 1997, Race and ethnicity in Latin America. Critical studies on Latin America, Pluto Pres, Chicago.
Annex: Glossary of the modalities contributing to the two first factors of the MCFA (contributions to one of the two axes are higher than two times the mean contribution)
Abbreviations Used in the Diagrams Modality of the Variable
Housing construction materials
P_Madera Wooden walls
T_losa Terrace roof
T_metal Sheet metal roof
T_prec Roof of temporary materials
Madera Wooden or parquet floor
Tierra Dirt floor
Water supply and sanitation equipment in home
Pozorio External well or river
Viv_td Running water every day
Sanitconecta Toilet connected to system
Sanitsina Outhouse or toilet without water
Sinsanit No toilet
Electricity supply in home
Redpúb Connected to system
Noelectr No electricity
Cooking fuel
Gas Gas
Leña Firewood
Garbage collection
Basu_diar Daily collection
Basu_quem Garbage burned
Household equipment indicator in consumer goods
Equip=0 No equipment
Equip]0;4[ Very insufficient equipment
Age of head of household
Jh>59 Age 60 and older
Sex of head of household
Jh_M Woman
Marital status of head of household
Casad Married
Solter Single
Viud Widowed
Education level of head of household
Jh_EstudSup Higher education
Jh_Ningun No education
Education level of partner of head of household
C_Ningun No education
C_Nivacnoapl Non-applicable
C_Prim Primary education
C_Secund Secondary education
No School attendance for children age 7–15
Nasist7_15=0 attendance for all children
Nasist7_15na Non-applicable
Illiteracy among persons age 10 and older in the household
Analfa1 One person
Analfa2y+ Two persons or more
Mean education level of household (mean number of years of schooling for age 15 and older)
Abbreviations Used in the Diagrams Modality of the Variable Household composition
Nuc_compl Complete nuclear
Nuc_incomp Incomplete nuclear
Unipers Single-person
Mean number of live births for women age 14–49 for household
Hnv[0;1[ [0; 1[
Hnv[3;5[ [3 ; 5[
Total dependency rate: Number of household members/Number of working members
Td5y+ 5 persons or more per working member
Tdna No working household members
Juvenile dependency rate: Number of persons in the household below age 15/Number of working household members
Tdj0 No under-15 years household members
Tdj[2;3[ [2 ; 3[
Tdj[3;5[ [3 ; 5[
Tdjna No working household members
Overcrowding in dwelling: Number of persons in household/Number of rooms in dwelling
Hac[0;0.5[ [0 ; 0.5[ Hac[0.5;1[ [0.5 ; 1[ Hac[1;1.33[ [1 ; 1.33[ Hac[1.33;2[ [1.33 ; 2[ Hac[2;3.5[ [2 ; 3.5[ Hac[3.5 et +[ [3.5 & + [
Socio-professional category of the head of household
Busca Unemployed searching for work
TrabajCP_Agropec Independent farmers
Income per capita in the household (Mexican pesos)
Ipc=0 0 Ipc]0;400[ ]0 ; 400[ Ipc[400;800[ [400 ; 800[ Ipc[800;1600[ [800 ; 1600[ Ipc[1600;3200[ [1600 ; 3200[ Ipc3200y+ 3200 & +
Synthetic indicator of household social conditions
Condsoc0 Very Low
Condsoc]0;1.5[ Low
Condsoc[1.5;3.4[ Medium-Low
Condsoc[3.4;6[ Medium
Condsoc[6;10[ Medium-High
Condsoc[10;21[ High
P_Madera
T_losa T_metal T_prec
Madera Tierra Pozorio Viv_td Sanitconecta Sanitsina Sinsanit Redpúb Sindren Noelectr Gas Leña Basu_diar Basu_quem Equip=0 Equip]0;4[ Jh>59 Jh_M Casad Solter Viud Jh_EstudSup Jh_Ningun C_Ningun C_Nivacnoapl C_Prim C_Secund Nasist7_15=0 Nasist7_15na Dejonoapl Analfa1 Analfa2y+ Cedu0 Nuc_compl Nuc_incomp Unipers Hnv[0;1[ Hnv[3;5[ Hnvdesc Td5y+ Tdna Tdj0 Tdj[2;3[ Tdj[3;5[ Tdjna Hac[3.5 et +[ Hac[0.5;1[ Hac[0;0.5[ Hac[1.33;2[ Hac[1;1.33[ Hac[2;3.5[ Busca TrabajCP_Agropec Ipc3200y+ Ipc=0 Ipc[1600;3200[ Ipc[400;800[ Ipc[800;1600[ Ipc]0;400[ Condsoc0 Condsoc21y+ Condsoc[1.5;3.4[ Condsoc[10;21[ Condsoc[3.4;6[ Condsoc[6;10[ Condsoc]0;1.5[ CentrSalud
Ménages non indigènes
Ménages indigènes
Desc nloc decl 29.860
Desc loc mono 617
Desc loc bil ndecl 126.997
Desc loc bil decl 7.054 Asc nloc decl
3.568 Asc loc mono
580 Asc loc bil ndecl
36.033
Asc loc bil decl 8.522 Cm ou c nloc decl
128.701
Cm ou c loc mono 278.713
Cm ou c loc bil ndecl 554.308
Cm ou c loc bil decl 407.709
Cm & c nloc decl 100.065
Cm & c loc mono 104.882
Cm & c loc bil ndecl 284.545
Cm & c loc bil decl 506.274 -1,5 -1 -0,5 0 0,5 1 1,5 2 2,5 3 -1,5 -1 -0,5 0 0,5 1 1,5 2 2,5
variables actives moyenne des ménages non indigènes moyenne des ménages indigènes types ménages indigènes
Upper class Middle class Working class Extreme poverty Complete households
(nuclear, extended, composite) Incomplete households (nuclear, extended, composite) Female HoH
Single-person household
Diagram 1: MFCA of the household data table : 37 active variables (205 modalities), projection of ethno-linguistic types as supplementary elements Plane 1x2 : 75% of the cloud's inertia, axis 1 (54%, socioeconomic segmentation), axis 2 (21%, household demographic composition and differentiation)
1. total monolingual speakers : 14.9% of Indigenous households (IHs)
2. total bilingual speakers/self-identified : 36.1 % of IHs 3. total bilingual speakers/non-self-identified : 38.8 % of IHs. 4. total non-speakers/self-identified : 10.2% of IHs
Cent rSalud Condsoc] 0;1.5[ Condsoc[ 6;10[ Condsoc[ 3.4;6[ Condsoc[ 10;21[ Condsoc[ 1.5;3.4[ Condsoc21y+ Condsoc0 Ipc] 0;400[ Ipc[ 800;1600[ Ipc[ 400;800[ Ipc[ 1600;3200[ Ipc=0 Ipc3200y+ TrabajCP_Agropec B usca Hac[ 2;3.5[ Hac[ 1.33;2[ Hac[ 0;0.5[ Hac[ 0.5;1[ Hac[ 3.5 et +[ Tdjna Tdj[ 3;5[ Tdj[2;3[ Tdj0 Tdna Td5y+ Hnvdesc Hnv[ 3;5[ Hnv[0;1[ Unipers Nuc_incomp Nuc_compl Cedu0 A nalf a2y+ A nalf a1 Dejonoapl Nasist7_15na Nasist7_15=0 C_Secund C_Prim C_Nivacnoapl C_Ningun Jh_Ningun Jh_EstudSup V iud Solt er Casad Jh_M Jh>59 Equip] 0;4[ Equip=0 B asu_quem B asu_diar Leña Gas Noelect r Sindren Redpúb Sinsanit Sanit sina Sanit conect aV iv_t d
Pozorio Tierra M adera T_prec T_met al T_losa P_M adera Loc500y+ Loc<2,5 Loc[ 100;500[ Loc[ 15;100[ Loc[ 2,5;15[ Zacat ecas Y ucatan V eracruz Tlaxcala Tamaulipas Tabasco Sonora
San Luis Pot osi
Sinaloa Quintana roo
Querat aro Puebla
Oaxaca Nuevo Leon Nayarit M orelia M ichoacan M éxico Jalisco Hidalgo Guerero Guanajuato Durango Dist rict o Federal
Colima Coahuila
Chihuahua
Chiapas Campeche
B aja Cal. Sur B aja Calif ornia
A guas Calient es
M énag es ind ig ènes M énag es no n ind ig ènes
-1,5 -1 -0,5 0 0,5 1 1,5 2 2,5 3 -1,5 -1 -0,5 0 0,5 1 1,5 2
va r a c tiva s Ta m de Lo c de re s id Es ta d de re s id M é na ge s indigè ne s M é na ge s no n indigè ne s
Diagram 2 : M FCA of the household data table : 37 active variables (205 modalities), projection of the households' residence context (Federal states, locality size) Plane 1x2 : 75% of the cloud's inertia, axis 1 (54%, socioeconomic segmentation), axis 2 (21%, household demographic composition and differentiation)
S ingle -pe rs o n ho us e ho lds
Inc o m ple te ho us e ho lds (nuc le a r, e xte nde d, c o m po s ite ) F e m a le Ho H
C o m ple te ho us e ho lds (nuc le a r, e xte nde d, c o m po s ite )
CentrSalud Condsoc]0;1.5[ Condsoc[6;10[ Condsoc[3.4;6[ Condsoc[10;21[ Condsoc[1.5;3.4[ Condsoc21y+ Condsoc0 Ipc]0;400[ Ipc[800;1600[ Ipc[400;800[ Ipc[1600;3200[ Ipc=0 Ipc3200y+ TrabajCP_Agropec Busca Hac[2;3.5[ Hac[1;1.33[ Hac[1.33;2[ Hac[0;0.5[ Hac[0.5;1[ Hac[3.5 et +[ Tdjna Tdj[3;5[ Tdj[2;3[ Tdj0 Tdna Td5y+ Hnvdesc Hnv[3;5[ Hnv[0;1[ Unipers Nuc_incomp Nuc_compl Cedu0 Analfa2y+ Analfa1 Dejonoapl Nasist7_15na Nasist7_15=0 C_Secund C_Prim C_Nivacnoapl C_Ningun Jh_Ningun Jh_EstudSup Viud Solter Casad Jh_M Jh>59 Equip]0;4[ Equip=0 Basu_quem Basu_diar Leña Gas Noelectr Sindren Redpúb Sinsanit Sanitsina Sanitconecta Viv_td Pozorio Tierra Madera T_prec T_metal T_losa P_Madera Chinanteco Chol
Langues non spec. Indigènes non locuteurs Huasteco
Maya Mazahua Mazateco Mixe Mixteco Nahuatl
Otomi Autres langues
Purepechea Taraumara Totoneco Tzeltal Tzotzil Zapoteco
Ménages non indigènes
Ménages indigènes -1,5 -1 -0,5 0 0,5 1 1,5 2 2,5 3 -1,5 -1 -0,5 0 0,5 1 1,5 2
variables actives Groupes ethnique des ménages locuteurs Moyenne des ménages non indigènes Moyenne des ménages indigènes
Upper class Middle class Working class Extreme poverty
Complete households (nuclear, extended, composite) Incomplete households (nuclear, extended, composite) Female HoH
Single-person households
Diagram 3 : MFCA of the household data table : 37 active variables (205 modalities), projection of linguistic groups of speakers