HAL Id: hal-02591769
https://hal.inrae.fr/hal-02591769
Submitted on 15 May 2020HAL is a multi-disciplinary open access archive for the deposit and dissemination of sci-entific research documents, whether they are pub-lished or not. The documents may come from teaching and research institutions in France or abroad, or from public or private research centers.
L’archive ouverte pluridisciplinaire HAL, est destinée au dépôt et à la diffusion de documents scientifiques de niveau recherche, publiés ou non, émanant des établissements d’enseignement et de recherche français ou étrangers, des laboratoires publics ou privés.
Aquastress D2.1.3 - Report on indicators for water stress
C. Sullivan, M. Manez, S. Schmidt, E. Moors, E. Preziosi, S. Loubier, D.
Inman, K. Tarnacki, I. van den Wyngaert, A. Olsthoorn, et al.
To cite this version:
C. Sullivan, M. Manez, S. Schmidt, E. Moors, E. Preziosi, et al.. Aquastress D2.1.3 - Report on indicators for water stress. irstea. 2006, pp.81. �hal-02591769�
Doc Name: Deliverable ID: WP2.1-D2.1-3.pdf Date: 24/01/2007
Revision: 12.0 MM 1 Public
AquaStress
Mitigation of Water Stress through new Approaches to Integrating
Management, Technical, Economic and Institutional Instruments
Integrated Project
D 2.1.3
R
EPORT ONI
NDICATORS FORW
ATERS
TRESS Author(s): C.A. Sullivan1, M. Manez2, S.Schmidt2, E.Moors3, E. Preziosi4, S. Loubier5, D. Inman6, K. Tarnacki7, I van den Wyngaert3, A.F.M.
Olsthoorn3, Jochen Fröbrich8, Bettina Blümling2 Koundouri
,P. David Jones
9, S. Panebianco2, A.M. Giacomello1,
Dirk Günther2, and 1
Contact for queries: Dr. Maria Manez
Dissemination Level
Deliverable Status: PU Final report
1 Centre for Ecology and Hydrology, Wallingford UK 2 USF – University Osnabrück, Germany
3 Alterra, Netherlands 4 IRSA- Rome, Italy
5 CEMAGREF, Montpelier, France 6 University of Cranfield, UK 7 University of Aachen, Germany 8 University of Hannover, Germany
9 Department of Economics, University of Reading, UK.
CemOA
: archive
ouverte
d'Irstea
SUMMARY
This report provides a detailed overview of the development of an integrated tool for evaluation conditions of water stress, to be referred to as the Aquastress Water Stress Matrix (AWSM). This tool combines a selection of information relevant for water management decision making, and has at its core, a composite index of water stress, here referred to as the Aquastress Water Stress Index (AWSI). In addition to this composite index, the details of this index are presented in ways that can be visualised, as a means of overcoming the problem of providing complex water stress information as a single number. The framework allows including further information for decision makers within this matrix, like mapped and photographic evidence relating to the specific site under examination, as well as guidance, using a traffic light approach, on the urgency of the situation.
After a brief reminder of the objectives within the Aquastress project, underlying assumptions and a glossary of terms are presented. Some detail is then provided on the structure and various parts of the Aquastress Water Stress Matrix. A detailed explanation is given on how the Aquastress Water Stress Index is calculated, and how it is to be interpreted to provide an insight into the nature of the water stress problem at the site in question. Through an examination of the sources of water at the site, this index can be used to evaluate water stress in a test site as well as in so called sectors like industry or agriculture. It aims at identifying causes of water stress and interdependencies between water uses and water resources. In addition, the sectoral information provided in the index, and related suggested methodology to include thresholds, assist the users to identify possible stress mitigation options. The discussion of potential sectoral variables to be included in the AWSI is included in the text.
The process of application and use of the Aquastress Water Stress Matrix (and its core index) is then presented. This provides some guidance on the procedure to be followed in implementing this tool, and it also suggests roles for both practitioners and stakeholders in this process. Some tentative conclusions and recommendations for next steps are provided.
As a way of supplying additional supplemental information to the reader of this report, a number of appendices are added. These address the definition and classification of indicators and indices, data requirements, and technical issues concerning weighting and standardising of component scores. Problems such as double counting, determination of thresholds and interpretation of indices are considered. Conventional approaches to assessing water stress and existing in-use indices are briefly reviewed, and a brief overview of relevant issues at the Aquastress test sites is presented.
There is no doubt that the task to develop an effective and holistic measure of water stress is a complex one, but such a tool has an important role to play in decision-making for Integrated Water Resources Management. This will be of use as it will provide water managers and stakeholders with a common knowledge base, making comparisons between different places and conditions more meaningful. This is particularly necessary where water has to be managed in transboundary basins, and it will also provide the basis on which temporal comparisons can be made to assess progress in the water sector.
Managing social, economic and natural resources in such a way as to ensure that future generations have the same level of opportunities as current generations is a crucial challenge for sustainable development. This means that the spatial, temporal and social tradeoffs must be
CemOA
: archive
ouverte
d'Irstea
Doc Name: Deliverable ID: WP2.1-D2.1-3.pdf Date: 24/01/2007
Revision: 12.0 MM 3 Public
considered and managed within the constraints of the physical and social systems. This forms the basis of our design of the water stress index for the Aquastress project.
In the development of the Aquastress Water Stress Index (AWSI), therefore, we are aiming to capture the range of issues relevant to the test sites, and from these, create a composite framework which will help to identify the causes of water stress. In order to capture and deliver a broader range of information than can be provided through a mathematically based index, we then combine this index with other, more qualitative issues, in the format of a Matrix, which is designed to provide a useful set of information for management and policy purposes. The criteria for measuring which information is useful for such purposes are determined by what is:
• politically relevant / relevant for decision makers
• scientifically valid and reliable10
• easy to explain / to understand
This last criterion is crucial when information must be delivered to politicians, the press and the general public, as required in any process of water management. In keeping with the objectives of the project overall, it is hoped that this work will be of use to the wider public in the EU, and may become applicable in areas outside of the test sites. For this reason we are aiming to produce a generically applicable tool, but for the purpose of the Aquastress project, it is hoped that this Aquastress Water Stress Matrix will be useful for determining the degree of water stress in the test sites. Moreover the matrix could be useful to those who wish to determine what solutions should be applied to the specific needs of each site, thus providing a link between WBs 1 and 3.
10 Validity measures the degree to which an indicator represents the characteristic it claims to, and reliability indicates
that the indicator will represent that characteristic repeatedly over time.
CemOA
: archive
ouverte
d'Irstea
Glossary of terms and definition of words used in this report as result of WB 2 work
AQUASTRESS WATER STRESS INDEX (AWSI) - a composite index to assess water stress,
developed for the Aquastress project
CATEGORY – a specific dimension of each component included in an index (four all together:
quantity and quality, capacity, infrastructure and social and economic equity)
COMPONENT – a specific section within a composite index
COMPOSITE INDEX – an index constructed by combination of a selection of individual parts or
components
FORMULAE – the mathematical structures by which components are combined to form an index INDICATOR – a specific piece of information or data which represents a specific issue or condition INDEX – a mathematical structure by which different information is combined – usually based on
indicator data (difference between formulae and index is not clear, but I guess that this is based on Carolines suggestion… I would have used other definition:
index: mathematically aggregated/built number derived from a series of observations or data or components, used as an indicator or measure (might sound very Sonja….)
INFRASTRUCTURE – constructed application of physical technology
INSTITUTIONAL AND ADAPTIVE CAPACITY – ability of organisations and individuals or groups to
adapt to changing conditions
INTEGRATED SECTORAL WATER STRESS INDEX (ISWSI) – a composite index representing
water stress in different sectors, combined to give an integrated evaluation
MATRIX – a combination of information to provide an integrated and holistic set of knowledge on
which decisions can be made
NATURAL BASELINE ENDOWMENT- this takes into account all the parts of the water balance
which are naturally available due to effective precipitation inside the test site area, as well as all the water flows which enter naturally into the system: river discharge from upstream, groundwater flow (potentially usable), spring discharge, etc. including both renewable surface water and groundwater
POTENTIAL MARGIN – this is a measure of how close a water system is to reaching the limits of its
natural baseline endowment
SECTOR – part of economic activity representing different water uses (includes the environment) SOCIAL AND ECONOMIC EQUITY – a state resulting from the equitable distribution of resources
between different members of society
VARIABLE – a number representing a specific indicator
WATER STRESS - condition in which water demand exceeds water supply. This has been defined
specifically in WB2 as Water stress occurs when the functions of water in the system do not reach the standards1 (of policies) and/or perceptions (of the population) on an appropriate quantity and quality, at an appropriate scale and the adaptability for reaching those is not given1.
WEIGHTING – the degree of importance attributed to a specific component or variable, within a
mathematical formula CemOA : archive ouverte d'Irstea / Cemagref
Doc Name: Deliverable ID: WP2.1-D2.1-3.pdf Date: 24/01/2007 Revision: 12.0 MM 5 Public
TABLE OF CONTENTS
SUMMARY...2 TABLE OF CONTENTS...5 LIST OF FIGURES ...7 LIST OF TABLES...8 1 INTRODUCTION...9 1.1 Rationale ...101.2 Assumptions behind the work presented ...11
1.3 THE CONCEPT OF AN AQUASTRESS WATER STRESS MATRIX ...11
1.3.1 Composite indices as holistic tools for water management...12
1.3.2 The concept of DPSIR in indicator development...12
2 THE STRUCTURE AND COMPONENTS OF THE AQUASTRESS WATER STRESS MATRIX (AWSM)...14
2.1 Introduction and rationale behind the water stress matrix...14
2.2 Water stress quantified in the Aquastress Water Stress Matrix through the use of a composite index ...15
2.3 Threshold scores for index component values...15
Using thresholds ...15
2.4 Graphical representation and interpretation of the water stress index ...17
2.5 The provision of additional qualitative knowledge through a commentary ...17
2.6 Geographical information and maps ...17
2.7 Application of the Aquastress Water Stress Index and Matrix in the test sites ...18
3 POTENTIAL SECTORAL VARIABLES FOR INCLUSION IN THE AWSI...19
3.1 Sectoral indicators...19
3.1.1 Domestic sector indicators ...19
3.1.2 Agriculture ...20
3.1.3 Industry-production...23
3.1.4 Industry -Tourism / Services...24
3.2 Environmental components for each sector ...24
4 STRUCTURE AND CALCULATION OF THE AQUASTRESS WATER STRESS INDEX (AWSI) - Suggested by the CEH team of WP 2.1...27
4.1 The objective of the Aquastress water stress index (AWSI) ...27
4.2 The proposed structure and components of the Aquastress water stress index (AWSI) 27 4.3 The Integrated Sectoral Water Stress Index (ISWSI)...28
4.4 Potential variables for inclusion in the ISWSI...32
4.5 Weighting index components and variables...32
4.6 The concept of the potential margin in the AWSI ...33
4.7 Definition of water resources used in the calculation of the potential margin...34
4.8 The formula for calculating the Aquastress Water Stress Index (AWSI)...36
4.9 Graphical representation of the AWSI...37
4.10 Interpreting the Aquastress Water Stress Index...41
4.11 Use of AWSI in a cost-effectiveness framework ...42
4.12 Displaying component parts of the AWSI for decision support ...42
5 CONCLUSIONS AND FUTURE WORK PLANS...44
5.1 Application of AWSM to support decision making...44
5.2 Further development of the AWSM ...44
CemOA
: archive
ouverte
d'Irstea
6 BIBLIOGRAPHY AND ADDITIONAL REFERENCES (includes references from appendices) 46
APPENDIX...51
A. TECHNIQUES OF CREATING INDICES...52
1. Definition and classification of indicators and indices ...52
2. The use of indices for policy dialogue...52
3. Classification of indicators ...55
List of indicators ...56
4. Creating maps from indicator data...58
5. Proxy variables and social factors in indices...58
6. Internationally used method for producing indices and index based maps...58
7. Criteria for good indicators...59
8. Conventional approaches to asses water stress...61
B. EXISTING WATER INDICES ...63
C. CONSIDERING NON-LINEAR MODELS FOR THE AWSI...71
D. SUGGESTION FROM CEH FOR A POSSIBLE PROCEDURE FOR BUILDING AND USING THE AQUASTRESS WATER STRESS MATRIX ...74
1. Calculation and application of the AWSM at the test sites...74
2. Steps in Calculating the Aquastress Water Stress Index (AWSI) ...74
3. Building the Aquastress Water Stress Matrix (AWSM) ...74
4. Stakeholder and Practitioner roles roles ...74
5. Communication and interpretation ...75
E. WB2 meetings on the AWSI...76
F. GENERAL VARIATIONS BETWEEN AQUASTRESS TEST SITES ...77
CemOA
: archive
ouverte
d'Irstea
Doc Name: Deliverable ID: WP2.1-D2.1-3.pdf Date: 24/01/2007
Revision: 12.0 MM 7 Public
LIST OF FIGURES
Figure 1: Linking issues in the Aquastress case studies (after J. Froehbrich)...9
Figure 2: The format of the Aquastress Water Stress Matrix (WB2-advances) ...14
Figure 3: Sectoral stress values...15
Figure 4: Example for geo-referenced results: Water Vulnerability Index Scores displayed through GIS...17
Figure 5: Components of the AWSI ...28
Figure 6: Structure and Components of the ISWSI...30
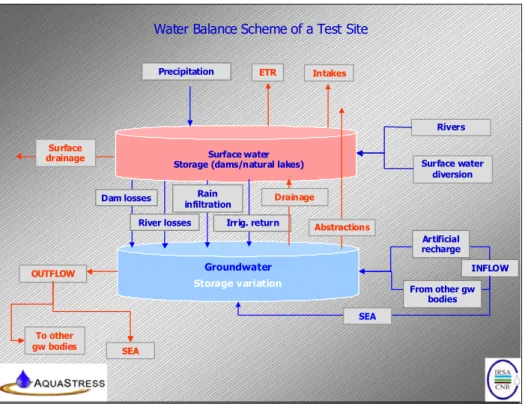
Figure 7: The water balance scheme of a test site ...36
Figure 8: Graphical representation of AWSI ...37
Figure 9: Key to translate figure 11 into the ‘traffic light’ system...38
Figure 10: Graphical representation of AWSI when external dependency is also included...41
Figure 11: Key to translate figure 13 into the ‘traffic light’ system...42
Figure 12: Cross-sectoral comparison ...43
Figure 13: Water indicators displayed through GIS ...53
Figure 14: Water utilisation intensity links water availability with demand for water ...65
Figure 15: Water Exploitation Index (%) across Europe 1990-2001 (EEA, 2004) ...66
Figure 16: WPI values for selected communities...67
Figure 17: National Water Poverty Index (WPI) values ...68
Figure 18: Human Development Index (2003)...69
Figure 19: Illustrating the CVI values for Western Europe...70
Figure 20: The impact of data transformation ...73
Figure 21: Sectoral contributions to GDP ...78
Figure 22: The contribution of tourism receipts to export revenue...78
Figure 23: Rainfall regimes in the test sites ...79
CemOA
: archive
ouverte
d'Irstea
LIST OF TABLES
Table 1: Potential mitigation options within the Aquastress project ...9
Table 2: Selected indicators for potential inclusion in the ISWSI...29
Table 3: A suggested core set of indicators for cross site comparison...31
Table 4: The Millennium Development Goals Target Indicators relevant to water stress ...53
Table 5: Selected water indicators in widespread use...63
Table 6: Selected indices related to water ...64
Table 7: Averaging indices...73
Table 8: Selected indicator values from four test sites ...80
Table 9: Potential problems of selected test sites...80 CemOA : archive ouverte d'Irstea / Cemagref
Doc Name: Deliverable ID: WP2.1-D2.1-3.pdf Date: 24/01/2007
1 INTRODUCTION
The development of an index of water stress, based on the development of a list of indicators as well as on the framework for the construction of an integrated/composite index is a key part of the work in WB2 of the Aquastress project. This has been considered to be an important output of the project, given the increasing incidence of water stress across Europe and other parts of the world. Furthermore it combines the results of WB 1 with the work in WB 3 as it is based on data
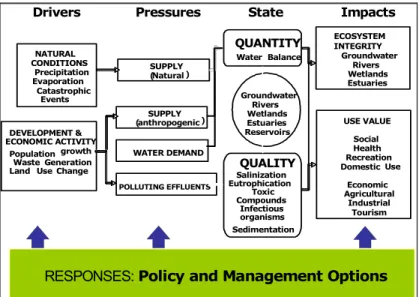
characterising the water stress situation in the test sites (WB1) and helping to define potential case study areas (WB3). How this fits with the rest of the project is illustrated in Figure 1 and Table 1
Figure 1: Linking issues in the Aquastress case studies (after J. Froehbrich)
NATURAL CONDITIONS Precipitation Evaporation Catastrophic Events DEVELOPMENT & ECONOMIC ACTIVITY Population growth Waste Generation Land Use Change
Drivers SUPPLY (Natural ) SUPPLY (anthropogenic ) WATER DEMAND POLLUTING EFFLUENTS QUANTITY Water Balance Groundwater Rivers Wetlands Estuaries Reservoirs QUALITY Salinization Eutrophication Toxic Compounds Infectious organisms Sedimentation ECOSYSTEM INTEGRITY Groundwater Rivers Wetlands Estuaries
Pressures State Impacts
USE VALUE Social Health Recreation Domestic Use Economic Agricultural Industrial Tourism RESPONSES PolicyandManagementOptions
RESPONSES: Policy and Management Options
Table 1: Potential mitigation options within the Aquastress project
WP 3.7 - Procedural methods WP 3.8 - Supporting sciences WP 3.4 - Practices for water saving WP 3.3 Technologies
for water saving
II Domain: Water
saving I Domain: Increasing
water availability
III Domain: Supporting change
IV Domain: Decision support for planning
WP 3.1 - Alternative
water sources
WP 3.2 - Integrated
management of
surface/groundwater
Technical options Non-technical options
WP 3.5 - Incentive mechanisms for balancing demand and supply WP 3.6 - Institutional analysis Revision: 12.0 MM 9 Public CemOA : archive ouverte d'Irstea / Cemagref
This output has been the result of a wide range of inputs from several project partners representing a number of different disciplines. It has been a produced attempt to offer a new approach to the problem of water stress assessment. An index-based approach has been chosen to provide a rapid appraisal methodology for application by stakeholders.
It is not intended that this approach should in any way replace conventional hydrological modelling or other water stress assessment techniques. It is intended to provide an analytical tool which enables a holistic evaluation to be made enabling better understanding of a complex situation which cannot easily be measured. It is hoped that this will be of use as a heuristic tool, to promote discussion by different groups of stakeholders. As such it can be described as a decision support tool which will function through the provision of a standardised set of relevant yet diverse information about the conditions underlying the required water management decision.
1.1 Rationale
Water stress is a global problem with far-reaching economic and social implications. The mitigation of water stress at regional scale depends not just on technological innovations, but also on the development of new integrated water management tools and decision-making practices. The Aquastress project delivers enhanced interdisciplinary methodologies enabling actors at different levels of involvement and at different stages of the planning process to mitigate water stress problems.
The Aquastress project will generate scientific innovations to improve the understanding of water stress from an integrated multisectoral perspective to support:
• diagnosis and characterisation of sources and causes of water stress;
• assessment of the effectiveness of water stress management measures and development of new tailored options;
• development of supporting methods and tools to evaluate different mitigation options and their potential interactions;
• development and dissemination of guidelines, protocols, and policies;
• development of a participatory process to implement solutions tailored to environmental, cultural, economic and institutional settings;
• identification of barriers to policy mechanism implementation;
• continuous involvement of citizens and institutions within a social learning process that promotes new forms of water culture and nurtures long-term change and social adaptivity. The project adopts a Case Study stakeholder driven approach and is organised in three phases: (i) characterisation of selected reference sites and relative water stress problems,
(ii) collaborative identification of preferred solution options,
(iii) testing of solutions according to stakeholder interests and expectations.
It will make a major contribution to the objectives of the Global Change and Ecosystems and supporting the Community Directive 2000/60/EC and the EU Water Initiative.
WB 2 in the Aquastress project is to determine a methodology to assess water stress. We have developed an integrated index for this purpose, and we have set it into the context of a matrix, to provide more comprehensive information through which decision makers can be better informed.
CemOA
: archive
ouverte
d'Irstea
Doc Name: Deliverable ID: WP2.1-D2.1-3.pdf Date: 24/01/2007
Revision: 12.0 MM 11 Public
1.2 Assumptions behind the work presented
In work of this type, it is important to consider the assumptions behind the design of the matrix and tools suggested here. The main assumptions are as follows:
• water is a necessary factor of production for all human activities, and is an essential component of the global life support system. We recognize therefore that water acts as a constraint in our system.
• human activities inevitably impact on the environment (through entropy) and for sustainable water management to be achieved, this must be managed within the boundaries of what are defined by society as acceptable risks (acceptability determined through participation of stakeholders). In the construction of the AWSI and AWSM, this will be addressed through thresholds where relevant.
• market forces usually determine how resources get allocated within human systems, and these market forces have sometimes to be modified by legislation, as a result of the externalities that market impacts create. (Market failures).
• the democratic process determines that all sectors of the economy and society should have equal access to the use of any resource, within the constraints of markets. This means that for the purpose of determining a baseline measure, we will assign an equal degree of importance (weighting) to each of the major components of the index we are developing. This will ensure that equal emphasis is placed on all sectors (this will avoid dominance of water allocation decisions by economically and politically powerful interest groups).
• the determination of weightings can be modified according to specific priorities of the location in question, and this may be implemented for actual decision making, rather than simple site comparison.
• weightings can be changed to reflect national priorities, but they must be determined by government and stakeholders in consultation to ensure the process is transparent and acceptable. Where index values are to be used for comparison, weightings will all be kept at parity.
1.3 THE CONCEPT OF AN AQUASTRESS WATER STRESS MATRIX
During the process of the literature review carried out during this project, and building on earlier work on index development by Aquastress project team members, it had been observed that there was some dissatisfaction in the use of indices in general. Statements are sometimes made about an index being too simple, or not comprehensive enough, with the methodology not allowing a sufficient breadth of knowledge to be included. While some of these criticisms may not be justified, it was decided early on during the work of WB2 to enrich the index concept through additional material relevant to the evaluation of water stress in any location. As a result, it was decided that the index developed in the project should be combined into a more comprehensive matrix
structure, to provide a richer knowledge-base as a tool for decision support. This matrix structure would provide a vehicle through which data from the Aquastress Water Stress Index could be visualised within the context of other visual material, provided in a comprehensive, standardised structure. This Matrix would be compiled in a convenient format, so that decision makers and other users could all have easy access to the relevant and available information, thus providing a
CemOA
: archive
ouverte
d'Irstea
heuristic tool through which consultative dialogue could be conducted. Under conditions of water stress, this would be a valuable tool as it would allow stakeholders with different perceptions to be presented with a rich and standardised set of information.
1.3.1 Composite indices as holistic tools for water management
While existing indicators may be of some use for sectoral planning, or for meeting specific legislative criteria, (e.g. for the WFD), the development of a new, specific and targeted index for water stress in the context of Europe and North Africa, will contribute to the potential for more holistic and integrated water resource management in that region. In this report, the Aquastress WB2 team is attempting to build on these indicator concepts to develop an integrated index, capturing a wide range of issues to represent a more holistic picture of the water stress problem. Water is regarded as a limiting factor in economic development when national withdrawals exceed a certain percentage of annual internally renewable resources. Water scarcity is worsened when a country falls in the category of low-income developing countries, because lack of financial,
technical, and other capacity give rise to a particular vulnerability to problems caused by water shortages. As a way of assessing these more complex issues, the Aquastress Water Stress Matrix (AWSM) is being developed, along with its related Index (AWSI) and it is hoped that this matrix, and index, through testing at the diverse Aquastress case study sites, will become robust and accepted as tools for integrated water management and macroeconomic planning across the European Community and beyond.
1.3.2 The concept of DPSIR in indicator development
A framework for water indicators in the European Union has been developed (Jesinghaus, 1998), and this has been the foundation for many indicators developed subsequently using the DPSIR approach. The DPSIR approach has become widely used to developing indicators. It is based on the concept that change occurs over a period of stages, which have been identified as:
• Drivers • Pressures • States • Impacts • Responses
In this approach, it is assumed that all aspects of any environmental change can be placed within one of these stages, and by identifying these stages, we are able to better represent what may be needed as an appropriate response. As a general framework, this can be used theoretically to characterize and manage any kind of environmental problem (Dhakal and Imura 2003, Odermatt 2004).
The DPSIR approach has been widely applied to many kinds of problems, in coastal environments, including bays and estuaries (Jorge et al. 2002, Bidone and Lacerda 2004, Cassazza 2002); river basins (Dietrich et al 2004, Walmsley 2002); or a combination of both (Trombino et al. 2003); groundwater studies (Cools et al. 2002), and wetlands (Turner at el. 2004)
Arguments have been made (European Environment Agency 1999), that the DPSIR approach permits the establishment of causal relationships between human activities, their environmental impacts, and the effects of societal responses. It is certainly true in some cases, that such cause and effects can be known (e.g. the link between lead emissions to the environment, and its impact
CemOA
: archive
ouverte
d'Irstea
Doc Name: Deliverable ID: WP2.1-D2.1-3.pdf Date: 24/01/2007
Revision: 12.0 MM 13 Public
on human health), and effective policy responses have been the result (e.g. the removal of lead from petrol).
Despite the great number of studies that utilize DPSIR as an analytical framework, few reports explicitly address its advantages. These studies seem to exclusively agree on its ability to organize and present environmental problems, and to help scientists and managers to think about processes in terms of causality (Jorge et. al 2002, Caeiro et al. 1999, Turner et al. 2004). Since DPSIR requires the establishment of causal relationships between sequences of indicators, it can be of great use where these are known, and in such cases, it undoubtedly constitutes an improvement over use of simple environmental indicators or aggregates of indicators, which may represent an over-simplification of the problem. There are however many cases where the issue to be managed within the environment is so complex that such a simple classification is rather meaningless, since the cause and effect linkages are not known. For the DPSIR approach to be really effective, accurate data, knowledge of dose response relationships, and observable measures of appropriate parameters are all needed, but unfortunately, all too often, these conditions do not exist.
A number of authors have put forward several disadvantages of the DPSIR approach. In some cases, isolated chains of indicators may not be enough to reproduce the complexity of systems (Bassel 1999, Rekolainen et al. 2003, Caeiro et al. 1999, Jorge et al. 2002), which tend to behave more like a network rather than a linear chain. Also, the need to assign a specific role (driver, pressure, state, etc.) to environmental indicators induces the creation of static categorizations, whereas in reality, for example, under certain conditions a response can become a driver.
In the case of the work done by Sullivan et al, (2002, 2003, 2005, 2006), on the development of the Water Poverty Index (WPI) and Climate Vulnerability Index(CVI), these problems have been avoided, by both not being tied to the DPSIR structure, and by being based on an analytical hierarchy after Saaty (1980). The Analytical Hierarchy approach of Saaty also provides the analytical framework for the Aquastress Water Stress Index. The structure suggested in this report goes beyond the DPSIR approach, by specifically linking supply and demand, and including a
range of related linkages. CemOA
: archive
ouverte
d'Irstea
2 THE STRUCTURE AND COMPONENTS OF THE AQUASTRESS
WATER STRESS MATRIX (AWSM)
2.1 Introduction and rationale behind the water stress matrix
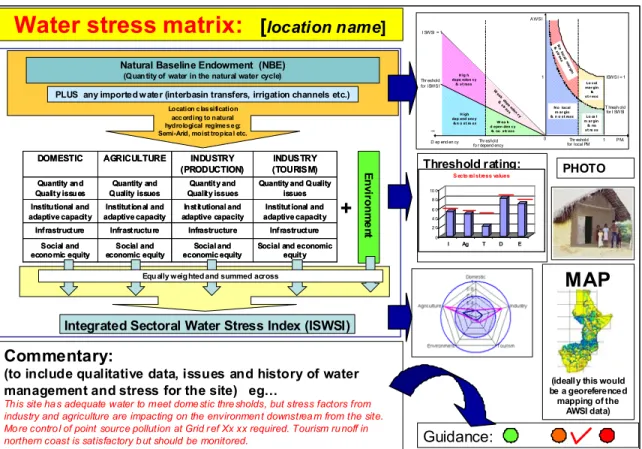
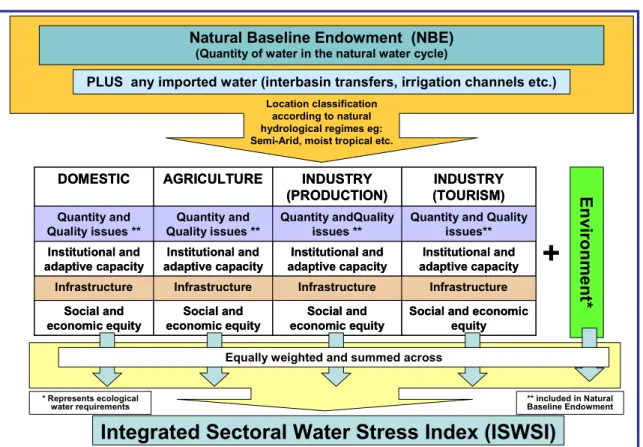
As explained in the previous section, the reason for building a matrix of information and knowledge, rather than simply providing a simple index value, is to provide all stakeholders with relevant information in an open and accessible way. Since it is widely recognised that knowledge is power, it is felt in this work that the conversion of disparate data into comprehensive knowledge is a worthwhile effort, and the dissemination of that knowledge to a wide range of users in an easy to understand way is a prerequisite for promoting more equitable decision making. Knowledge cannot always be quantified in such a way as to be used in a mathematical way, and so the use of a matrix as a vehicle for combination of different sorts of information will enable the knowledge generated through it to be more holistic and covering various disciplines. Furthermore this approach has the advantage that it takes into account not only hydrological and/or physical aspects of defining water stress but also social and economic dimension of water stress. An example of the format of the Aquastress Water Stress Matrix with its various knowledge attributes is shown in Figure 2.
Figure 2: The format of the Aquastress Water Stress Matrix (WB2-advances)
PLUS any imported water (interbasin transfers, irrigation channels etc.)
Natural Baseline Endowment (NBE)
(Quan tity of water in the natural water cycle)
Quantity and Quality issues Quantity and Quality issues Quantity and Quality issues Quantity and Quality issues
Social and economic equity Social and economic equity Social and economic equity Social and economic equity Infrastructure Infrastructure Infrastructure Infrastructure Institutional and adaptive capacity Institutional and adaptive capacity Institutional and adaptive capacity Institutional and adaptive capacity INDUSTRY (TOURISM) INDUSTRY (PRODUCTION) AGRICULTURE DOMESTIC
Integrated Sectoral Water Stress Index (ISWSI)
En vir o n m e nt
+
Equally weighted and summed across
Location c lassification according to natural hydrological regimes e g: Semi-Arid, moist tropica l etc.
Commentary:
(to include qualitative data, issues and history of water management and stress for the site) eg…
This site has adequate water to meet domestic thre sholds, but stress factors from industry and agriculture are impacting on the environment downstrea m from the site. More control of point source pollution at Grid r ef Xx xx required. Tourism runoff in northern coast is satisfactory but should be monitored.
Water stress matrix:
[
location name]Threshold rating: 0 2 0 4 0 6 0 8 0 10 0 I Ag T D E
S ecto ral stress values
MAP
(ideally this would be a georeferenced mapping of the AWSI data) Guidance: AWSI PML Thr eshold for local PM 1 T hresh old for I SWSI ISWSI = 1 N o local m ar gin & n o st ress Lo ca l m ar gin & no st re ss Lo cal mar gin & st r ess N o lo cal m ar gin & str ess 1 0 H igh dep end ency & n o st re ss H ig h depe nden cy & st ress W ea k d epen den cy & no str ess Thr eshold fo r depend ency W eak depe nden cy & str ess I SWSI = 1 Thr eshold for ISWSI -∞ D ep end en cy PHOTO CemOA : archive ouverte d'Irstea / Cemagref
Doc Name: Deliverable ID: WP2.1-D2.1-3.pdf Date: 24/01/2007
2.2 Water stress quantified in the Aquastress Water Stress Matrix
through the use of a composite index
Key elements of information needed to quantify water stress can be integrated through the mathematical framework of a composite index. This index is referred to here as the Aquastress Water Stress Index, and it forms an essential element of the AWSM. The values generated by this index provide the foundation of how the level water stress at any site can be evaluated. This level of water stress will be determined by an interaction of the supply of water (both local and imported), and the demand for that water from different sectors. A detailed explanation of how this index is calculated is provided in Section 3 below.
2.3 Threshold scores for index component values
Using thresholds
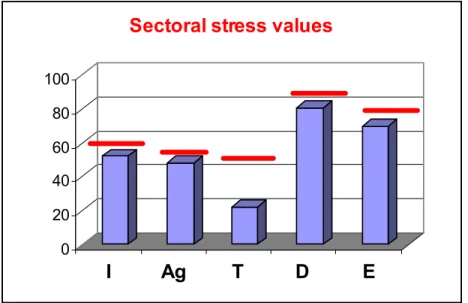
The Aquastress Water Stress Matrix will contain a lot of useful information for water managers and other decision makers. It will provide a numerical assessment of the degree of water stress existing at the site, and it will suggest from which sectors the stress is coming from. Further discussion will be needed on issues concerning interpretation, but at this stage, we suggest that thresholds are useful as a form of guidance for the interpretation of some of this information. The concept of thresholds is illustrated in Figure 3, which shows a set of hypothetical values and thresholds for the five component scores of the ISWSI. In the case shown, each component remains below the threshold, so the point of stress has not been reached in any sector. Some comments on how this may be addressed in the Aquastress project are provided in Figure 3.
Figure 3: Sectoral stress values
0 20 40 60 80 100
I
Ag
T
D
E
Sectoral stress values
Revision: 12.0 MM 15 Public CemOA : archive ouverte d'Irstea / Cemagref
Determining the thresholds: the example of the domestic sector and the environment
The concept of thresholds is discussed in the section on the structure of the AWSI, but it important to consider thresholds from different points of view. With regard to domestic thresholds - for the most simple measures (e.g. per capita water availability, or per capita consumption) demand thresholds will be is specific to a particular region, so applying a generic threshold may be problematic. If we want to understand the efficiency of use, that is simpler because we can use existing accepted standards, such as those relating to minimum requirements provided by Gleick, the WHO, Shuval etc. (see Domestic Sector report in D2.1-1).
The proportion of water used for domestic purposes varies considerably between the different Aquastress study sites. For example, in the Guadiana case, domestic water use accounts for only 4 -5% of total water use, rising to 9 -10% of the total water use in the Algarve, which takes account of tourism. In Flumendosa, domestic water use accounts for around 40% of total water use; while in Iskar, domestic water use accounts for 70%.
Considering that domestic water stress (due to water scarcity) is a real problem in all of these basins, and the proportion of domestic water use varies from 5-70% , using the proportions of sectoral water use alone cannot serve as a suitable threshold for indicators of water stress. An interesting activity would be to compare the fraction of sectoral water use (domestic, agriculture, industry, environment) with the total water exploitation index (WEI). This will indicate competition for water between sectors, as well as water stress in individual sectors, providing a kind of 3-dimensional analysis. This, along with year on year trends in sectoral uses (i.e. are they increasing or decreasing), would reveal interesting information. Thresholds also need to be identified for the environment sector, but this is not a simple task. The environmental indicators that have been defined are meant to indicate the severity of problems impacting on the environment. This includes indicators on the risks and quality of natural ecosystems. If water availability would normally limit growth in dry ecosystems, this is not considered water stress according to the definition in the project. In the project, as indicators of this type are only defined to describe water stress on a larger scale. When the water quality in a river is low, this means a threat to downstream nature reserves, e.g. Ramsar sites. This is also considered as water stress in this project.
In the case of the environmental indicators, values are compared with EU guidelines, when available. Most often these EU guidelines are described in the national reports that are made for the Water Framework Directive (WFD). These values from the WFD reports will be used to determine thresholds, e.g. for toxic substances in surface water. When no WFD reports are available for the sites (Bulgaria, Tunisia, Morocco), other indicators have been defined that are more easy to calculate. For these sites, local thresholds will be used, when available. The local thresholds might be defined through stakeholder agreement, but we will also compare these values with the WFD thresholds for a comparison between the sites. Sometimes, gradual changes in an indicator indeed point out a gradual increase of the environmental risk. Then a threshold for sudden increase of risk cannot be given, or only after comparisons of all indicators for all sites. In the site reports (Deliverables 2.2-2), the comments on the values for the indicators will be based on these assumptions.
For most indicators, a higher value means a higher environmental risk. In some cases, a higher value means a lower environmental risk (this is usually done by using the reciprocal of the value to indicate a negative relationship). This has to be taken into account when making calculations for combination of indicators, e.g. within an index or a matrix.
In a similar manner to the domestic and environmental sector, it could be possible to generate sectoral thresholds for agriculture, industry and tourism, but this is a slow process and finally defined thresholds are not yet available. In these cases it is necessary to define thresholds for each test site.
CemOA
: archive
ouverte
d'Irstea
Doc Name: Deliverable ID: WP2.1-D2.1-3.pdf Date: 24/01/2007
2.4 Graphical representation and interpretation of the water stress
index
The computed value of the AWSI can be illustrated through a graph. This is described in detail in section 4. The illustration of the AWSI has been discussed within WP2.1 but the suggestion for it comes from CEH.
2.5 The provision of additional qualitative knowledge through a
commentary
The commentary is to provide the opportunity to include non mathematical information about the site, and any additional information, perhaps from local knowledge, for example. In some places this information may be more useful than the calculated AWSI, and combined with the other parts of the Matrix, it can be of use in a qualitative way. This section could however also provide other scientific information, including references to additional documentation etc.
2.6 Geographical information and maps
By geo-referencing and digitizing the data going into the calculation of the AWSI, it is possible to generate maps indicating diversity of AWSI scores across a region or even a basin. This is illustrated in Figure 4, showing Water Vulnerability Index scores for the lower Mekong.
Figure 4: Example for geo-referenced results: Water Vulnerability Index Scores displayed through GIS N itrogen load/Km2 Industrial use/Km3/Yr C rop la nd in flo od pla in
Multiple variables provide input to final inde x, and GIS enables meaningful
representation to stakeholders
Source: Sullivan et al., 2006. GWSP working paper 1.
Revision: 12.0 MM 17 Public CemOA : archive ouverte d'Irstea / Cemagref
In the test sites, the extent to which georeferencing of data is being carried out is not clear The development of this type of approach to water assessment in the case study sites will result in the potential development of an integrated dataset on which this analysis is based. One of the real advantages of this approach is that it can draw on both new data, and existing data, for example drought maps developed in previous studies could be an important source of information in some areas. While this may not be possible in the test sites at this time, WB2 recommends that this should be done where possible.
2.7 Application of the Aquastress Water Stress Index and Matrix in the
test sites
As part of the activities of the Aquastress project, it is anticipated that the developed index and matrix methodology will be applied in the test sites. This will not only provide a means of testing the index methodology itself, but it will also serve to enable joint work teams from the test sites to evaluate the situation in the site, and lay the foundation for future monitoring of water stress within the site.
The potential to do this will depend on the availability of relevant data at the test sites, and in some cases this may be only be available with difficulty. While it is the intention to apply this standardised analytical framework to as many test sites as possible, this may not be achieved, and as a result it may be necessary to compute a base line for the purpose of cross-site comparison, with a more site-specific model to be applied for local decision-making purposes. This approach is what is being recommended here in this report. To illustrate the variability within Aquastress test sites, some basic information about the sites are presented in Appendix.
CemOA
: archive
ouverte
d'Irstea
Doc Name: Deliverable ID: WP2.1-D2.1-3.pdf Date: 24/01/2007
Revision: 12.0 MM 19 Public
3 POTENTIAL SECTORAL VARIABLES FOR INCLUSION IN THE AWSI
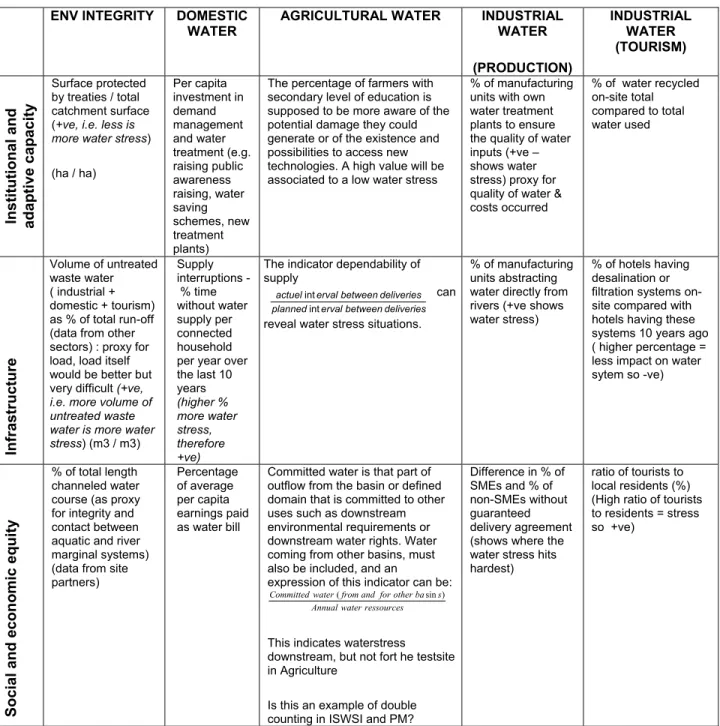
Following list of indicators was created during several working sessions of the participant institutions of WP 2.1 (see annex E). First based on expert knowledge indicators have been collected to indicate water stress in each sector, the domestic, industrial and agricultural sector as well as for the environment. The industrial sector is divided into two parts as both show different characteristics: production and tourism/services. The tourism/services resemble the domestic sector and are often included in the domestic water infrastructure. On the other hand the water demand of the tourist sector might play an important role in some test sites and therefore should not be included in the domestic sector but examined additionally. The list of indicators has been structured according to the aspects: water quality and quantity, institutional and adaptive capacity, infrastructure, society and equity. Finally the list of indicators has been reduced by ranking the indicators of each category using two criteria: relevance and data availability. The decision has been taken that the first four indicators of each category in each sector should be used in each test site. It is a broad list of possible indicators that has to be adapted to the particular conditions of the test-sites and to the availability of data. Main idea of the list was to create an inventory of
indicators that could be used in the test-sites of Aquastress.
3.1 Sectoral indicators
3.1.1 Domestic sector indicators
NOTE +ve values means increase in water stress, negative value means a reduction in water stress
1. Quantity & Quality
1. Per capita consumption (litres/capita/day) variation over the last 10 yrs (an increase in consumption +ve)
2. % Domestic consumption as a fraction of the total (i.e. industry + agriculture + domestic + environment etc)
3. Population density (inhabitants/km2 ) variation over the last 10 years (higher is more stress)
4. no of days per year when e coli thresholds are exceeded in any water body within the administrative unit
2. Institutional and adaptive capacity
1. Per capita investment in demand management and water treatment (e.g. raising public
awareness raising, water saving schemes, new treatment plants) and domestic water stress mitigation each year for the last five years (more budget allocated per capita means there is
more need for mitigation indicating the existence of water stress, but at the same time, investment indicates a higher level of institutional capacity).
2. Existence of a national water regulator to oversee implementation of national laws to promote demand management and better water quality.
3. multiple billing scales to promote water conservation (eg changes in seasonal charges) Y/N – yes means water stress exists so classed as +ve
3. Infrastructure
1. Supply interruptions - % time without water supply per connected household per year over
CemOA
: archive
ouverte
d'Irstea
the last 10 years (higher % more water stress, therefore +ve) 2. % Losses in infrastructure network
3. Number of days per year when water is supplied by tankers or requires additional
filtration/boiling (high number indicates stress, so +ve) 4. Society & equity
1. Percentage of average per capita earnings paid as water bill
2. % of population who have no formal access to water supply of any type (high numbers suggest higher water stress, +ve)
3. % of population within the administrative unit reporting incidents of water related diseases
(diahoreea, etc) (not malaria) (high number of cases of water disease suggests higher
water stress so +ve)
3.1.2 Agriculture
NOTE +ve values means increase in water stress, negative value means a reduction in water stress 1. Quantity & Quality
o The ratio agriculturirrigatedalareaarea is a basic indicator of water dependability. It can also be an indicator of agricultural vulnerability according to the distribution of the irrigated area. It is then recommended to assess the part each type of crops (cereals, fruits, vegetable, permanent grassland and fodders) represents within the irrigated area. This ratio could illustrate the current effect of agricultural policies (CAP in Europe) where an increase in irrigation is encouraged by specific crops subsidies. A high value of the ratio is associated to a potential high water stress and farm vulnerability to water conditions changes. Inversely, a low value is associated to a low water stress and vulnerability.
o The ratio CropWater quirement
quirement Water Crop Supply Water Re Re −
illustrates the real crop water stress. A negative value of this ratio is associated to a positive water stress and a negative value to a low or absence of water stress. The more the negative value of the ration is high, the more it is exists chances of high water stress situations. A negative value can be considered as an output, i.e. a stress coming from the agricultural sector and potentially supported by all sectors, whereas a negative value can be considered as an input of water stress to the agricultural sector mainly coming from other sectors or from physical natural characteristics like rainfall…
o The irrigation seasonality indicator,⎜⎜⎝⎛1−higheraverageweeklyweeklypeakirrigationirrigationdemanddemand⎟⎟⎞⎠, represents a potential water stress within a season. A value of the indicator near zero is associated to a low intra-annual water stress and a value near 1 to a high impact on water stress.
o The dependency of agriculture to irrigation can also be an indicator of potential water stress. The indicator proposed is expressed as
∑
= = 5 1 5.( ) ) ( j j j j irrigated hectare per yield hectare irrigated non per yield
, where “j” are the five types of crops presented above. A high value of the indicator (near 1) is associated to a low potential water stress whereas lower values (near 0) are associated to a rather high one.
CemOA
: archive
ouverte
d'Irstea
Doc Name: Deliverable ID: WP2.1-D2.1-3.pdf Date: 24/01/2007 o The
(
)
(
)
∑
= = 4 1 14. i water required quality water reali quality i , illustrates the dependability of irrigated agriculture to water
quality. The components of the quality can be phytosanitaries products, salt contents, heavy metals and organic matters and the required quality defined as standards accepts for irrigation. A value of the indicator higher than 1 is more subject to be associated to a high water stress and a lower value to a less water stress situation.
2. Institutional and adaptive capacity
1. The percentage of farmers with secondary level of education is supposed to be more aware of the potential damage they could generate or of the existence and possibilities to access new technologies. This is the assumption underlying this indicator. A high value will then be associated to a low water stress and values near zero to a potential high water stress. 2. The percentage of farmers receiving eco-money (environmental payments, labelling…) either
from public authorities or from private companies (farm-produce companies) can reveal a propensity of farmers to develop sustainable practices. Thus, a high percentage of farmers receiving eco-money can be associated to a low impact on water stress and a low value to a rather high potential impact on water stress.
3. The percentage of the irrigated area using water saving technologies (drip irrigation for example or rain gun instead of gravity), reveal an adaptation to a water stress. A value near zero reveals either an absence of water stress or an absence of adaptive capacity to a water stress what lead to an increase in potential water stress. A value near 1 reveals a rather high adaptive capacity of farmers and potentially a lower water stress
4. The percentage of farmers’ members of a formal or informal cooperation of farmers (sharing machineries, staff for commercialisation, lands…). a high percentage reveal a rather high adaptive capacity and are more likely subject to develop effective water management options.
3. Infrastructure
1. The percentage of the irrigated area that is under water management (control of water consumption) can be an indicator of potential water stress; a high value being associated to a low water stress and a low one to a high potential water stress because of the absence of water management. For this indicator, it is considered to take into account the irrigated area under management scheme (gravity and pressurized networks) and the irrigated area depending on self supply and equipped by water metering.
2. The indicator dependability of supply ⎟⎟⎠
⎞ ⎜⎜ ⎝ ⎛ deliveries between erval planned deliveries between erval actuel int int
can also reveal water stress situations. A value below 1 is associated to a potential high water stress either because of water shortage or because of network management deficiencies and a value upper than one is associated to a rather good situation in terms of water availability for irrigation.
3. The percentage of the irrigation potential defined by the agricultural or hydraulic regulation
that is really used by farmers ⎟⎟
⎠ ⎞ ⎜⎜ ⎝ ⎛ area irrigated y potentiall area irrigated
It is an indicator of potential water stress when the value is greater than 1.
4. When collective systems exist, the fees recovery rate can be an indicator of potential water
stress. The opposite diagram illustrates the potential effect of an increase of the unpaid fees rate. Let suppose that because of a service quality inadequate to farmers’ demands or because of other external constraints (market prices…), the willingness to pay for that service
Revision: 12.0 MM 21 Public CemOA : archive ouverte d'Irstea / Cemagref
decrease and generate unpaid fees, the network manager will suffer from an increase of the administrative costs, will then either increase the water price or reduce some operation and maintenance activities, what will lead to a reduction of the service quality, an reduction of the distribution effectiveness and so on. Face to a low service quality, farmers can decide to disrespect allocation rules (water turns, water robs…) based on hydraulic constraints, and then to water wastes. The unpaid fees rate regroups several components that can potentially reveal and have an impact on water stress. The more the unpaid fees rate is high, the more the system studied is likely to face water stress.
4. Society & equity
1. The proposed indicator is based on the assumption that farm size dispersion reflects revenues dispersion. Knowing that this assumption is wrong for a comparison between irrigation farms and non irrigating farms11, the two systems are separated. The indicator consist in comparing, for irrigated farms and dry ones, the average size of the first smaller quarter farms to the average size of the fourth quarter and to weight it by the percentage the area concerns represent within the whole agricultural area. It corresponds to the following
indicator: d d d i i i s Q Q s Q Q , 4 , 1 , 4 , 1 +
Where : Q1 is the average size of the first quarter and Q4 the size of the fourth quarter; indices “d” and “i” indicating respectively dry or irrigated; “si ” the area dominated by farming systems (respectively “j” for dry systems). Note that a farm having both irrigated and dry area will be fully counted in “irrigating farm”.
2. irrigated area area crop irrigated subsidied or agriculturalrevenue subsidies
a high values can be associated to potential water stress. This is mainly a socio economic indicator of policy intervention in agriculture. We assume that a value of the indicator near 1 is more subject to be associated to water stress since it exist distortions in the allocation of factors of production (this is for example the case of the CAP in many European country that favoured maize crops production to the detriment of water availability). A value near zero will be associated to a low impact on water stress.
3. The committed water is that part of outflow from the basin or defined domain that is committed to other uses such as downstream environmental requirements or downstream water rights12 . It then exist committed water from other basins (entering in the basin studied) and committed water for other basins (going out the studied basin). An expression of this indicator can be: Annualwaterressources
s ba other for and from water Committed ( sin ) A basin is then vulnerable from the water stress point of view when it is largely dependant on the committed water from other basins and when other basins depend on “their” committed water (the underlying assumption is that the studied basin does respect the commitment). See for definitions of the terms employed.
11 In France for example, to get the same revenue in dry farming systems compared to irrigated one, it is
necessary to have an area twice superior.
12 The uncommitted outflow is the water that is not depleted, nor committed and is therefore available for a use
within the domain, but flows out of the basin due to lack of storage or sufficient operational measures. Uncommitted outflow can be classified as utilizable or non-utilizable. Outflow is utilizable if it could be used by improved management of existing facilities. CemOA : archive ouverte d'Irstea / Cemagref
Doc Name: Deliverable ID: WP2.1-D2.1-3.pdf Date: 24/01/2007
Revision: 12.0 MM 23 Public
3.1.3 Industry-production
In this case, the impact on the water system in terms of outputs and inputs, has been identified.
NOTE +ve values means increase in water stress, negative value means a reduction in water stress Quantiy & Qualtiy
Quantity of water (annual amount) also taking account of variability and quality (how suitable for purpose)
• Volume of industrial water abstraction from public water supply & private wells as a proportion of available water/abstraction (+ve shows water stress) (relevant, data not yet completely available for all test sites) INPUT/OUTPUT
• Specific Contaminant load as a result of industry (Δt COD/ € GDP) (+ve shows water stress) in proportion to river flow (very relevant, data not available and not always free for public) OUTPUT
Infrastructure
• % of manufacturing units abstracting water directly from rivers (+ve shows water stress) (relevant, data not available) INPUT/OUTPUT
• % recycled water use by industries compared to total recycled water use (-ve shows water stress) problematic? Recycling coefficient within a company (how much of the total water flow is recycled) (very relevant, data not yet available) INPUT/OUTPUT
Institutional and adaptive capacity
• % of manufacturing units with own water treatment plants to ensure the quality of water inputs (+ve – shows water stress) proxy for quality of water & costs occurred (very relevant, data not yet available) INPUT
• % of manufacturing units with the labelling-EN ISO 9001 (-ve more water stress) (not so much relevant, data not available) OUTPUT
Society and equity
• Difference in % of SMEs and % of non-SMEs without guaranteed delivery agreement (shows where the water stress hits hardest) (not so much relevant, data will not be easy to get) INPUT • Total (percentage) loss in manufacturing revenues due to cut offs (+ shows water stress)
(relevant, information will be difficult to get) INPUT
CemOA
: archive
ouverte
d'Irstea
3.1.4 Industry -Tourism / Services
Note: Tourism is considered separately from other forms of industry due to the difference in its impacts on stress
Quantity & Qualtiy
Quantity of water (annual amount) also taking account of variability and quality (how suitable for purpose)
• total number of tourist overnight stays per year (higher number = +ve) • number of litres of bottled water used in tourist sector
• % of water used by tourist sector from the public distribution system (since for both sectors we indicate water stress, we do not have to do it through an interlinkage again, but higer % = +ve = more stress)
• % change in population at peak tourist season compared to local population based on census figures. (high percentage = more stress - +ve)
• Volume of water used by tourism (higher volume = more water stress - +ve)
Institutional and adaptive capacity
• % of hotels having information to avoid misuse of water / to avoid the waste of water (higher % indicates water stress - +ve)
• % of water recycled on-site total compared ot total water used
• % of hotels having any water-saving techniques (higher % = reduction in stress -ve) • % of hotels having rainwater-harvesting (higher percentage = less water stress –ve) • % of business units receiving any environmental certification (-ve)
Infrastructure
• % of hotels having desalination or filtration systems on-site compared with hotels having these systems 10 years ago ( higher percentage = less impact on water sytem so -ve)
Society and equity
• tourism sector turnover/M3 (higher value per M3, better water use so -ve)
• ratio of tourists to local residents (%) (High ratio of tourists to residents = stress so +ve)
3.2 Environmental components for each sector
(ENVIRONMENT – applicable worldwide)
NOTE +ve values means increase in water stress, negative value means a reduction in water stress WATER QUANTITY
• annual groundwater abstraction as percent of (10 years average) annual recharge (P) (+ve, i.e.
more is more water stress) (m3 year-1 / m3 year-1)
CemOA
: archive
ouverte
d'Irstea
Doc Name: Deliverable ID: WP2.1-D2.1-3.pdf Date: 24/01/2007
Revision: 12.0 MM 25 Public
• surface water low flow: nr of days of flow lower than 7Q10 low flow; for ephemeral streams: duration of dry period compared to 10 years mean (P) (+ve, i.e. more is more water stress) • surface water high flow (flooding): nr of days higher than 7Q10 high flow (flow (P) (-ve, i.e. less
is more water stress)
• locally generated information on changes in the water table
WATER QUALITY (neighbour effects = integrated over upstream area)
• Volume of untreated waste water ( industrial + domestic + tourism) as % of total run-off (data from other sectors) : proxy for load, load itself would be better but very difficult (D) (+ve, i.e.
more volume of untreated waste water is more water stress) (m3 / m3)
• Diffuse eutrophication: Agricultural fertilizer use in the catchment (total N and P / ha catchment) (D) (+ve, i.e. more agricultural fertilizer use is more water stress) (
• Diffuse toxic substances: pesticide use in agriculture per ha of agricultural land (substances site dependent-locally relevant) (D) (+ve, i.e. more is more water stress)
• Hazards with toxic substances: frequency of excedance of a set concentration of hazardous substances (concentration and substances determined by stakeholders/based on (inter)national limits) (P) (+ve, i.e. more is more water stress)
• Others, General physical-chemical characteristics (WFD) (P), including thermic, oxygen Salinity, Acidity, and Nutrients
INSTITUTIONAL AND ADAPTIVE CAPACITY(= vulnerability of state determining potential impact of pressures on (semi)natural ecosystem)
• Surface protected by treaties / total catchment surface ( R_) (+ve, i.e. less is more water
stress) (ha / ha)
• existence of laws relating to water and environment - for discussion: how to measure / how to quantify or scale? (data from site partners)
• % of wetland area (not) protected by treaties (use local definition of wetland) • (data from site partners)
• total number of endangered or endemic species that depend on aquatic/wetland habitats for at least part of their life cycle (=> possibility for recolonization), or
• total number of species that are represented by more than 1 % of their total European population in the area at any time (analogue to bird habitats)
• (data from European reporting or national/local nature protection agencies )
• budget spent on management & restoration of wet ecosystems (data from local/national organizations) (data from European reporting or national/local nature protection agencies ) • budget spent on management & restoration of wet ecosystems (data from local/national
organizations)
Infrastructure (pressure of water resource on (semi)natural ecosystems)
• Number of dams without fish elevators (as proxy for degree of river fragmentation) (data from site partners)
• % of total length channeled water course (as proxy for integrity and contact between aquatic and river marginal systems) (data from site partners)
Some additonal notes on environmental indicators
CemOA
: archive
ouverte
d'Irstea
- do not include impact assessment (environmental impact assessments of options) in water stress assessment
- there should be a clear separation between core set of (generic) indicators for all sites, and an additional set of more site specific indicators (more extensive, may need more elaboration) as basis for stakeholder discussions in sites
- In quantity estimates, deviation from normal conditions for: - 1) groundwater
- 2) surface water low flow (refuges) - 3) surface water high flow (flooding)
Recommendation: impact on wetlands included in weighting of flooding, additional indicator for impact on
wetlands (drainage, ….)
- Volume of untreated waste water ( industrial + domestic + tourism) as % of total run-off (data from other sectors) : proxy for load, load itself would be better but very difficult
- Non point eutrophication: Agricultural fertilizer use in the catchment (total N and P / ha catchment) - Non point toxic substances: pesticide use in agriculture per ha of agricultural land (substances site
dependent-locally relevant)
- Hazards with toxic substances: frequency of exceedance of a set concentration of hazardous substances (concentration and substances determined by stakeholders/based on (inter)national limits)
- Algal blooms: proxy for eutrophication, but also problems with toxic algae and consequences of algal blooms (anoxic circumstances)
- surface water low flow: nr of days of flow lower than 7Q10 low flow; for ephemeral streams: duration of dry period compared to 10 years mean (P) (+ve, i.e. more is more water stress)
CemOA : archive ouverte d'Irstea / Cemagref