R E S E A R C H
Open Access
Overexpression or absence of calretinin in
mouse primary mesothelial cells inversely
affects proliferation and cell migration
Walter Blum
1, László Pecze
1, Emanuela Felley-Bosco
2and Beat Schwaller
1*Abstract
Background: The Ca2+-binding protein calretinin is currently used as a positive marker for identifying epithelioid malignant mesothelioma (MM) and reactive mesothelium, but calretinin’s likely role in mesotheliomagenesis remains unclear. Calretinin protects immortalized mesothelial cells in vitro from asbestos-induced cytotoxicity and thus might be implicated in mesothelioma formation. To further investigate calretinin’s putative role in the early steps of MM generation, primary mesothelial cells from calretinin knockout (CR−/−) and wildtype (WT) mice were compared.
Methods: Primary mouse mesothelial cells from WT and CR−/− mice were investigated with respect to
morphology, marker proteins, proliferation, cell cycle parameters and mobility in vitro. Overexpression of calretinin or a nuclear-targeted variant was achieved by a lentiviral expression system.
Results: CR−/− mice have a normal mesothelium and no striking morphological abnormalities compared to WT
animals were noted. Primary mouse mesothelial cells from both genotypes show a typical“cobblestone-like” morphology and express mesothelial markers including mesothelin. In cells from CR−/− mice in vitro, we observed more giant cells and a significantly decreased proliferation rate. Up-regulation of calretinin in mesothelial cells of both genotypes increases the proliferation rate and induces a cobblestone-like epithelial morphology. The length of the S/G2/M phase is unchanged, however the G1phase is clearly prolonged in CR−/− cells. They are also much slower to close a scratch in a confluent cell layer (2D-wound assay). In addition to a change in cell morphology, an increase in proliferation and mobility is observed, if calretinin overexpression is targeted to the nucleus. Thus, both calretinin and nuclear-targeted calretinin increase mesothelial cell proliferation and consequently, speed up the scratch-closure time. The increased rate of scratch closure in WT cells is the result of two processes: an increased proliferation rate and augmented cell mobility of the border cells migrating towards the empty space.
Conclusions: We hypothesize that the differences in proliferation and mobility between WT and CR−/− mesothelial cells are the likely result from differences in their developmental trajectories. The mechanistic understanding of the function of calretinin and its putative implication in signaling pathways in normal mesothelial cells may help understanding its role during the processes that lead to mesothelioma formation and could possibly open new avenues for mesothelioma therapy, either by directly targeting calretinin expression or indirectly by targeting calretinin-mediated downstream signaling.
Keywords: Calretinin, Primary mesothelial cells, Mesothelium
* Correspondence:[email protected]
1Unit of Anatomy, Department of Medicine, University of Fribourg, Route
Albert-Gockel 1, CH-1700 Fribourg, Switzerland
Full list of author information is available at the end of the article
© 2015 Blum et al. Open Access This article is distributed under the terms of the Creative Commons Attribution 4.0 International License (http://creativecommons.org/licenses/by/4.0/), which permits unrestricted use, distribution, and reproduction in any medium, provided you give appropriate credit to the original author(s) and the source, provide a link to the Creative Commons license, and indicate if changes were made. The Creative Commons Public Domain Dedication waiver (http://creativecommons.org/publicdomain/zero/1.0/) applies to the data made available in this article, unless otherwise stated.
Background
Mesothelial cells cover the serous cavities (pleura, pericardium and peritoneum) and surfaces of internal organs. The mesothelial cell monolayer forming the boundary of the tunica serosa to the e.g. intrapleural space is characterized by flattened cells with “cobble-stone-like” polygonal morphology. This cell layer has mainly a protective function and serves to lubricating the space between the parietal and visceral serosa, thus reducing mechanical friction. Additionally, the mesothelial cell layer is involved in many other pro-cesses including transporting fluid and cells across the serosal cavities, tissue repair and inflammation, coagulation and fibrinolysis and even tumor cell adhe-sion [1]. Only about 0.15–0.5 % of mesothelial cells undergo mitosis at a given moment in situ; when stimulated e.g. by injury of the serosa, when loosing contact inhibition or through mediators from inflamma-tory and injured cells, 30–80 % of the mesothelial cells lo-cated around the injured site re-enter the cell cycle, i.e. they start synthesizing DNA and proliferate [1, 2].
Calretinin (CR; human gene symbol: CALB2) is a Ca2+-binding protein of the EF-hand family reported to be absent in normal mesothelial cells in situ; how-ever in reactive mesothelial cells [3] and in malignant mesothelioma (MM), often resulting from asbestos exposure, CR expression is upregulated [3]. Conse-quently the presence of CR, besides the later discov-ered mesothelin [1, 4] is viewed as one of the few positive markers for MM, mostly of the epithelioid and mixed type [2, 3, 5]. CR is essential for human MM-derived cell lines in vitro [6], since its down-regulation by shRNA directed against CALB2 mRNA results in decreased proliferation and significantly re-duced viability, the latter mostly caused by induction of apoptosis via activation of the intrinsic caspase 9-dependent pathway. Down-regulation of CR in im-mortalized (non-transformed) human mesothelial cells (e.g. LP-9/TERT1) results in a G1 growth arrest with-out leading to apoptosis or necrosis [6]. Impairment of Ca2+ handling in MM cells reduces uptake of Ca2+ into mitochondria and this reduces apoptosis in these cells [7]. In line with this study, overexpression of CR reduces the mitochondrial Ca2+ uptake in primary mesothelial cells [8].
In order to further investigate the role of CR in cells of mesothelial origin, we made use of mouse-derived primary mesothelial cells from wild-type (WT) mice and from CR-deficient (CR−/−) animals. We observed that CR−/− cells displayed reduced cell proliferation and decreased mesothelial cell layer re-generation (scratch assay in vitro), while CR overex-pression increased cell proliferation and mobility in both genotypes.
Methods
Isolation of mesothelial cells
Mesothelial cells were isolated from 4–6 months old C57Bl/6 J mice (WT) and from CR−/− mice also on a C57Bl/6 J background; the detailed cell isolation proced-ure is described elsewhere [9, 10]. All experiments were performed with permission of the local animal care com-mittee (Canton of Fribourg, Switzerland) and according to the present Swiss law and the European Communities Council Directive of 24 November 1986 (86/609/EEC). Briefly, mice were sacrificed and the peritoneal cavities were exposed by incision. The peritoneal cavities were washed by injection of approximately 50 ml of PBS (Sigma, St. Louis) via a 25G x 5/8” needle (BD micro-lance 3, Becton Dickinson AG, Allschwil, Switzerland) using a peristaltic pump and a second needle to allow exit of the PBS solution. Perfusion was maintained until the exiting PBS solution was clear, i.e. devoid of mobile and poorly attached cells. Residual PBS was aspired with a syringe and the peritoneal cavity was filled with 5 ml of 0.25 % Trypsin/EDTA solution (Gibco, Switzerland). The body temperature of mouse corpses was maintained at around 37 °C for 5 minutes via an infrared heat lamp. The suspension containing the detached cells was col-lected with a syringe, cells were centrifuged for 10 min at 300 x g. Cells mostly comprising primary mesothelial cells were grown in modified Connell’s Medium com-posed of: DMEM/F12 + GlutaMax (Gibco), 15 % FCS, 0.4 μg/ml hydrocortisone, 10 ng/ml epidermal growth factor, 1 % ITS (insulin, transferrin, selenium), 1 mM so-dium pyruvate, 0.1 mM beta-mercaptoethanol, 1 % non-essential amino acids, 1 % Penicillin-Streptomycin and 2 % Mycokill (PAA, Brunschwig, Switzerland) [11]. All animals were genotyped by PCR using the forward primer CR-IT1 (5’ common primer) 5’-GCTGGCTGAGTACTC-CAAGGGTACACATT-3’ and the reverse primer 5’-GTT CTCTAGCTCTTTACCTTCAATGTACCCCA-3’ for the WTCalb2 allele (fragment size of 243 bp) and the reverse primer 5’-GTCTCCGTGGAGGTGGTGACTTCCTAGT C-3’ for the mutated Calb2 allele (fragment size of 150 bp).
Hematoxylin and eosin staining
WT and CR−/− mice were killed by CO2 inhalation followed by intracardial perfusion with PBS. The tissue was fixed by perfusion with 4 % paraformaldehyde (PFA) for 10 min and post-fixation by immersion in the same solution. Small pieces of various tissues including lung, large and small intestine were dissected, embedded in paraffin and semi-thin sections (10 μm) were prepared and stained with hematoxylin and eosin solution. Pri-mary mesothelial cells were grown on glass coverslips in 6-well plates until confluence was reached and fixed with 4 % PFA and stained with hematoxylin and eosin.
Transmission electron microscopy
Fifty thousand primary mesothelial cells were seeded on PET track-etched membranes with 3-μm pores (Becton Dickinson AG, Allschwil, Switzerland) and grown for 96 h in Connell’s Medium. Then, cells were fixed with 2 % PFA/ 2.5 % glutaraldehyde solution for 90 min and processed as described before [12, 13]. Images were taken with a Philips CM100 Biotwin transmission electron microscope and acquired with the iTEM software (Olympus Soft Imaging Solutions GmbH, Germany).
Plasmids, transfections and lentivirus production
CR was overexpressed by using the lentiviral system pLVTHM (Addgene plasmid #12247). Briefly the GFP cassette in pLVTHM was replaced with human CALB2 cDNA coding for full-length CR using the expression plasmid CMV-CALB2-neo as template [14]. The re-quired cDNA fragment coding for full-length CR was synthesized by PCR using the primers PmeI-CALB2 (5’-AGT CGT TTA AAC ATG GCT GGC CCG CAG CAG CAG-3’) and SpeI-CALB2 (AGT CAC TAG TTT ACA TGG GGG GCT CGC TGC A-3’). The amplicon was digested with PmeI and SpeI and inserted into the unique sites of the pLVTHM vector to produce the final pLV-CALB2 plasmid. The pCMV/TO SV40 large + small T Antigen plasmid was obtained from Addgene (#22298). pLKO.1-shCALB2 #7 (shRNACalb2 sequence: 5’CCG GGA AGG AGT TCA TGC AGA AGT ACT CGA GTA CTT CTG CAT GAA CTC CTT CTT TTT G-3’) and pLKO.1 H2B-GFP (Addgene # 25999) and lentivirus production was carried out as described before [6]. The pLV-NLS-CR plasmid was created using the fol-lowing plasmids as template: CMV-CR-neo for CR and pLV-EBFP2-nuc (Addgene #36085) encoding a nuclear localization signal (NLS). The required cDNA fragment coding for CR was synthesized by PCR using the follow-ing primers 5’-GAG ACT CGA GTA GCT GGC CCG CAG CAG C-3’ and 5’-GAG ATC TAG ATT ACA TGG GGG GCT CGC TGC A-3’ and integrated into the pGEM-T Easy vector (Promega, MA, USA) using the TA ligation method. The PCR product for NLS was amp-lified with the following primer pairs: 5’-GAG ACC ATG GGT TTA AAC ATG GCT GAT CCA AAA
AAG AAG AGA AAG-3’ and 5’-GAG ACT CGA
GAT CTA GAT CCG GTG GAT CC-3’. The ampli-con ampli-containing the NLS sequence was digested with AatII and NcoI and inserted into the appropriate site of pGEM-T Easy-CALB2 to generate pGEM-t-Easy-NLS-CR plasmid. Then, the NLS-CALB2 sequence was excised with PmeI and SpeI and integrated into the pLVTHM vector to produce the final pLV-NLS-CR plasmid.
Cell growth and viability assays
250–1000 cells/well were seeded in 96-well plates in Connell’s medium and grown for 7 days. Cell confluence was measured using the Live Cell Imaging System (Incu-cyte, EssenBioScience, Michigan, USA) by acquiring im-ages every 3 h. As a complementary method, cell number/viability was assessed at selected time points by performing an MTT assay as described before [6]. Cells were seeded in 24-well plates at a confluence of about 50 % and transfected 24 h later with 1 ml of non-concentrated lentivirus suspension containing Polybrene (8μg/mL; Sigma, Buchs, Switzerland). Cells were grown for 3 days, passaged at a dilution of 1:8 and cell prolifer-ation was monitored with the Incucyte system.
Cytotoxicity assay
Cells were plated at a density of approximately 10 % and the presence of dying cells was monitored in the Incu-cyte system using the CellToxGreen dye (Promega, San Luis Obispo, CA, USA) following the manufacturer’s in-struction for real-time cytotoxicity analysis. The image series were evaluated and the dying cells were deter-mined with the particle analysis function of ImageJ soft-ware (NIH, USA).
Western blot analysis
Protein samples were isolated from cultured mouse mesothelial cells and from mouse tissue. Cells were grown in 25 cm2 flasks and harvested at confluence. Cytosolic protein fractions were collected as described before [15]. Freshly excised mouse cerebellum was frozen in liquid nitrogen and homogenized in extraction
buffer (10 mM Tris, 2 mM EDTA, 1 mM
β-mercaptoethanol; pH 7.4) containing a cocktail of differ-ent protease inhibitors (Roche, Mannheim, Germany). Proteins (100 μg) from each cell culture sample, 1 μg protein from cerebellum, as well as 40 ng of purified human recombinant CR were loaded onto SDS-polyacrylamide gels (10 %). After separation, proteins were blotted onto a nitrocellulose membrane (Bio-Rad Laboratories, Hercules, CA, USA) and incubated for two days at 4 °C with the CR-specific antibody CR7699/4 (Swant, Marly, Switzerland) at a dilution of 1:10,000. Rabbit secondary antibody linked to horseradish perox-idase (Sigma-Aldrich) was diluted at 1:10,000 and incu-bated for 2 days; prolonged incubation was shown to enhance the sensitivity in Western blotting [16]. For the detection, the chemiluminescent reagent Luminata Clas-sico Forte (EMD Millipore Corporation, Billerica, MA, USA) was used. Chemiluminescent and normal illumin-ation digital images were recorded on a system from Cell Biosciences (Santa Clara, CA, USA).
Immunohistochemistry (IHC)
Cells were seeded on glass coverslips and incubated with the appropriate medium until a confluence of 70–90 % was reached. Then, the cells were fixed with 4 % PFA, permeabilized with 1 % Triton X-100, and blocked with TBS-containing donkey serum (10 %). Cells were incu-bated overnight at 4 °C with the primary antibodies at the indicated dilutions: rabbit polyclonal anti-CR (Swant, 7699/4; 1:500), mouse monoclonal anti-mesothelin (Santa Cruz sc-166203; 1:500), mouse monoclonal anti-pan-cytokeratin, clone Lu-5 (BMA Biomedicals, T-1302; 1:500), mouse monoclonal anti-vimentin (Sigma V6630; 1:500) or rabbit polyclonal anti-desmin (Sigma D8281; 1:500). After washing, the cell-containing coverslips were incubated with secondary antibodies for 1 h with either DyLight488-conjugated donkey anti-mouse IgG (Jackson Immunoresearch Laboratories; 1:1000) or Cy3-conjugated donkey anti-rabbit IgG (Jackson Immunore-search Laboratories; 1:1000). The cells were counter-stained with DAPI (Molecular Probes; 5 μg/ml) and mounted with Hydromount solution (National Diagnos-tics, Atlanta, GA). Images were acquired with a LEICA fluorescent microscope DM6000B (Wetzlar, Germany) integrated to a Hamamatsu camera C4742-95 (Bridgewa-ter, New Jersey, USA).
Scratch assay
Mesothelial cells (10,000–20,000) were plated in a 96-well ImageLock plates (Essen Bioscience) and 24 h after plating, a scratch of about 1 mm was created using the Wound Maker tool (Essen Bioscience) and the cell cul-ture medium was replaced. The plate was scanned at a 2 h-frequency and data was evaluated using the Incucyte Software. Primary mesothelial cells were transduced with lentivirus expressing pLKO.1 H2B-GFP coding for a fu-sion protein consisting of histone 2B fused to green fluorescent protein and mixed at a ratio of 1:1; the scratch area was monitored every 15 min using the live cell imaging system (Incucyte FLR 10x, Essen Bio-science). To assess the cell mobility, the movements of the cells migrating primarily towards the center of the scratch were recorded. For the image analysis a Java ImageJ plugin (CGE) was used (http://bigwww.epfl.ch/ sage/soft/circadian/) that had been developed for track-ing cells in the context of circadian studies [17].
Bioluminescence time-lapse microscopy and data analysis To monitor the cell-cycle, cell division and cell move-ment, GFP-labeled primary mesothelial cells from CR −/− and WT mice were infected with a lentivirus coding for mCherry-hCdt1 (30/120) [18, 19]. The Fucci (Fluor-escent, ubiquitination-based cell cycle indicator) mCherry-hCdt1 was a kind gift of Prof. H. Miyoshi (Riken, Japan). mCherry-hCdt1 was synthetized by PCR
with the forward primer (FW-PmeI-mCherry 5’-AGT CGT TTA AAC ATG GTG AGC AAG GGC GAG GAG-3’) and reverse primer (RV-SpeI-mCherry 5’-AGT CAC TAG TTT AGA TGG TGT CCT GGT CCT G-3’) and cloned into pLVTHM (Addgene plasmid #12247) (SpeI and PmeI sites) substituting eGFP. pLV-mCherry-hCdt1 was used to produce lentivirus. The expression level of mCherry-hCdt1 is cell cycle-dependent showing an accumulation during the G0/G1phase, followed by an ubiquitination–based protein degradation during S/G2/ M phases. Fluorescence and time-lapse microscopy was performed with an inverted fluorescence microscope DMI 6000B (Leica Microsystems) equipped with an in-cubation chamber. A digital camera (Leica), a 10× ob-jective, GFP and TXR filter sets and the LAS-AF imaging software (Leica) were used to acquire the im-ages. Images were taken every hour using the same set-tings including exposure times, gains and positions. For the image analysis a Java ImageJ plugin: CGE [17] was used.
Statistical analysis
Two-tailed t-tests were implemented in Excel 2010 (Microsoft). Linear regressions were fitted to the experi-mental data from scratch assays using the GraphPad Prism (GraphPad Software, San Diego, California, United States) analysis package. MTT results were aver-aged (n≥ 3 independent experiments, each sample (ex-perimental condition) at least measured in triplicates). The statistical significance was calculated using a one-way ANOVA with StatPlus (AnalystSoft).
Immunohistochemistry on sections of mouse embryos from E14.5 and E16.5
Embryos from C57Bl/6J mice were collected at embry-onic day 14.5 (E14.5) and 16.5 (E16.5). Embryos were fixed by immersion in 4 % PFA for 72 h and embedded in paraffin after dehydration. De-paraffinized sections (3 μm) were subjected to Tris/EDTA (1 mM/0.1 mM, pH 9) antigen retrieval by heating the sections in a boil-ing water bath for 20 min. Endogenous peroxidases were quenched in 0.3 % H2O2 for 20 min followed by tissue permeabilization in 0.1 % PBS Tween 20 for 5 min and blocked at room temperature for 20 min in PBS contain-ing 2 % BSA and 1 % horse serum. Sections were incu-bated with primary antibodies (anti-CR 7699/4, Swant, Switzerland) 1:200 overnight at 4 °C. Sections were washed and incubated with secondary antibodies (1:200) at room temperature for 2 h. DAB (3,3’-diaminobenzi-dine tetrahydrochloride (Sigma-Aldrich) staining was performed followed by counterstaining of sections with hematoxylin. Slides were scanned and analyzed using a whole slide imaging system from Hamamatsu (Nanozoo-mer, 2.0-HT).
Results
Growth characteristics of mouse primary mesothelial cells in vitro
Primary mesothelial cells (prMC) isolated from the mouse peritoneum showed the typical growth character-istics as most primary cells. Directly after isolation, prMC cells grew rather slowly in vitro, the likely result of the adaption phase to the novel situation, e.g. with re-spect to growth medium, cell attachment surface, etc. After few passages, cell proliferation increased evidenced by the shortening of the time required to reach conflu-ence and steady-state rate of growth (maximum prolifer-ation rate) was generally observed between passages 2– 6. At later passages (n > 10), prMC started to show signs of senescence evidenced by the decrease in proliferation rates. For the reason of variable prMC proliferation characteristics in vitro, in all experiments parallel cul-tures (isolated from age-matched WT and CR−/− mice at the same day) having an identical number of passages at the start of the experiment were used. Also in overex-pressing experiments, where CR or the nuclear-targeted NLS-CR was expressed in prMC, the appropriate control cells were treated at the same time point by exactly the same procedure. Thus, growth curves presented in this study are variable to some extent, e.g. with respect to the absolute time required to reach confluence. For these reasons, growth curves were evaluated in relative (side-by-side comparison), not in absolute terms. The tunica serosa including the mesothelial cells from CR-deficient (CR−/−) mice is indistinguishable from the one of WT mice
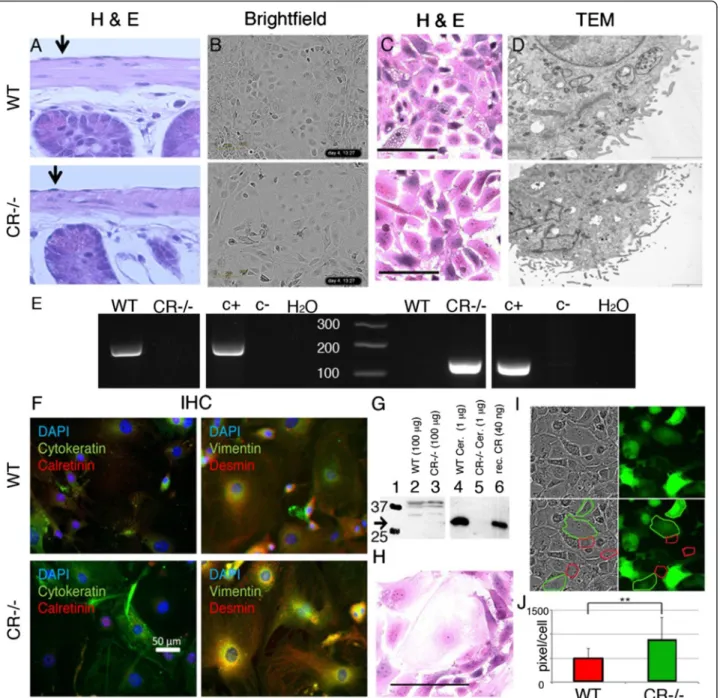
The tunica serosa facing the peritoneal cavity and cover-ing the small intestine from WT and CR−/− mice was compared (Fig. 1a). In both cases a single layer of flat mesothelial cells characterized by a disk-shaped nucleus formed the barrier towards the peritoneum. Neither signs for a change in mesothelial cell morphology (e.g. cuboidal cells), thickening of the tunica serosa nor other abnormalities were detected in CR−/− mice. Also in the pleural mesothelium, there were no indications of an al-tered mesothelial cell layer (data not shown). Isolated primary mesothelial cells were incubated in Connell’s medium and let grow for approximately 1 week until confluence was reached. Starting at a confluence of about 10 %, primary mesothelial cells completely cov-ered the surface of the plates after a growth period of 2– 4 days in Connell’s medium. At confluence, mesothelial cells from either genotype showed the typical cobblestone-like morphology, demonstrated contact in-hibition and stopped growing. Brightfield images of mesothelial cells are shown in Fig. 1b. When starting with an identical initial cell density (500 cells per 96-well), CR−/− cells tended to grow slower than the
corresponding WT cells. This was also evident when the surface covered by an individual mesothelial cell was compared (Fig. 1b, c, i). At confluence, the number of mesothelial cells per surface was smaller also evidenced by a more pronounced cell flattening in the CR−/− sam-ples hinting towards a reduced rate of cell proliferation. We observed a higher prevalence of giant cells (Fig. 1h) in cultures derived from CR−/− mice.
The identity of the cells grown in vitro as mesothelial cells was additionally revealed by TEM images. We found the typical hallmark for mesothelial cells, i.e. ra-ther short microvilli of variable sizes that are not present in lymphocytes or fibroblasts (Fig. 1d), which might have been co-isolated with the mesothelial cells. We found no qualitative evidence for significant changes in the size distribution and amount of microvilli between CR−/− and WT cells. Furthermore, mesothelial cells were iden-tified by their expression of specific intermediate fila-ments; WT and CR−/− cells expressed both epithelial (e) and mesenchymal (m) intermediate filaments including cytokeratin (e), vimentin (m) and desmin (m) (Fig. 1f ) as described before [20]. Genotyping of mice used for pri-mary mesothelial cell isolation was done by PCR using allele-specific primers (Fig. 1e). Finally, we investigated the presence of CR protein expression in primary mouse mesothelial cells. Western blot analysis control experi-ments with proteins isolated from WT and CR−/− cere-bellum revealed a strong signal in the WT sample with an identical size as purified recombinant CR, while no signal was seen with cerebellar extracts from CR−/− mice (Fig. 1g). In cellular extracts from primary meso-thelial cells, no specific CR signal was detected in cells from both genotypes (Fig. 1g). Moreover, also by immu-nohistochemistry, no CR-specific signal was detected in WT and CR−/− mesothelial cells (Fig. 1f). This sug-gested that either CR was absent in WT mesothelial cells or that expression levels were below the detection limit of the Western blot analysis and immunohistochemistry. Although the cobblestone-like morphology of pri-mary mesothelial cells from WT and CR−/− mice was similar, we noticed that CR−/− cells covered a larger surface area (Fig. 1b, c). Thus, CR−/− cells were infected with lentivirus expressing the en-hanced green fluorescent protein (eGFP). These cells were then mixed at a 1:1 ratio with WT primary mesothelial cells and grown to confluence (Fig. 1i). From brightfield images and fluorescence images, CR −/− cells (green) and WT cells (non-green) were ran-domly selected (red and green traces, respectively) and the surface area was determined. The sparse giant cells of both genotypes were excluded from the analyses. The average surface area covered by a typ-ical CR−/− cell was significantly larger (+74.6 %) in comparison to a WT cell (Fig. 1j).
Fig. 1 a Hematoxylin and Eosin (HE) staining of a longitudinal section of small intestine from a WT and CR−/− mouse showing a normal mesothelium. Primary mesothelial cells of both genotypes grown in vitro maintain their typical‘cobblestone-like’ morphology, when grown to confluence as evidenced on the brightfield images (b). c HE staining of primary mesothelial cells grown in vitro revealed that CR−/− cells tended to be more flattened (larger diameter) and more“giant” cells (largest diameter > 100 μm) were observed, a typical example is shown in (h) Scale bar = 100μm. The TEM pictures (d) demonstrate the presence of microvilli typical for mesothelial cells; no apparent differences with respect to microvilli number, size or length were noticed. e Genotyping of WT and CR−/− mice with primers recognizing the Calb2 WT allele (left panel) and the mutated allele (right panel). For each PCR analysis, a positive control (c+) and a negative control (c-) from genomic DNA of previously identified WT and CR−/− mice was amplified, as well as a PCR reaction without template DNA (H20 control). f Immunofluorescence images of
primary mesothelial cells in vitro stained for cytokeratin and calretinin (left) and for vimentin and desmin (right), derived from WT (upper panel) and CR−/− (lower panel) mice. Nuclei are stained with DAPI (blue). Note the presence of all three intermediate-filament markers and the absence of a specific CR signal in cells from both genotypes. g Western blot analysis of CR in protein extracts from cerebellum (lanes 4 & 5) and prMC grown in vitro (lanes 2 & 3) from WT (2 & 4) and CR−/− (3 & 5) mice. Molecular weight markers (25 and 37 kDa) are shown in lane 1, purified recombinant CR (control) is shown in lane 6. Upper bands (>40 kDa) in lane 2 and 3 are non-specific bands not corresponding to the size of CR. i Mixed population of WT and CR−/− EGFP-labeled mesothelial cells: note the increase in cell surface area covered by a single CR−/− mesothelial cell (green boundaries) compared to WT cells (red boundaries). j Quantification of the average surface area covered by a WT or a CR−/− prMC is shown (n = 25 cells for CR−/− and n = 24 cells for WT, ** p < 0.01). For the analysis giant cells were omitted
Mesothelial cells, but not lung fibroblasts from CR−/− mice proliferate significantly slower
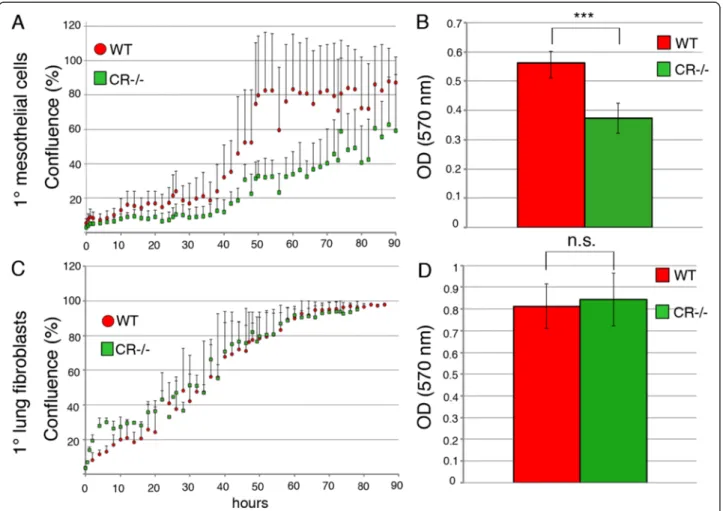
To further document the differences in primary meso-thelial cultures from WT and CR-deficient mice a de-tailed growth curve analysis was carried out. At a starting confluence of 10 %, 100 % confluence (plateau level) in rapidly proliferating WT cells was reached after approximately 50 h; at the same time point CR−/− cells from parallel cultures showed only approximately 30 % confluence and even after 90 h the plateau was not yet reached (Fig. 2a). Alternatively, we used the MTT assay that reports the combined effects of cell number and metabolic activity [21]. Assuming that under our growth condition, cell metabolism should not be impaired, the MTT readout is expected to be proportional to the cell number. At the selected time point (96 h, endpoint), the MTT signal was significantly smaller for CR−/− than for WT cells supporting the data on reduced CR−/− cell proliferation determined with the live cell imaging
system (Fig. 2b). To investigate whether this difference was also observed in another cell type we analyzed pri-mary lung fibroblasts from both genotypes using both assays. Growth curves obtained with the live cell im-aging system and MTT values at 96 h post-seeding showed no differences between fibroblasts isolated from WT or CR−/− mice (Fig. 2c, d). Also the overall morph-ology of fibroblasts from the 2 genotypes was not differ-ent (data not shown). This suggests cell type-specific differences in the proliferation of WT and CR−/− cells. Upregulation of CR in primary mesothelial cells from WT and CR−/− mice increases proliferation
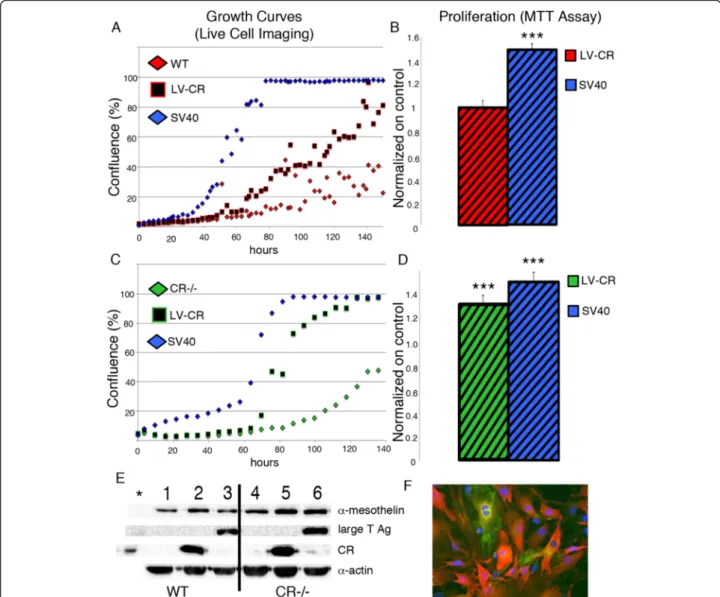
Primary WT mesothelial cells from later passages (n > 7) tended to grow slower, reaching approximately 40 % confluence at 140 h in culture (Fig. 3a). When these cells were transfected with the CR expression plasmid coding for full-length CR (pLVTHM-CALB2), a strong CR pro-tein signal at the expected size (Mr: 31 kDa) was
Fig. 2 a Cell growth analyses (average of five wells, four independent experiments showing similar growth curves) were performed. Primary mesothelial cells show clear differences between WT and CR−/− cells (a). A plateau (100 % confluence) is reached at ≈ 50 h in WT cells, while CR −/− cells are not yet confluent (≈60 %) at 90 h. b The MTT signal obtained at 96 h post-seeding is significantly smaller in CR−/− samples (n = 3 experiments; p < 0.005) (c) Growth curves and (d) MTT signals at 96 h post-seeding from primary lung fibroblasts are not different
observed by Western blot analysis (Fig. 3e) and immu-nohistochemistry revealed intense and relatively homogenous staining that was strongest in the cytosol (Fig. 3f ). No qualitative differences in the staining for the markers cytokeratin, vimentin and desmin were observed in CR-overexpressing mesothelial cells (data not shown). The proliferation rate was clearly increased, i.e. with the same number of initially seeded CR-overexpressing cells, 80 % confluence was reached after 140 h (Fig. 3a). As a positive control, WT cells were transfected with the SV40 plasmid coding for the large T and small t antigen (TAg and tag, respectively); in-creased TAg and tag expression was previously shown to
result in increased proliferation, telomerase activity and favor transformation of mesothelial cells [22, 23]. Under these experimental conditions, TAg/tag-expressing WT mesothelial cells grew even faster, reaching a plateau (100 % confluence) already at approximately 70 h (Fig. 3a). Results of the MTT assays performed at 96 h post-plating showed rather similar results. Compared to WT control cells, overexpression of TAg/tag (SV40) re-sulted in a clearly higher (+40 %) MTT signal (Fig. 3b). Experiments with CR−/− mesothelial cells resulted in similar results with respect to CR or TAg/tag overex-pression. The strongest effect on increasing proliferation was observed after SV40 transfection, but also CR
Fig. 3 a Real-time growth curves of WT prMC (control), cells transfected with a SV40 plasmid (SV40) or a CR expression plasmid (LV-CR). b MTT signals at 96 h (normalized to WT cells) are increased in cells expressing SV40 TAg/tag. c Growth curves for CR−/− prMC subjected to the same treatment as in (a). d Normalized MTT signals in CR−/− cells; all experimental details are the same as in (b) (n = 3, one representative growth curve and MTT experiment is shown). Western Blot analysis in (e) show a strong upregulation of CR and SV40 large T Antigen (TAg) in the correspond-ing cell cultures.α-Mesothelin is used as marker for mesothelial cells and α-actin serves as a loading control. f Immunohistochemistry for CR (red) in CR-overexpressing WT cells and cytokeratin (green), cell nuclei are stained with DAPI (blue) (***p < 0.0005)
overexpression significantly increased proliferation de-termined by the 2 assays (live cell-imaging, MTT assay; Fig. 3c, d).
Decreased proliferation and mobility of CR−/−
mesothelial cells leads to a prolongation of the scratch-closure time
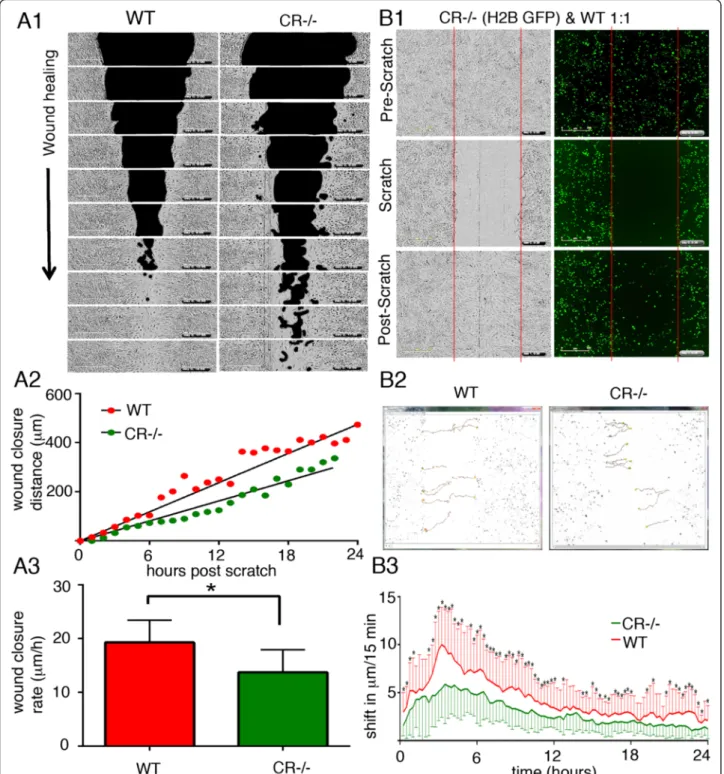
If the mesothelial cell layer is injured in vivo, e.g. by ex-posure to asbestos fibers, the closing of the injured site is dependent on several factors including the rate of the proliferation of the healthy cells adjacent to the injured site, as well as to cell mobility on the exposed lamina propria consisting mostly of extracellular matrix. Such a situation can be mimicked in vitro, at least in part, by the 2D-migration assay (scratch assay). Confluent layers of primary WT and CR−/− mesothelial cells were sub-jected to a scratch resulting in a gap of approximately 1 mm. The empty space was then filled by a process consisting of proliferation and migration of these newly generated cells. As revealed by time-lapse experiments, closing of the gap occurred clearly faster with WT meso-thelial cells than with CR−/− cells (Fig. 4A1). From the scratch-closure distance (proportional to closure area; Fig. 4A2) as a function of time, the slope representing the wound closure rate was calculated. The value was clearly lower in CR−/− cells compared to WT cells (−29 %; Fig. 4A3). H2B (histone 2B)-GFP - labeled CR −/− mesothelial cells were mixed at a ratio of 1:1 with non-fluorescent WT cells and cells were let to grow to confluence (Fig. 4B1). Then, a scratch was made and cells were grown again to 100 % confluence, i.e. until the gap was closed. The gap was colonized to a large extent by non-fluorescent WT mesothelial cells (Fig. 4B1), in line with results shown in Fig. 4A1. Histone-GFP labeled cells were monitored after the scratch to assess cell mo-bility (Fig. 4B2) and quantified as distance travelled (in μm) per 15 min (Fig. 4B3). CR−/− cells showed a signifi-cantly decreased mobility (*p < 0.05).
Prolongation of the G1phase of CR−/− mesothelial cells is
the major cause for the decrease in proliferation and the prolonged gap-closure time in the scratch assay
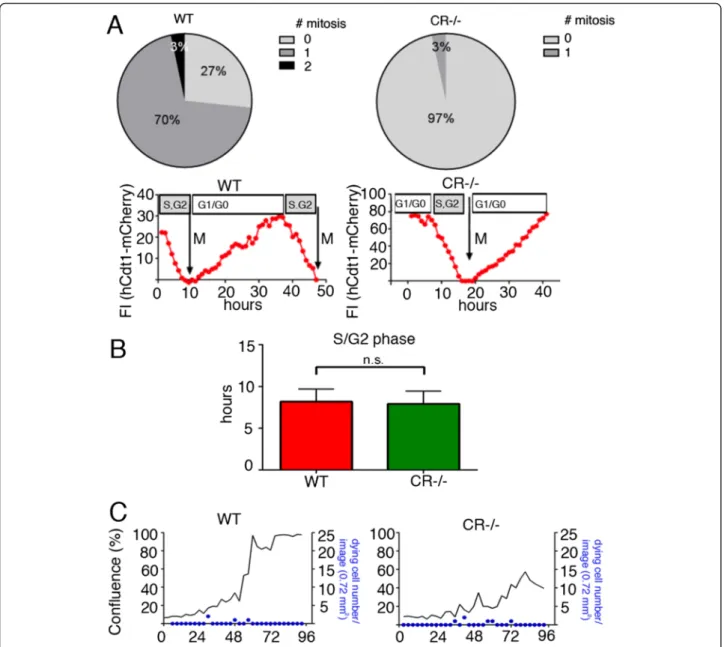
Since closure of a scratch consists of at least 2 processes, cell mobility and cell proliferation, we next investigated cell proliferation during the wound closing time of 24 h. 73 % of WT cells underwent at least one mitosis, whereas only 3 % mitotic CR−/− cells were observed during this period (Fig. 5a). For a detailed cell cycle ana-lyses mesothelial cells were transfected with plasmids coding for fluorescent, cell cycle-dependent marker pro-teins as described before [6, 18, 19]. Expression of hCdt1-mCherry is highest at the end of the G1 phase and decreases/disappears during the S/G2 phase. Thus, single mesothelial cells from WT and CR−/− mice were
traced for changes in fluorescence for a period of 2 days (Fig. 5b). Since a considerable number of cells, particu-larly from CR−/− mice did not divide in the 2-day obser-vation period, the precise length of the G1phase could not be accurately determined. However cells entering S phase characterized by a decrease in hCdt1 fluorescence, generally entered mitosis within the observation period and thus allowed to determine the length of the S/G2/M phase, which was found to be approximately of 8 h, irre-spective of genotype (Fig. 5b). This strongly hinted to-wards a prolongation of the G0/G1phase in CR−/− cells. In order to exclude that the apparent slower prolifera-tion results from an increase in dying cells, cell death was monitored with the Incucyte system using the Cell-ToxGreen assay (Fig. 5c). In this assay, the cell-impermeant dye emits a strong fluorescent signal, when bound to DNA, as the result of impaired plasma mem-brane integrity, which occurs during necrosis and late apoptosis in vitro. After trypsinization and plating of the mesothelial cells at low density, dead (green) cells were relatively abundant in relation to the total number of cells, most probably resulting from the trypsinization. In cultures from faster growing WT cells (Fig. 5c) and in the slower growing CR−/− cells, the density of dead cells was not significantly different (Fig. 5c). Thus, the lower cell number observed in CR−/− cultures was not the re-sult of increased cell death in the absence of CR, but most probably caused by a prolonged G0/G1 phase. In summary, several mechanisms in WT mesothelial cells contribute to a faster gap closure including higher prolif-eration (Figs. 2 and 5) and increased mobility (Fig. 4). Mesothelial cells overexpressing nuclear-targeted CR (NLS-CR) show an increased proliferation in both genotypes
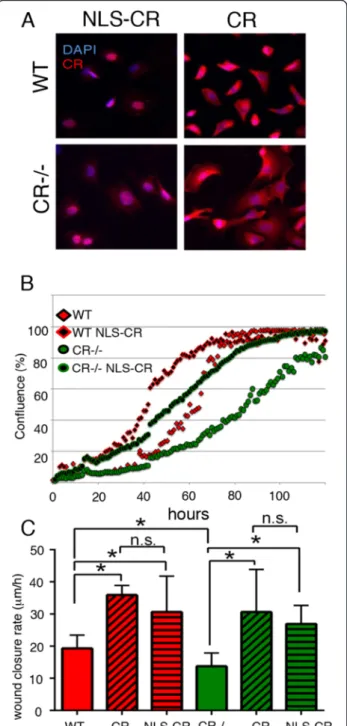
Although CR is considered mostly as a cytosolic protein, several reports on CR expression in cell lines in vitro and more importantly in MM samples from patients [24] have demonstrated strong nuclear CR immunola-beling. We set out to test, whether the proliferation phenotype by CR overexpression in WT and CR−/− cells could be reproduced by selectively expressing CR in the nucleus. For this we generated a plasmid coding for a protein named NLS-CR with a nuclear localization sig-nal (NLS) sequence followed by the cDNA coding for full-length CR. Transduction by lentivirus of primary mesothelial cells from WT and CR−/− mice resulted in a strong signal in cells stained with a CR antiserum and staining was mostly confined to the nucleus (Fig. 6a). Expression of NLS-CR increased the rate of cell prolifer-ation (left shift of the logarithmic growth phase) in both WT and CR−/− mesothelial cells (Fig. 6b). In the scratch assay NLS-CR also shortened the “wound closure time” for cells of both genotypes evidenced by the increased
Fig. 4 a1 Time-lapse brightfield images were taken after a scratch (black area) was made at t = 0 in a confluent layer (grey area) of prMC from WT and CR−/− mice. Images were taken every 2 hours and “wound closure” was measured as the rate at which the scratched area (black) was repopulated with mesothelial cells (grey zone). a2 The wound closure distance as a function of time resulted in the rate of cell re-colonization (“wound closure rate”: slope); a representative example for WT and CR−/− prMC is shown. a3 Quantitative analyses yielded closure rates of 19.3 ± 4.1μm/h (mean ± S.D.) for WT and 13.7 ± 4.2 μm/h for CR−/− prMC (8–10 independent experiments per genotype; *p < 0.05; t-test) (b1) A scratch was made in a confluent layer initially consisting of non-fluorescent (black) WT cells and H2B - GFP-labeled CR−/− cells at a ratio of 1:1. The pre-scratch situation is depicted in the upper panel (brightfield image: left; GFP fluorescence (right). After complete gap closure, the initially void region was mostly filled (invaded) by non-fluorescent WT cells. b2 Measurement of cell mobility of single mesothelial cells (n = 10 cells per genotype) shows significant differences (*p < 0.05 two tailed t-test) in the mobility of WT and CR−/− cells quantified in (b3), where the cell movement was measured (inμm) per 15 min time interval
wound closure rate (Fig. 6c). In the same series of experi-ments also the wound closure rates caused by CR overex-pression were measured. A significant increase in the closure rate was observed for both, CR and NLS-CR over-expressing cells in comparison to control prMC from ei-ther WT or CR-/-mice; the magnitude of the effect, i.e. the increase of the closure rate was the same for CR and NLS-CR (Fig. 6c). Thus, NLS-CR had a strong effect on proliferation and wound closure rates; this indicates that besides CR’s well-accepted function as a Ca2+
buffer [25] CR might have additional functions, probably also in the
nucleus, possibly implicated in the regulation of transcrip-tion [26] (for more details, see Discussion).
CR and NLS-CR affect the morphology of prMC
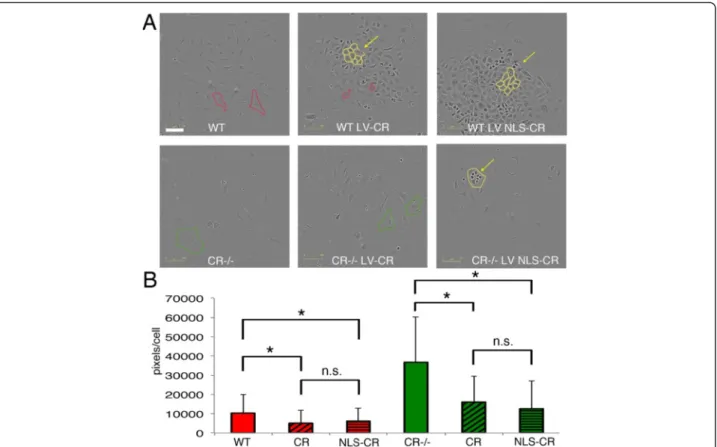
Based on the differences in the surface area covered by prMC derived from WT and CR−/− mice (Fig. 1j), we tested whether overexpression of CR and NLS-CR af-fected the size of prMC of either genotype. WT cells were characterized by a rather flattened morphology (Fig. 7a) as also shown in Fig. 1b, c); cells from CR−/− mice covered an even larger area, also shown in
Fig. 5 a During a 24 h observation period 70 % of WT prMC undergo mitosis (Mit1), 3 % of cells even 2 mitosis (Mit2) compared to CR−/− cells, where only 3 % of cells undergo mitosis (n = 30 cells per genotype). b Cell-cycle dependent changes in hCdt1-mCherry fluorescence monitored in prMC from WT and CR−/− mice. While the length of the S/G2/M phase is similar in both genotypes, the slower proliferation rate in CR−/− cells
is the result of a prolonged G0/G1phase. Signals are from 8 cells per genotype. Quantification of the S/G2/M phase in WT and CR−/− cells (bars
represent means + SD; n = 10 cells per genotype). c Overlay of the real-time cell proliferation curves (black lines) and the density of dying cells (blue) in WT (left) and CR−/− (right) cell cultures. The blue dots display the number of newly emerging dying cells
Fig. 1b, c). Quantitative analyses revealed the area covered by a single CR−/− prMC to be clearly larger (Figs. 7b and 1j). Overexpression of both CR and NLS-CR was accompanied by a morphological change resulting in cells with a rather cobblestone-like morphology, typical for reactive mesothelial cells in
situ, as well as for epithelioid MM cells (Fig. 7a). As a consequence, the area covered by one cell was much reduced; the size reduction was of similar mag-nitude for prMC overexpressing CR or NLS-CR. A size reduction was also present in CR−/− prMC over-expressing either CR variant (Fig. 7b); no statistically significant differences were evident when comparing the effects of CR and NLS-CR (Fig. 7b). Of note CR −/− prMC, even after increasing levels of CR or NLS-CR, covered a larger area than the corresponding WT prMC indicating that the overexpression of either CR variant in CR−/− prMC wasn’t sufficient to fully re-vert to the WT morphology phenotype.
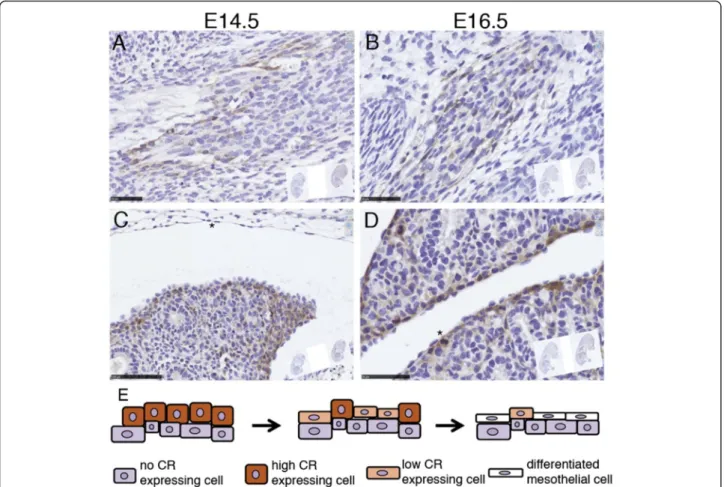
CR is transiently expressed during embryonic development in lung mesenchymal tissue and is correlated with the differentiation of mesothelial cells Since CR protein expression levels in primary mesothe-lial cells of both genotypes were below the detection level of the Western blot analyses (Fig. 1g), we sum-moned that the observed differences between WT and CR−/− cells including decreased proliferation and wound closure time might result from differences in the development of these cells during embryogenesis. In-deed, mesothelial cells develop from mesenchyme and transient CR expression in chicken mesenchymal cells had been reported before [27, 28]. In a mouse reporter strain (Calb2tm1(cre)Zjh) the activity of the Calb2 pro-moter was demonstrated by lacZ staining in the mesen-chyme of the lung [25]. Thus, we investigated CR protein expression in the mouse lung mesenchyme and the embryonic mesothelium. Expression of CR was ob-served in some dispersed cells in the lung mesenchyme of E14.5 and E16.5 mouse embryos (Fig. 8a, b). In the developing lung CR-positive cells were observed in the mesenchyme surrounding the epithelial cells and the staining was particularly strong in cells forming the mesothelium or just below the layer of mesothelial pre-cursor cells at E14.5 (Fig. 8c). At E16.5 strong staining was observed in the developing mesothelium character-ized by cuboidal cells, whereas likely differentiated, i.e. mesothelial cells characterized by their flat morphology were devoid of CR expression (Fig. 8d). Proliferating, e.g. mitotic cells (asterisk in Fig. 8d) adjacent to the meso-thelial cell layer also showed strong CR staining. Of note, the completely flat mesothelial cell layer of the vis-ceral pleura indicative of a fully differentiated mesothe-lium already at E14.5 was CR-negative, while cuboidal cells (active, proliferating cells in development) of the parietal pleura of the lung revealed high CR expression. Thus, CR is transiently expressed in mesothelial precur-sor cells during mouse embryonic development and the development of the visceral pleura appears to precede
Fig. 6 a IHC showing nuclear localization of NLS-CR and relatively homogenous localization of CR in WT and CR−/− prMC overexpressing either variant. b Expression of NLS-CR leads to an increase in
proliferation as well as a decrease in the wound closure rate (c) in prMC from either genotype (WT and CR−/−). Effects exerted by CR and NLS-CR are similar
the one of the parietal pleura, based on cell morphology and CR staining.
Discussion
In this study we provide evidence that CR and more-over nuclear-targeted CR is able to increase prolifera-tion and mobility when expressed in prMC in vitro; the presence of either variant caused a morphological change towards a more epithelioid morphology. In addition we observed that CR is expressed in meso-thelial progenitor during lung development. While CR-deficient mice develop a normal mesothelium in vivo, phenotypic differences exist in CR−/− primary mesothelial cells maintained in vitro when compared to WT-derived mesothelial cells.
CR expression is considered as one of the most select-ive markers for mesothelioma [29]. However, CR’s func-tion has been investigated in greater detail mostly in neurons [30], recently also describing CR’s undisputed Ca2+ sensor function [31]. In immortalized mesothelial cells, CR protects against asbestos-induced cytotoxicity
and consequently CR up-regulation was proposed to favor mesotheliomagenesis [15]. In human mesothelioma cell lines CR is vital for cell proliferation and survival in vitro [6]. Thus, CR might emerge as a potential new tar-get for mesothelioma therapy [6]. The precise molecular pathways, possible interaction sites and/or partners as well as exact function(s) of CR are still unknown in mesothelial cells and mesothelioma. In our study we showed the involvement of CR in the proliferation of primary mesothelial cells mimicking to some extent the reactive mesothelium, where CR expression has been ob-served [3].
CR protein in cultured primary mesothelial cells main-tained for a short period (<8 weeks in vitro) was found to be absent or then present at extremely low levels, i.e. below the detection limit of Western blot analysis. In neurons, where CR was shown to act as a Ca2+ buffer [32, 33], the protein concentration is in the tens of mi-cromolar range. The CR concentration in rat inner and outer hair cells was reported as 19 ± 2 μM and 35 ± 3μM, respectively [34] similar as estimated in cerebellar
Fig. 7 a Bright field images of prMC from WT and CR−/− mice taken during the rapid (logarithmic) proliferation phase. Cells are characterized by their flat morphology yielding rather low-contrast images. For better visualization, the boundaries of selected cells are marked by red (WT) or green (CR−/−) lines. The surface area of individual randomly selected cells was quantified (b). The surface area of CR−/− cells is clearly larger (also shown in Fig. 1j). Overexpression of CR (LV-CR) or nuclear-targeted CR (LV NLS-CR) changes the morphology to cobblestone-like cuboid cells in prMC of both genotypes (a). Areas containing mostly polygonal cuboid cells or rounded mitotic cells are marked by yellow lines. Surface areas covered by those cells are significantly smaller than by the parental cells (*p < 0.05). No differences exist between prMC expressing either CR variant (n.s.). Scale bar: 100μm
granule cells (30 μM) [35]. In human mesothelioma cell lines, CR concentrations were found to be in the same range (1– 100 μM) (W. Blum, unpublished data). Since in cultured primary mesothelial cells, CR levels were below the detection limit of our Western blot analyses we estimated that [CR]i was below 100 nM. On the other hand, CR overexpression levels after lentivirus transduction may reach several hundreds of micromolar, as estimated by overexpression of a fusion protein con-sisting of the enhanced blue fluorescent protein and CR in primary mouse mesothelial cells using the identical lentiviral expression system [8]. The effects on prolifera-tion and mobility were similar when CR overexpression was specifically nuclear. CR’s specific sensor functions in the nucleus might be of relevance, CR was previously shown to inhibit the DNA binding of E-proteins and CR overexpression inhibited activation of transcription by the E-proteins E12 and E47 [36]. For directed migration occurring during the scratch closure process, microtubu-lar reorganization plays a pivotal role [37]. Microtubule
organizing centers (MTOCs) and centrioles play an es-sential role in establishing the direction of cell migration [38]. In endothelial cells, the MTOC turns towards the cell-depleted space, when the cells start to migrate. Our findings may also shed light on the importance of the previously reported interaction between CR and the cytoskeletal system including the centriole in interphase cells [39, 40].
An explanation for the observed differences between WT and CR−/− primary mesothelial cells might lie in differences resulting during embryonic development. Here we showed that mesothelial precursor cells with cuboid morphology transiently expressed high levels of CR in WT mice evidenced at E14.5 and E16.5. The fact that CR is expressed transiently during lung branching morphogenesis is already exploited for con-ditional gene expression at this developmental period specifically in mesothelial precursors [28]. In contrast, the single cell layer of mesothelial cells characterized by their flat morphology was CR-negative. If one
Fig. 8 CR expression in cells of embryonic connective tissue (mesenchyme) in mouse embryos of E14.5 and E16.5 (a, b). The developing lung mesothelial precursor cells surrounding the lung (epithelial) tissue show transient expression of CR. Cuboidal proliferative cells including a mitotic cell (* in D) show high CR expression, while likely differentiated mesothelial cells (flat morphology, arrowheads in c & d) show weak to absent CR immunoreactivity (c, d). Schematic drawing of the proposed differentiation process from precursor mesenchymal cells to mesothelial cells and the corresponding transient CR expression (e). The proposed model is in agreement with recent findings of lineage analysis during lung mesenchyme development [43]. Scale bar 50μm in (a) and (c) and 100 μm in (b) and (d)
hypothesizes that this transient CR expression might be linked to a developmental program, its absence in CR−/− mice might result in a slightly altered/modi-fied developmental program. This difference did not durably affect the forming of the mesothelial cell layer, since no striking differences were observed in the mesothelium of CR−/− mice in vivo. However, small long-lasting and persistent changes might be the cause for the significantly different behavior of primary mesothelial cells observed in vitro, where some developmental programs may be reactivated. Ex-pression of CR and of NLS-CR (representing the situ-ation present in human reactive mesothelium) in both genotypes resulted in increased proliferation, scratch closure rate and a more epithelioid (cuboid) morph-ology. Thus, also mesothelial cells of CR−/− mice that had never experienced the transient CR expression phase were receptive to increased CR levels, either when increased within the entire cell or even when selectively expressed in the nucleus.
Precursor mesothelial cells originating from CR−/− animals might have acquired compensatory/adaptive mechanism according to the concept of the Ca2+ homeostasome [41] to cope with the lack of CR in order to reach full differentiation towards almost “normal” mesothelial cells. This compensation might cause some irreversible changes with respect to morphology/function and those differences might be manifest only under certain experimental conditions, e.g. when comparing proliferation and mobility prop-erties in vitro. Interestingly, this hypothesis appears to be selective for cells with a “known CR history”; fi-broblasts, cells assumed to be CR-negative throughout their ontogeny are not affected, at least not with re-spect to parameters investigated in this study.
Conclusions
Our results in primary mesothelial cells are in sup-port of CR playing an imsup-portant role in cell prolifera-tion and mobility. We hypothesize that the lack of transient CR expression during embryonic develop-ment in the mesenchyme and in mesothelial precur-sor cells entails irreversible changes in the growth characteristics of primary mesothelial cells of CR−/− origin. The importance of CR in mesothelioma as a diagnostic marker [3, 5], as well as its essential func-tion in mesothelioma cell lines [6] emphasize the need of understanding the function and involvement of CR in mesothelium development and mesothelium tissue repair, e.g. after exposure to asbestos. As the result of such a tissue injury, a mesothelial-mesenchyme transition might occur [42] reverting the phenotype to a CR-expressing, rapidly proliferating
one. Future experiments are expected to also shed light on the question, whether CR’s absence in CR−/− mice will affect MM development in vivo.
Competing interests
The authors confirm that we have read BioMed Central’s guidance on competing interests and confirm that none of the authors have any competing interests in the manuscript.
Authors’ contribution
WB and LP carried out essentially all experiments described in this study, participated in the design and the data evaluation. BS conceived of the study, BS and EFB participated in its design and coordination and helped to draft the manuscript. All authors read and approved the final manuscript.
Acknowledgements
The authors are grateful to Brigitte Scolari, Marlène Sanchez, Valérie Salicio, Simone Eichenberger, Martine Steinauer, Dr. Thomas Henzi, Dr. Viktória Szabolcsi and Prof. Marco Celio for technical assistance. The authors thank Prof. D. Trono (EPFL, Lausanne, Switzerland) for providing pLVTHM (Addgene plasmid #12247), Dr. E. Campeau for pCMV/TO SV40 (Addgene plasmid #22298), Dr. E. Fuchs (The Rockefeller University) for pLKO.1-H2B-GFP (Addgene plasmid #25999) and Prof. P. Tsoulfas for pLV-EBFP2-nuc (Addgene plasmid #36085). We acknowledge the financial support from the Swiss National Science Foundation (SNF; grant #130680 to BS), SNF Sinergia grant CRSII3 #147697/1 to EFB and BS and the San Salvatore Foundation to BS and EFB.
Author details
1
Unit of Anatomy, Department of Medicine, University of Fribourg, Route Albert-Gockel 1, CH-1700 Fribourg, Switzerland.2Laboratory of Molecular
Oncology, University Hospital Zürich, Labor 40E, Sternwartstrasse 14, 8091 Zurich, Switzerland.
Received: 11 June 2015 Accepted: 9 December 2015
References
1. Mutsaers SE. The mesothelial cell. Int J Biochem Cell Biol. 2004;36:9–16. 2. Mutsaers SE, Whitaker D, Papadimitriou JM. Stimulation of Mesothelial Cell
Proliferation by Exudate Macrophages Enhances Serosal Wound Healing in a Murine Model. Am J Pathol. 2002;160:681–92.
3. Gotzos V, Vogt P, Celio MR. The calcium binding protein calretinin is a selective marker for malignant pleural mesotheliomas of the epithelial type. Pathol Res Pract. 1996;192:137–47.
4. Husain AN, Colby T, Ordonez N, Krausz T, Attanoos R, Beasley MB, et al. Guidelines for Pathologic Diagnosis of Malignant Mesothelioma: 2012 Update of the Consensus Statement from the International Mesothelioma Interest Group. Arch Pathol Lab Med. 2013;137:647–67.
5. Doglioni CC, Tos APAD, Laurino LL, Iuzzolino PP, Chiarelli CC, Celio MRM, et al. Calretinin: a novel immunocytochemical marker for mesothelioma. Am J Surg Pathol. 1996;20:1037–46.
6. Blum W, Schwaller B. Calretinin is essential for mesothelioma cell growth/ survival in vitro: A potential new target for malignant mesothelioma therapy? Int J Cancer. 2013;133:2077–88.
7. Patergnani S, Giorgi C, Maniero S, Missiroli S, Maniscalco P, Bononi I, et al. The endoplasmic reticulum mitochondrial calcium cross talk is
downregulated in malignant pleural mesothelioma cells and plays a critical role in apoptosis inhibition. Oncotarget. 2015;6:23427–44.
8. Pecze L, Blum W, Schwaller B. Routes of Ca2+Shuttling during Ca2+
Oscillations; Focus on the Role of Mitochondrial Ca2+Handling and
Cytosolic Ca2+Buffers. J Biol Chem. 2015.
9. Blum W, Pecze L, Felley-Bosco E, Worthmüller-Rodriguez J, Wu L, Vrugt B, et al. Establishment of immortalized murine mesothelial cells and a novel mesothelioma cell line. In Vitro Cell Dev Biol Anim. 2015;51:714–21. 10. Pecze L, Schwaller B. Characterization and modeling of Ca2+oscillations in
mouse primary mesothelial cells. Biochim Biophys Acta. 2015;1854:632–45. 11. Connell ND, Rheinwald JG. Regulation of the cytoskeleton in mesothelial
cells: reversible loss of keratin and increase in vimentin during rapid growth in culture. Cell. 1983;34:245–53.
12. Horváth L, Magrez A, Burghard M, Kern K, Forró L, Schwaller B. Evaluation of the toxicity of graphene derivatives on cells of the lung luminal surface. Carbon. 2013;64(C):45–60.
13. Szabolcsi V, Celio MR. De novo expression of parvalbumin in ependymal cells in response to brain injury promotes ependymal remodeling and wound repair. Glia. 2015;63:567–94.
14. D'Orlando C, Fellay B, Schwaller B, Salicio V, Bloc A, Gotzos V, et al. Calretinin and calbindin D-28 k delay the onset of cell death after excitotoxic stimulation in transfected P19 cells. Brain Res. 2001;909:145–58. 15. Henzi T, Blum W-V, Pfefferli M, Kawecki TJ, Salicio V, Schwaller B.
SV40-Induced Expression of Calretinin Protects Mesothelial Cells from Asbestos Cytotoxicity and May Be a Key Factor Contributing to Mesothelioma Pathogenesis. Am J Pathol. 2009;174:2324–36.
16. Luo H, Rankin GO, Straley S, Chen YC. Journal of Pharmacological and Toxicological Methods. J Pharmacol Toxicol Methods. 2011;64:233–7. 17. Sage D, Unser M, Salmon P, Dibner C. A software solution for recording
circadian oscillator features in time-lapse live cell microscopy. Cell Div. 2010;5:17.
18. Sakaue-Sawano A, Kurokawa H, Morimura T, Hanyu A, Hama H, Osawa H, et al. Visualizing Spatiotemporal Dynamics of Multicellular Cell-Cycle Progression. Cell. 2008;132:487–98.
19. Abe T, Sakaue-Sawano A, Kiyonari H, Shioi G, Inoue KI, Horiuchi T, et al. Visualization of cell cycle in mouse embryos with Fucci2 reporter directed by Rosa26 promoter. Development. 2012;140:237–46.
20. Ferrandez-lzquierdo A, Navarro-Fos S, Gonzalez-Devesa M, Gil-Benso R, Llombart-Bosch A. Immunocytochemical typification of mesothelial cells in effusions: In vivo and in vitro models. Diagn Cytopathol. 1994;10:256–62. 21. Mosmann T. Rapid colorimetric assay for cellular growth and survival:
application to proliferation and cytotoxicity assays. J Immunol Methods. 1983;65:55–63.
22. Foddis R, De Rienzo A, Broccoli D, Bocchetta M, Stekala E, Rizzo P, et al. SV40 infection induces telomerase activity in human mesothelial cells. Oncogene. 2002;21:1434–42.
23. Bocchetta M, Di Resta I, Powers A, Fresco R, Tosolini A, Testa JR, et al. Human mesothelial cells are unusually susceptible to simian virus 40-mediated transformation and asbestos cocarcinogenicity. Proc Natl Acad Sci U S A. 2000;97:10214–9.
24. Ordóñez NG, Sahin AA. Diagnostic utility of immunohistochemistryin distinguishing between epithelioid pleuralmesotheliomas and breast carcinomas:a comparative study. Hum Pathol. 2014;45:1529–40. 25. Schwaller B. Calretinin: from a“simple” Ca2+buffer to a multifunctional
protein implicated in many biological processes. Front Neuroanat. 2014. 26. Saarikettu J. Calcium/Calmodulin Inhibition of Transcriptional Activity of
E-proteins by Prevention of Their Binding to DNA. J Biol Chem. 2004;279:41004–11.
27. Gangji V, Bastianelli E, Rooze M. Transient Calretinin Expression during Intervertebral Disc Formation of the Chick Embryo Gangji 2008 -Development, Growth & Differentiation - Wiley Online Library. Development. 1994;36:1–8.
28. Http://Www.Informatics.Jax.org/. 2015:1–1.
29. Hyun TS, Barnes M, Tabatabai ZL. The diagnostic utility of D2-40, calretinin, CK5/6, desmin and MOC-31 in the differentiation of mesothelioma from adenocarcinoma in pleural effusion cytology. Acta Cytol. 2012;56:527–32. 30. Schwaller B. The use of transgenic mouse models to reveal the functions of
Ca2+buffer proteins in excitable cells. Biochim Biophys Acta Gen Subj. 2012;
1820:1294–303.
31. Christel CJ, Schaer R, Wang S, Henzi T, Kreiner L, Grabs D, et al. Calretinin Regulates Ca2 +−dependent Inactivation and Facilitation of Ca
v2.1 Ca2+
Channels through a Direct Interaction with theα 12.1Subunit. J Biol Chem.
2012;287:39766–75.
32. Schmidt H, Brachtendorf S, Arendt O, Hallermann S, Ishiyama S, Bornschein G, et al. Nanodomain Couplingat an Excitatory Cortical Synapse. Curr Biol. 2013;23:244–9.
33. Gall D, Roussel C, Nieus T, Cheron G, Servais L, D'Angelo E, et al. Role of calcium binding proteins in the control of cerebellar granule cell neuronal excitability: experimental and modeling studies. Prog Brain Res. 2005;148:321–8.
34. Hackney CM. The Concentrations of Calcium Buffering Proteins in Mammalian Cochlear Hair Cells. J Neurosci. 2005;25:7867–75.
35. Gall D, Roussel CL, Susa I, D'Angelo E, Rossi P, Bearzatto B, et al. Altered neuronal excitability in cerebellar granule cells of mice lacking calretinin. J Neurosci. 2003;23:9320–7.
36. Saarikettu J. Calcium Regulation and Functions of Basic Helix-Loop-Helix Transcription Factors. Doctoral Thesis. 2005
37. Malech HLH, Root RKR, Gallin JIJ. Structural analysis of human neutrophil migration. Centriole, microtubule, and microfilament orientation and function during chemotaxis. J Cell Biol. 1977;75:666–93.
38. Gotlieb AI, May LM, Subrahmanyan L, Kalnins VI. Distribution of microtubule organizing centers in migrating sheets of endothelial cells. J Cell Biol. 1981;91:589–94.
39. Marilley D. Association between the Calcium-Binding Protein Calretinin and Cytoskeletal Components in the Human Colon Adenocarcinoma Cell Line WiDr. Exp Cell Res. 2000;259:12–22.
40. Gotzos V, Schwaller B, Hetzel N, Bustos-Castillo M, Celio MR. Expression of the calcium binding protein calretinin in WiDr cells and its correlation to their cell cycle. Exp Cell Res. 1992;202:292–302.
41. Schwaller B. The Regulation of a Cell’s Ca2+Signaling Toolkit: The Ca2+
Homeostasome. In: Advances in Experimental Medicine and Biology. Volume 740. Dordrecht: Springer Netherlands; 2012. p. 1–25 [Advances in Experimental Medicine and Biology].
42. Qi F, Okimoto G, Jube S, Napolitano A, Pass HI, Laczko R, et al. Continuous Exposure to Chrysotile Asbestos Can Cause Transformation of Human Mesothelial Cells via HMGB1 and TNF-a Signaling. Am J Pathol. 2013;183:1654–66.
43. Kumar ME, Bogard PE, Espinoza FH, Menke DB, Kingsley DM, Krasnow MA. Defining a mesenchymal progenitor niche at single-cell resolution. Science. 2014;346:1258810–0.
• We accept pre-submission inquiries
• Our selector tool helps you to find the most relevant journal
• We provide round the clock customer support
• Convenient online submission
• Thorough peer review
• Inclusion in PubMed and all major indexing services
• Maximum visibility for your research Submit your manuscript at
www.biomedcentral.com/submit