Assessing the Usefulness of NetworkDissection in
Identifying the Interpretability of Facial
Characterization Networks
by
Elizabeth Dethy
Submitted to the Department of Electrical Engineering and Computer
Science
in partial fulfillment of the requirements for the degree of
Master of Engineering in Computer Science and Engineering
at the
MASSACHUSETTS INSTITUTE OF TECHNOLOGY
September 2018
© Elizabeth Dethy, MMXVIII. All rights reserved.
The author hereby grants to MIT permission to reproduce and to
distribute publicly paper and electronic copies of this thesis document
in whole or in part in any medium now known or hereafter created.
Author . . . .
Department of Electrical Engineering and Computer Science
September 19, 2018
Certified by. . . .
Daniel J. Weitzner
Principal Research Scientist
Thesis Supervisor
Accepted by . . . .
Katrina LaCurts
Chair, Master of Engineering Thesis Committee
Assessing the Usefulness of NetworkDissection in Identifying
the Interpretability of Facial Characterization Networks
by
Elizabeth Dethy
Submitted to the Department of Electrical Engineering and Computer Science on September 19, 2018, in partial fulfillment of the
requirements for the degree of
Master of Engineering in Computer Science and Engineering
Abstract
In this thesis I test for the emergence of policy relevant features as disentangled, human interpretable representations in facial characterization networks. I probe an age and gender classifier using the NetworkDissection method with a hand labelled dataset of facial features, skin tones, and textures. Facial features and skin tones emerge as disentangled concepts in each of the networks probed. The emergence of these features in a smaller image classification network indicates the effectiveness of the NetworkDissection method in contexts other than ones studied in the original paper. Moreover, the emergence of policy relevant features, skin tones, indicates the method may be effective in identifying policy sensitive attributes. I also analyze the robustness of the NetworkDissection technique itself to changes in a key component of the experimental setup: the source of ground truth human understandable concepts. The results demonstrate the technique reliably applies labels when new concepts and samples are added to the set of ground truth labels.
Thesis Supervisor: Daniel J. Weitzner Title: Principal Research Scientist
Acknowledgments
I would like to extend a thank you to
My family for all their love and support.
Jonathan for providing excellent technical guidance and being a great sounding board during this process. I am so grateful to have had your support. Thank you for the time you spent advising, supporting, and reading countless drafts as this was under development.
Daniel Weitzner, for the continued support and pushing me to think long and deeply about the policy implications of this work
David Bau and Leilani Gilpin for providing feedback on early drafts
The Internet Policy Research Initiative (IPRI). I was challenged every day to think broadly about the impact of the technical work and the policy implications of recent technical developments. I will leave MIT with a profound apprecia-tion for considering the societal implicaapprecia-tions of our rapidly changing technical landscape
Contents
1 Introduction 13 2 Motivation 15 3 Related Work 17 3.1 Explanation Generation . . . 18 3.2 Saliency Mapping . . . 21 3.3 Representation Analysis . . . 223.4 Facial Recognition Interpretability . . . 24
4 Methodology 25 4.1 Review of the NetworkDissection Technique . . . 26
4.2 Review of Datasets Used in Experiments . . . 27
4.2.1 FaceTexture Dataset: Labelled Facial Features, Labelled Skin Tones, Labelled Textures . . . 27
4.2.2 Broden Dataset . . . 33
4.2.3 BrodenFace Dataset . . . 33
4.2.4 Models Interrogated . . . 34
4.3 Experiments Conducted . . . 35
4.3.1 Experiment 1: Probe age and gender classifiers using NetworkDis-section with FaceTexture source of ground truth labels . . . . 35 4.3.2 Experiment 2: Probe age and gender classification networks
4.3.3 Policy Significance . . . 37
5 Results 39
5.1 Probing for Disentangled Skin Tones and Facial Features in Age and Gender Classification Networks . . . 39 5.1.1 Analysis of Results . . . 42 5.1.2 Mislabelled Units . . . 43 5.2 Evaluating Reliability with Broden, BrodenFace, and FaceTexture . . 44 5.2.1 Comparing Labelled Units in Broden and BrodenFace . . . 45 5.2.2 Why FaceNet Labels More Units than BrodenFace . . . 47 5.2.3 Policy Implications . . . 47
6 Future Work 51
List of Figures
3-1 Example Explanation for Classifying Western Grebe from [9] . . . 19
3-2 Example Explanations for Classifying Birds from [9] . . . 19
3-3 Example Justification from [10] . . . 20
3-4 Example from [11] . . . 22
3-5 Saliency Map Generated from Back-Propagation Pass [12] . . . 22
4-1 Labelled Facial Features for Barbra Streisand Image from LFW . . . 29
4-2 Representative SkinTone Shades . . . 30
4-3 Representative Skin Tone Color Samples . . . 31
4-4 Example Samples from the Describable Textures Dataset . . . 32
5-1 Sample Activations of Units Labelled: Mouth, Nose, Eyebrow, Face in AgeNet . . . 42
5-2 Sample of Top Activated Images for Unit 7: Orange . . . 43
List of Tables
4.1 BGR Values Corresponding to Facial Features . . . 29
4.2 Skin Tone Samples . . . 31
4.3 FaceTexture Dataset Statistics . . . 33
4.4 Broden Dataset Statistics . . . 33
4.5 BrodenFace Dataset Statistics . . . 34
5.1 Number of Labelled Units in AgeNet and FaceNet . . . 40
5.2 Disentangled Features in GenderNet Conv1 . . . 40
5.3 Disentangled Features in AgeNet Conv1 . . . 40
5.4 Disentangled Features in Gender Net Conv2 . . . 41
5.5 Disentangled Features in Age Net Conv2 . . . 41
5.6 Disentangled Features in Gender Net Conv3 . . . 41
5.7 Disentangled Features in Age Net Conv3 . . . 41
5.8 Number of Labelled Units in AgetNet . . . 44
5.9 Layer 1 Mismatch Stats between Broden and BrodenFace . . . 45
5.10 Layer 2 Labelled Unit Quantities between Broden and BrodenFace . . 46
5.11 Layer 3 Labelled Unit Quantities between Broden and BrodenFace . . 46
5.12 Percentages of mismatched units in each layer with either "second choice matches" or a new category label is applied. . . 47
Chapter 1
Introduction
Machine learning algorithms predict cancer progression, determine whether an indi-vidual will default on a loan, and identify wanted criminals with facial recognition. The results of these decisions leave lasting impacts on individuals denied credit or misidentified as criminals. Users of these black-box models are expected to effectively use them, and trust their decisions, despite possessing little to no knowledge of the reason for the decision. Recent research reveals bias in common machine learning applications that can undermine the credibility of the algorithms [1].
In order for humans to use this new technology effectively, the user of the system must trust the system and the system's output. In high-trust environments, where results may leave lasting damage on individuals, it is paramount that a user of the system is capable of determining whether the decision fair. For some applications, it is also necessary that algorithms explain the reasons for the output [2].
Machine learning researchers, driven by the desire to create human trust and increase transparency in machine learning algorithms, are developing techniques to understand both how neural networks make decisions and to understand the relevant factors considered by the model. Many of these methods generate explanations de-signed to aid human understanding of the output. Despite recent work in the area, the field is still new. Objective measures for evaluating the quality and accuracy of a generated explanation do not exist. This limitation applies to both determining how understandable the explanation is to a human, and to determining how explainable
the model itself is. Addressing the challenge of fully explainable machine learning systems is an open problem in the field and one that will likely take several years to resolve, if it ever does.
There is hope. A key step towards understanding black-box models will be to shine the light on the internal workings of neural networks. Recent research created a measure to quantify the number of human interpretable concepts that emerge in deep neural networks. This enables any individual - whether a user of the system, a developer testing the system, or a regulator - to understand the human concepts a deep neural network learns during training. While a far cry from generating an explanation for image classification, the technique creates an objective measure for the interpretability of a network. Using the number of human interpretable concepts that emerge in a network as a metric of interpretability is not the only method to determine if it is possible to understand the relevant factors a neural network considers in its classification. However, a quantifiable metric provides an opportunity to compare claims of model interpretability in an objective fashion.
My work in this thesis probes the generalizability of this technique, called Net-workDissection. The original work focused on scene and object classification networks. I examine age and gender classification networks for the emergence of facial features and skin tones. I analyze three criteria in this work: first, the emergence of human understandable concepts in the hidden layers of age and gender classifiers; second, the implications of the emergence such concepts in the networks studied; and third, the reliability of the NetworkDissection technique and robustness of the identification of the concepts that emerge. I selected facial characterization networks to test because of the policy implications of detecting the emergence of policy relevant features, skin tones, in the network. Identifying whether policy relevant features emerge using the NetworkDissection technique will help bridge the technical and policy communities by applying a recent technical development to a relevant policy context.
Chapter 2
Motivation
For the past several years, the technical research community has accelerated the development of techniques to understand how neural networks make decisions. As the complexity of the problems machine learning has been tasked to solve has increased, the technical foundation on which the algorithms have been built has become more opaque. These powerful applications are commonly referred to as “black boxes”; they take inputs and render an output with no insight into the internal decision making process [3].
Recent work demonstrates that human trust increases in machine learning outputs when the user is provided a justification for the decision [4]. Finale Doshi-Velez and Mason Kortz advocate for explainable AI as a way to hold AI accountable for its decisions, in addition to increasing user trust [2]. Some still assume that, despite the technical progress to better understand machine learning models, requiring neural networks to provide explanations would be an impossible demand for today's networks to satisfy [5]. They claim it is infeasible to expect these models to provide explanations simple enough for a human to understand. Therefore, a regulatory requirement for explainability that is impossible to meet would prevent the adoption of these powerful new tools.
Meanwhile, despite incredible work designed to aid human understand of the fac-tors a model uses to reach a decision, the technical community has yet to establish mutually agreed upon definitions and benchmarks for interpretability and
explainabil-ity. While numerous papers across machine learning problem spaces claim to explain the results of neural networks, no collaborative benchmark exists to objectively eval-uate the effectiveness of the proposed approaches.
Common evaluation metrics for interpretability and explainability would help ground the debate about the feasability and trade-offs of generating explainable ma-chine learning. Not only would this help determine the technical boundaries of both explainability techniques and generating explainable models, but also potentially re-but claims that explainable machine learning is technically infeasible. Currently, the same researchers creating the techniques to determine model interpretability or explainability, also create the metrics to prove their theory.
The technical research has also failed to demonstrate relevance to and create excitement in the policy community. Explainability and interpretability techniques are not tested on policy relevant applications. A user identifying when a model has incorrectly classified an online commentator a "Christian" [6] carries far fewer policy implications than a user identifying when a model incorrectly denied an individual a loan; especially if the denial was based on a protected attribute.
My goal with this thesis is to apply an interpretability technique, NetworkDis-section, to a problem space with policy implications for the results. By using Net-workDissection to interrogate facial characterization networks we can determine if disengtangled concepts emerge in these types of networks, and, more generally, if this new technique is one that can be useful in aiding understanding of the internal workings of small image classification networks. The first goal will help move the technical research forward by examining the effectiveness of the NetworkDissection technique on a different type of problem. The second goal may potentially help in-dentify a promising technique that can be used generally to test and quantify the interpretability of all types of networks for image classification.
Chapter 3
Related Work
In this chapter I will review the recent literature in the field of interpretable and explainable machine learning. I will not use the two terms interchangeably. In this chapter I will provide the definitions for those terms and focus the analysis of recent work on interpretability techniques.
Recent work in the field of understanding neural networks has focused on the interpretability and explainability of networks. Doshi-Velez and Been Kim provide a definition of interpretability for machine learning networks, "the ability to explain or to present in understandable terms to a human" [7]. This definition conflates the interpretability of a network with explainability. If a network can explain its decision in a way that is understandable to humans, then it is interpretable. Conversely, if a model is interpretable, it provides an explanation in a way understandable to a human. This glosses over the significance of a deeper understanding of the internals of the neural network being asked to provide an explanation. In a new working paper, Gilpin et. al. provided new definitions for the terms interpretability and explainability that separates the two concepts [8].
interpretability: describing the internals of a system in a way that is un-derstandable to humans
explainability: describing the internals of a system in a way that is under-standable to humans and describing the system in an accurate way
The Gilpin defintion is similar to the one proffered by Kim and Doshi-Velez; both include understandability to humans as a key component of interpretability. Gilpin, however, focuses that understanding on the internals of the network. Some explain-ability techniques provide human understandable explanations for decisions without understanding or describing the internals of the network. Other techniques provide human understandable insight into the internal organization of the neural network. Doshi-Velez and Kim would consider the former to satisfy interpretability, but Gilpin would not. Gilpin would only consider the latter an interpretability technique because it provides insight into the internals of the network. To better differentiate between techniques that provide insight into the internals of the network from those that do not, I will use the Gilpin definition of interpretability and explainability in this work. The focus in this chapter will be discussing the following classes of interpretability techniques: Explanation Generation, Saliency Mapping, and Representation Anal-ysis. There are other classes of methods of interpretable and explainable machine learning I will not discuss in this paper.
Explanation Generation Provide a human understandable explanation for the decision of a neural network
Saliency Mapping Highlight most significant portions of an image used for classification
Representation Analysis Understand how a deep neural network orga-nizes internal data and determine the concepts hidden filters in the network learn
3.1
Explanation Generation
Benefits: Provide human understandable explanations for classifications made by neural networks. In some cases, the network can highlight regions of the image im-portant in creating the determination
Shortcomings: Requires an additional neural network to be trained in parallel with a classification network adding complexity and ambiguity; the explanation gen-eration network may be trained to provide convincing human explanations that are inaccurate.
Explanation generation is a technique used to provide human-readable explanations for the decisions of a neural network. The model created by Hendricks, et. al pro-duces a natural language justification for a deep visual recognition model's output [9]. The justification is class discriminative and accurately describes the given image. In that way, the textual explanation is a combination of specific image attributes with discriminative attributes shared by members of the class in which the image was classified. The goal is to answer the question of why the image was classified in a certain way. The paper provides the following example as an explanation for the identification of a bird in an image as a Wester Grebe. This example is reproduced in Figure 3-1.
Figure 3-1: Example Explanation for Classifying Western Grebe from [9] Figure 3-2 shows additional examples of the explanations generated by model created by Hendricks.
Figure 3-2: Example Explanations for Classifying Birds from [9]
In order to generate these explanations, a recurrant explanation generator model is trained simultaneously with the image classification model. The explanation gener-ator model is trained to produce human understandable sentences. In this technique,
therefore, two neural networks must be trained to provide an explanation for the clas-sification. The "because" statement that is generated is a justification for the result of the network. It is created after the result of the network has been determined. The technique does not probe the internals of the image classifier to determine the exact features the network uses. It is possible for the network to generate a justifiation that does not align with the features the network uses to determine the classification.
More recently, Park, et. al. pioneered an approach to explanation for image clas-sification problems [10]. In addition to providing a human understandable natural text explanation as in Hendricks, the explanation is accompanied by an image high-lighting key regions of the input image that led to the classification result. Figure 3-3 demonstrates an example result from the Park paper.
Figure 3-3: Example Justification from [10]
Humans tasked with determining whether or not the model performed accurately were more likely to do so with the multi-modal explanation technique than no pro-vided explanations or with text explanations alone. Although these networks may aid in human understanding and use of the network, the use of an additional neural network to explain the result of the original neural network used as the classifier adds complexity to the system. While the networks provide insight into the decision of the image classifier, no insight is provided into the generation of the explanation.
There-fore, it could be possible the explanation generator produces human understandable explanations that are inconsistent with the actual behavior of the network. However, as the actual behavior of the network is not known, identifying these cases may not be possible.
3.2
Saliency Mapping
Benefits: Visually illustrates the regions of an image important to the network in determining the image's output class.
Shortcomings: While the procedure provides local understanding, the higher level reasoning of the network is not discernable with this technique.
Saliency mapping is a technique that can be applied to deep neural networks for computer vision problems to identify features in an image relevant for classification. The output is a heat map of input sensitivity. As a hypothetical example, suppose the image of a cat were run through an image classification network. The output is the label, "cat". Using the saliency mapping technique, the image of the cat can be overlayed with a heatmap with red colors over the whiskers, ears, and tail (indicating the output classification is sensitive to these features).
Zeiler, et. al proposed the technique that can, for any activation layer in a convo-lutional neural network, map the feature activity of the layer back onto the original pixel space [11]. The feature activations at each layer, projected back onto the orig-inal pixel space create a visualization of the regions of the image the layers of the network are activating on. Figure 3-4 is an image from the paper showing the feature activity of an input image mapped back to the original pixel space.
Simonyan, et. al followed the work of Zeiler and demonstrated a way to produce a saliency map with a single back-propagation pass [12]. Figure 3-5 shows an example from the paper of a saliency map produced.
While the saliency mapping method visually illustrates the features relevant to making a local decision, the higher level logic is not able to be determined using this
Figure 3-4: Example from [11]
Figure 3-5: Saliency Map Generated from Back-Propagation Pass [12] method at this time.
3.3
Representation Analysis
Benefits: Quantifiable measure of the interpretability of a convolutional neural network by counting the number of human interpretable concepts that emerge in the learned convolutional filters
Shortcomings: Does not provide an explanation for the decisions of the network based on the emergence of human interpretable concepts learned by the network.
convolu-tional neural networks for disentangled features learned by filters in each convoluconvolu-tional unit. Research has demonstrated qualitatively that object detectors emerge in deep neural networks, despite the networks not being supplied object labels during training [13]. The work relied on Amazon Mechanical Turk workers to identify the common element in a set of images that triggered the receptive field of a set of test images.
Follow-up work removed the reliance on human-identification and automatically labelled the concept activating the filter [14]. As image and scene classifiers were being probed, the reliance on human intervention was not scalable. ResNet152 trained for the Places365 benchmark contains 2048 convolutional filters in just one of its many layers. This technique, NetworkDissection is described in more detail in §4.1. I will provide a brief overview in the rest of this section.
The NetworkDissection technique uses a dataset of ground truth labels for scene, object, part, color, material, and texture categories. The dataset is a compilation of images of scenes, with segmentations providing labels for each category at the pixel level. The output is an analysis of the number of units in a convolutional layer whose outputs correlate with a disentangled feature labelled in the dataset. It also provides a label for convolutional filters that likely correspond to a human understandable concept. The technique will only identify single filters that activate for a disentangled concept labelled in the ground truth dataset.
The larger network architectures probed by NetworkDissection were more inter-pretable. The paper measures interpretability as the number of unique detectors. This may bias the results towards larger networks as the number of unique detectors would be expected to grow as the total number of convolutional units grows. By this metric, a hypothetical network with 1000 units of which 80 are unique detectors of human concepts, would be more interpretable than a network with 100 units of which 79 are unique detectors of human concepts. A second potential shortcoming of measuring interpretability in the NetworkDissection paper is that it does not pick up if multiple convolutional filters collectively identify a disengtangled representation. Moreover, if a unit is looking at a subset of the concept as labelled in the ground truth dataset, it will score low as a measure of identifying that concept.
3.4
Facial Recognition Interpretability
Two recent papers aim to create interpretable facial recognition networks. Yin et al. developed a network to learn facial representations from part-based face repre-sentations [15]. Kim and Ro developed a network that utilizes the relations of facial dynamics to determine facial characteristics [16].
The goal in the Yin paper is to create a facial recognition network that is ro-bust to occlusions and where filters in the network learn face parts. During training, a feature activation diversity loss function is used to encourage filters to learn face parts. The authors analyze the interpretability of the network using heat maps. They look at the average peak locations of 320 filters over 1000 images and compare to a CNN base model. The filter responses in the new network generated locations with smaller deviations than the base model, thus the authors conclude that the filters can be concentrated on one specific aspect of the face. Further, after demonstrating this interpretability, the authors test the model against facial recognition benchmarks and claim that the performance against the benchmark is not affeced by the inter-pretability of the network. While this work is an encouraging step forward in training a neural network both for the classification task and interpretability, the evaluation of the interpretability of the network is not robust.
In the Kim paper, facial local regions are identified and labelled in an image. These regions are the left and right eyes, forehead, nose, left and right cheeks, nose, left and right mouth side, and the mouth. The goal of the work is not to provide interpretability or explainability for the result of the decisions of the network, but to use the relative regions of an image to improve age and gender classification. The paper does perform analysis on the important relative features in age and gender classifications.
Chapter 4
Methodology
The goal of this thesis is to ascertain the usefulness of the NetworkDissection method on a small image classification network with policy relevance. The original Net-workDissection experiments were performed on networks trained for object and scene classification. The complexity and breadth of accurate object and scene classification necessitates the use of extremely deep neural networks. The value-add of NetworkDis-section is the ability to automatically quantify the interpretability of a network for evaluaution and debugging purposes. The automation aspect becomes much more important when the number of nodes in a network is simply too large for it to be feasible to manually analyze the results of each convolutional unit's output.
There is value in establishing a quantifiable measure for interpretability that can be effective across a variety of types of networks. To that end, this thesis probes the limits of NetworkDissection in a classification problem with a small number of output classes. I measure the usefulness of the method in two parts. First, that measuring interpretability by the number of disentangled concepts that emerge in the network is appropriate in a small network. This would be satisfied by seeing disentangled representations that align with human concepts emerge in the network. If the first condition is true, a second condition can then be tested. The second condition is determining the techniques reliability by answering the question, "are the assigned labels consistent when probed with different datasets?" That is addressing the factor of how important the set of ground truth labels is in determining the interpretability
of the network.
4.1
Review of the NetworkDissection Technique
The NetworkDissection technique [14] is a method created by Zhou and Bau, et. al to quantify the interpretability of convolutional neural networks. The user supplies a network to probe, the layer or layers to probe, and a dataset of ground truth labels as inputs. The dataset of ground truth labels is used as the source of images to use to perform a forward pass through the network, as well as the source of ground truth labels. For each image in the dataset, multiple segmentations are created for different categories of human interpretable features.
In the Broden Dataset, the default dataset to use with NetworkDissection, seg-mentations are created for scene, object, part, material, texture, and color categories. In some cases, the segmentations are the entire image. This indicates the label ap-plies to the entire image. NetworkDissection identifies units associated with human understandable concepts by identifying those units that solve any understandable segementation problems well, without further training. To use a unit to segment the image, NetworkDissection upsamples the raw output of the unit to the source image dimensions and applies a fixed threshold. These segmentations are evaluated using Intersection Over Union (IOU) calculations to determine the agreement with the seg-mentations provided in the source dataset. An IOU value over a specified threshold (default is 0.04), indicates the unit has learned a human interpretable concept. In-tersection Over Union is a technique to measure the accuracy of image segmentation by calculating the intersecting area of two segmentations divided by the total area of the segmentations.
The output of NetworkDissection is a csv file with each unit and its corresponding score given in a row. For each unit, the label and category with the highest score is provided as well as the final "score" of the unit. In addition, for each category in the dataset of ground truth labels, the following values are provided: label with the highest IOU value, truth, activation, intersection, and IOU value.
NetworkDissection uses the IOU metric to assign a label to each unit. The IOU is calculated for every label and unit for every image. The IOU score can be used as a confidence metric. The higher the IOU score, the more likely the unit activates on the labelled concept. The label Broden applies is the label with the highest IOU score. While the highest IOU scores, and associated labels, for all of the categories are provided in the csv output, labels within a category with a similar though slightly lower IOU will not be provided in the output.
4.2
Review of Datasets Used in Experiments
I probed two pre-trained open-source classifiers for disentangled facial features: an age classifier and a gender classifier. The networks interrogated are described in §4.2.4. Since the goal is to understand if facial features emerge as disentangled represen-tations in facial characterization networks I chose to use pre-trained models, rather than engineering such models and features. Thus, it would be possible to determine if disentangled representations emerged naturally, without any special consideration for interpretability during training. The ground-truth dataset I use to test for disen-tangled facial features was hand labelled. I labelled facial attributes, skin tones, and textures. The compilation of this dataset, FaceTexture, is described in §4.2.1
I also probed each classifier with two other sources of ground truth labels to assess the reliability of the labels applied during NetworkDissection. In addition to FaceTexture and Broden, I created a superset of the two, BrodenFace. The latter two datasets are described in §4.2.2 and §4.2.3
4.2.1
FaceTexture Dataset: Labelled Facial Features, Labelled
Skin Tones, Labelled Textures
The FaceTexture dataset is derived from test images and ground truth labels for probing facial characterization networks.
Labelled Facial Features Dataset
Purpose: To provide ground truth labels for eye, eyebrow, mouth, nose, and jaw facial features to test for the emergence of these concepts in the convolutional filters of an age and gender classifier.
I used the publicly available labelled faces in the wild (lfw) dataset to generate an annotated facial feature dataset [17]. The lfw dataset is a compilation of 13,233 jpeg images of 1680 individuals collected from the web.
The regions annotated were face, eye(s), eyebrow(s), nose, mouth, and jaw. The annotations were stored in a .png file with each pixel labelled according to the fa-cial region. The labelled regions form a multilabel segmentation, where some pixels are both in the "face" region as well as in a specifical facial reigon. Two separate segmentation files were created (as .png files) for each image in the lfw dataset: one annotating the face pixels, the other annotating the rest of the facial feature pixels.
dlib and OpenCV modules were used to identify the facial regions and label pixels associated with each region. For each image in the lfw dataset, I used the dlib library's bounding box feature to identify the part of the image with the face. The pixels in the new image that correspond to the pixes in the bounding box on the original image are given an BGR value of (0,0,1). The new image is then saved in BGR format.
To identify the facial regions in the photos, I used dlib's 68-coordinate facial landmark detector. The facial landmark detector returns 68 points that correspond to the different facial regions. Images where a face could not be identified by dlib's frontal face detector were not included in the dataset.
The labels for the lfw dataset were stored in two generated files. The first, denoted with the suffix appended to the original filename '_face'contained indicated the pixels in the image corresponding to the individual's face. The second, denoted similarly with the suffix '_facepart'contained the pixels labelled for the distinct facial features. In the second step of the process I used the dlib facial landmark detector to identify the areas of the face corresponding to the eyes, eyebrows, nose, mouth, and jaw in the
image, for labelling. I used the opencv module to to set BGR values on the enclosed pixels in the respective regions. The BGR values used to label the facial regions are indicated in Table 4.1.
Facial Region BGR Value mouth (0,0,1) eyebrow (0,0,2) eye (0,0,3) nose (0,0,4) jaw (0,0,5)
Table 4.1: BGR Values Corresponding to Facial Features
Figure 4-1 shows the pixels labelled for face and facial features, respectively. For diagramming purposes, regions in the photograph below highlight the regions in red rather than the BGR values actually used.
(a) Original Image from LFW
(b) Annotated Face
(c) Annotated FacePart Features
Figure 4-1: Labelled Facial Features for Barbra Streisand Image from LFW Labelled SkinTone Dataest
Purpose: To provide ground truth labels for groups of skin tones to test for the emer-gence of these concepts in the convolutional filters of an age and gender classifier.
I used the "Skin Segmentation Dataset" from the University of California Irvine Machine Learning Repository for examples of BGR values corresponding to human skin. The dataset contained BGR values for both skin samples and non-skin samples. I filtered out the non-skin samples and used the 50,859 skin tone samples. In order to group the skin BGR values from the Skin Segmentation Dataset, I used an RGB reference of skin tone shades. The values in Figure 4-2 served as reference points of
skin tones in three-dimensional space.
Figure 4-2: Representative SkinTone Shades
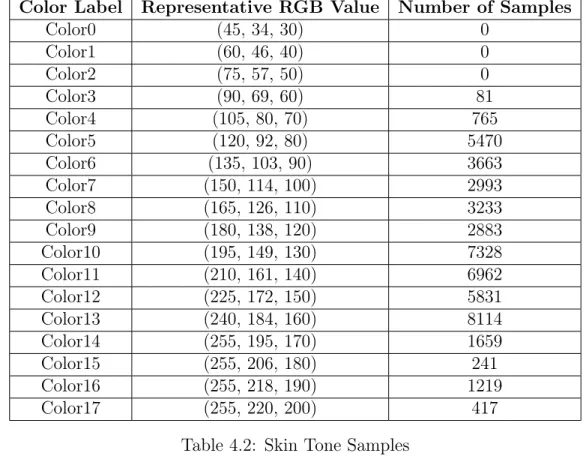
Color labels were supplied from color0 to color19 moving from the top to the bottom of the above figure. For each BGR value in the Skin Segmentation Dataset, its Euclidean distance to each representative point was measured. The sample was placed into the group it was closest to by Euclidean distance. The number of samples placed into each grouping is described in Table 4.2.
I then converted each labelled sample into an image. For each grouped sample, I used OpenCV to create a 227x227 image with each pixel's RGB value that of the dataset. The designated grouping of the sample was denoted in the filname for the generated image. The nomenclature used for the skin tone groupings were 'color0' to 'color19'. Each sample was named according to its grouping and sample number (i.e. 'color0_0.jpg'). The number of samples is skewed towards lighter shades. For all groups that have more than 0 members, the number of samples is large enough that NetworkDissection should label the concept if it emerges in the network. However, as can be seen in Figure 4-3 there is a finer gradient in the lighter skin shades. Therefore, there is a chance that if the network is learning finer gradients of darker shades, not all will emerge as disentangled concepts or may be mislabelled.
Color Label Representative RGB Value Number of Samples Color0 (45, 34, 30) 0 Color1 (60, 46, 40) 0 Color2 (75, 57, 50) 0 Color3 (90, 69, 60) 81 Color4 (105, 80, 70) 765 Color5 (120, 92, 80) 5470 Color6 (135, 103, 90) 3663 Color7 (150, 114, 100) 2993 Color8 (165, 126, 110) 3233 Color9 (180, 138, 120) 2883 Color10 (195, 149, 130) 7328 Color11 (210, 161, 140) 6962 Color12 (225, 172, 150) 5831 Color13 (240, 184, 160) 8114 Color14 (255, 195, 170) 1659 Color15 (255, 206, 180) 241 Color16 (255, 218, 190) 1219 Color17 (255, 220, 200) 417
Table 4.2: Skin Tone Samples
(a) color 3 (b) color 4 (c) color 5 (d) color 6 (e) color 7
(f) color 8 (g) color 9 (h) color 10 (i) color 11 (j) color 12
(k) color 13 (l) color 14 (m) color 15 (n) color 16 (o) color 17
Describable Textures Dataset
Purpose: To provide ground truth labels for textures to test for the emergence of these concepts in the convolutional filters of an age and gender classifier.
The final dataset used to construct the FaceTextures dataset was the Describle Tex-tures Dataset [18]. This dataset contains 5640 images of texTex-tures. The dataset covers 47 categories and provides 120 images for each category. Example images from five of the categories are shown in Figure 4-4.
(a) Banded (b) Bumpy (c) Knitted (d) Sprinkled (e) Wrinkled
Figure 4-4: Example Samples from the Describable Textures Dataset
Generating Segmentations from Labelled LFW, Labelled Skin Tones, and DTD
The final step in creating the FaceTexture dataset is to combine the three annotated datasets described above into a single dataset of segmentations to use in NetworkDis-section. The joinseg utility in NetworkDissection combines instances of AbstractSeg-mentation classes into a single densely labelled dataset where each pixel in an image is labelled. To incorporate the labelled lfw and labelled skin tone datasets with dtd, I subclassed the AbstractSegmentation class in NetworkDissection to handle the la-belled lfw and lala-belled skin tone datasets.
number of labels is the number of unique concepts associated with the given category. The number of samples is the total number of examples in the given category.
Category Number of Labels Number of Samples
face_part 6 79050
skin_tones 15 50859
color 11 44745
texture 47 6611
Table 4.3: FaceTexture Dataset Statistics
4.2.2
Broden Dataset
Purpose: To test the reliability of the labels applied during NetworkDissection
The Broden Dataset is a broad and densely labelled dataset of human understand concepts covering six categories: part, object, color, material, texture, and scene. It is a combination of four datasets of images and labels. The color labels are applied on each pixel and are selected from a set of eleven colornames. The statistics for the Broden dataset are shown in Table 4.4.
Category Number of Labels Number of Samples
color 11 651776 texture 47 6611 part 234 132414 object 584 271047 material 32 54511 scene 468 17746
Table 4.4: Broden Dataset Statistics
4.2.3
BrodenFace Dataset
The BrodenFace Dataset is a superset of the FaceTexture and Broden Datasets. The statistics for the BrodenFace dataset are shown in Table 4.5
Category Number of Labels Number of Samples
face_part 6 79050 skin_tones 15 50859 color 11 655660 texture 47 6611 part 234 132414 object 584 271047 material 32 54511 scene 468 17746
Table 4.5: BrodenFace Dataset Statistics
4.2.4
Models Interrogated
Two open-source pre-trained facial characterization networks were probed. Both were created and trained by Gil Levi, et. al [19]. Both of the networks were trained on the same dataset and used the same network architecture. One was trained for classifying gender and the other trained for classifying age. The output of the gender classifer is a softmax probability distribution over two output classes. The output of the age classifier is a softmax probability distribution over eight output classes. The network consists of three convolutional layers and two fully connected layers.
The gender classifier network, gender_net, achieved 86.8% accuracy on the Adi-ence benchmark. The age classifier, age_net, achieved 50.7% exact accuracy and 84.7% 1-off accuracy. Each of these represented an improvement over previous age and gender classifiers.
The model prototxt files and weights were provided open-source in the caffe model zoo.
4.3
Experiments Conducted
4.3.1
Experiment 1: Probe age and gender classifiers using
NetworkDissection with FaceTexture source of ground
truth labels
Purpose: To determine if disengtangled features emerge in facial characterization net-works
In the first experiment, I probed the age classification network - age_net, and the gender classification network - gender_net using NetworkDissection with the Face-Texture dataset as the source of probing images and ground truth labels. The first objective of the experiment was to determine if disentangled facial features emerge in the hidden layers of the network. All three of the convolutional layers in each network were probed. The results will indicate if testing for interpretability using NetworkDis-section may be a useful technique on networks that do not have thousands of units in each layer.
The second objective of the experiment was to compare the results of the two classifiers. While the two networks were trained using the same dataset on the same network architecture, the networks were trained for different tasks. Potentially this could lead to one network or the other learning more human interpretable concepts, perhaps if they are necessary to discriminate between the different output classes. The age classifier has a binary output distribution and the gender classifier has a distribution over eight output classes.
The results I will aim to examine are as follows
1. Number of convolutional filters that learn a human interpretable concept in each layer
2. The categories on concepts that emerge and with what frequency they emerge 3. Whether or not specific face feature and skin tone labels are learned by
indi-vidual filters
4. How the above values differ betwen the age and gender classifers
5. Qualitatively examine "mislabelled" units, where the label applied by Net-workDissection is not validated by human analysis of the visualized results
4.3.2
Experiment 2: Probe age and gender classification
net-works with Broden and BrodenFace as source of ground
truth labels
Purpose: To determine if NetworkDissection reliably applies labels when the ground truth dataset changes
In the second experiment I probed age_net and gender_net using NetworkDissec-tion with the Broden and BrodenFace datasets as the source of probe images and ground truth labels. As described in §4.2.2 and §4.2.3, the BrodenFace dataset is a superset of the Broden and FaceTexture datasets. The objective of repeating the NetworkDissection experiments with the Broden and BrodenFace datasets is to pro-vide a means to compare the results of each probe with the different ground truth labels. With this evidence, I can test the reliability of the NetworkDissection labels The units labelled with facial features and skin tones, if any, identified with the Face-Texture dataset should not be labelled with the Broden dataset. However, it would be expected for these units to be labelled both in the FaceTexture and the BrodenFace experiments. The results I will aim to examine between the Broden/BrodenFace and FaceTexture/BrodenFace experiments are as follows
1. The number of units labelled the same 2. The number of units labelled differently
3. The number of units and categories of those units labelled in BrodenFace but not Broden/FaceTexture
4.3.3
Policy Significance
The experiments conducted in this work, described in §4.3.1 and §4.3.2 serve to both advance the policy goals of increased transparency in facial characterization networks and test the usefulness of the NetworkDissection method in a different model architec-ture and problem space. A rigorous approach to establishing effective interpretability techniques for machine learning relies on testing novel techniques on policy relevant problems. Demonstrating proposed techniques are successful in addressing policy needs will help advance the technical landscape and inform key policy debates.
The first experiment evaluates an interpretability technique on a policy-relevant application - age and gender classification. Gender classifiers and facial recognition algorithms have come under public scrutiny due to bias [20]. In gender classification, 99% of white men are correctly classified whereas 35% of black women are incorrectly labelled [1]. In facial recognition, algorithms are less accurate on people of color [21]. I examine the age and gender classifiers to determine if skin tones emerge as a disentangled representation in the networks. Identifying skin tones as features that emerge in deep neural networks is a step towards understanding the importance of skin tone in classification decisions. This could lead to understanding and remediating racial bias in these classification decisions.
The emergence of both facial features and skin tones as disentangled represen-tations would also help validate the generalizability of the NetworkDissection inter-pretability metric. The metric relies on individual convolutional units learning a hu-man understandable concept. In the object and scene classification networks probed in the NetworkDissection paper, individual convolutional filters learn singular human concepts such as "plane" and "dog" [14]. While interesting and groundbreaking tech-nical research, the emergence of such concepts in image classifiers is not of particular interest to the policy discussion. Demonstrating the technique can effectively identify the emergence of policy sensitive features in other networks, however, should be of considerable interest. Likewise, the failure to detect the emergence of policy sensitive features, either because they are not learned by the network or because they are not
discoverable with NetworkDissection would be a contribution to the policy landscape by establishing the boundary of the usefulness of the technique.
The second experiment tests the reliability of NetworkDissection. If an inter-pretability technique does not behave reliably, the validity of the technique can be called into question. As policy makers analyze the technical capabilities of various interpertability techniques, they must consider not only the applicability of the tech-nique to the problem space, but also its correctness and robustness. The second experiment aims determine the robustness of the NetworkDissection technique to variations in a critical factor of the experimental setup: the source of ground truth labels.
Chapter 5
Results
This results chapter will focus on presenting the results of the two experiments con-ducted to ascertain the usefulness of NetworkDissection on a policy-relevant image classification problem and assess the reliability of the labels applies by the method. Following presenting the results of each experiments, I will analyze the results and the policy implications of the results as a whole. The methodology is reviewed in the immediately preceding chapter.
5.1
Probing for Disentangled Skin Tones and Facial
Features in Age and Gender Classification
Net-works
Takeaways: Skin tones emerge as disentangled representations. Disentangled facial features emerge in both the age and gender classifier in the third convolutional layer. Disentangled representations for color and texture emerge in all three layers of both networks.
As a key element of this experiment was comparing the results at each layer of the age and gender classifiers, I will proceed with the analysis of each network in parallel. A unit is labelled as having learned a disentangled representation when the IOU
score is greater than 0.04. This threshold is used in the NetworkDissection paper and is the threshold I will use in my analysis.
Table 5.1 shows the number of labelled units and the number of total units for each layer of each network. While the numbers are rougly similar, fewer units are labelled across the three layers in the gender classifier.
Network Layer Num Labelled Units Num Units Age Net Conv1Conv2 7284 25696
Conv3 229 384
Gender Net Conv1Conv2 6868 25696
Conv3 199 384
Table 5.1: Number of Labelled Units in AgeNet and FaceNet
In the first layer of each network, representations of color and texture emerge. The labels and categories applied to each labelled unit for the age and gender classifier are displayed in tables 5.2 and 5.3. In the first layer of the gender classifier, a skin tone detector emerges. The bold text indicates the feature emerges in one network but not the other.
Category Labels texture striped (12) colors black (3) blue (17) green (6) orange (4) purple (5) red (11) white (7) yellow (2) skintones color17 (1)
Table 5.2: Disentangled Features in GenderNet Conv1 Category Labels texture striped (10) colors black (3) blue (22) green (3) pink (4) purple (8) red (13) white (6) yellow (3) Table 5.3: Disentangled Features in AgeNet Conv1
This aligns with what previous interpretablity work has demonstrated. Detectors for lower level concepts like textures and colors appear earlier in the network. The higher level concepts like facial features emerge in the second and third layers of the network. The labels applied to units in the second and third layers of the network are
displayed in Tables 5.4, 5.5, 5.6, and 5.7. Again, the bolded text highlights features that emerge in one network but not the other and the number in parenthesis indicates the number of units detecting that feature.
Category Labels
textures checkquered(2)striped(3)
colors black(1) blue(10) green(13) orange(4) pink(4) purple(10) red(6) white(3) yellow(8)
skin_tones color3(2)color16(3) face_part eye(1)
Table 5.4: Disentangled Features in Gender Net Conv2
Category Labels
textures banded(1)striped(2) lined(1) veined(1) colors blue(13) green(23) orange(1) pink(3) purple(6) red(10) white(2) yellow(7) skintones color3(2) color4(1) color14(1) color16 (5) color17(3) facepart eyebrow(1) Table 5.5: Disentangled Features in Age Net Conv2
Category Labels textures banded(1) flecked(1) gauzy(1) lined(1) striped(8) woven(1) zigzagged(1) colors black(5) blue(30) brown(2) green(18) grey(4) orange(18) pink(27) purple(4) red(15) white(13) yellow(26)
skintones color3(3)color8(1) color4(3)color14(5) color16(3) color17(2) facepart eyebrow(2) face(2)mouth(2) Table 5.6: Disentangled Features in Gender Net Conv3
Category Labels textures banded(2) flecked(1) lined(4) stratified(1) striped(10) colors black(10) blue(30) brown(6) green(42) grey(9) orange(16) pink(5) purple(15) red(16) white(6) yellow (22)
skin_tones color3(2)color14(6) color4(2)color15(1) color16(10) color17(4) face_part eyebrow(1) face(3)mouth(2) nose(2) Table 5.7: Disentangled Features in Age Net Conv3
Samples of the facial feature detectors can be seen in Figure 5-1. These samples were obtained from the age classification experiment output.
(a) Sample Mouth Activations
(b) Sample Nose Activations
(c) Sample Eyebrow Activations
(d) Sample Face Activations
Figure 5-1: Sample Activations of Units Labelled: Mouth, Nose, Eyebrow, Face in AgeNet
5.1.1
Analysis of Results
The strongest category that emerges in units of both the age and gender classifer is color. The category color accounts for 41.3% and 37.6% of units in the age and gender classifers, respectively. Of the labelled units, the color category accounts for 78.9% and 82.6% of the applied labels. The weakest category that emerges is facial features. Only 6 units in gender_net and 9 units in age_net are in the facial feature category. However, the above metric only includes facial features that I directly looked for. It is possible that more disentangled representations exist in units, but for parts of faces that I do not supply labels for. The following section, §5.1.2 will discuss these cases in more detail, and provide examplse of units that appear to be activating on human
interpretable concepts that I did not include in the FaceTexture dataset.
5.1.2
Mislabelled Units
A qualitative examination reveals some potential mislabelling of units. The Net-workDissection technique will only apply a label that has examples in the dataset of ground truth labels. A unit could be looking for a human interpretable concept, but if the label is not in the dataset of ground truth labels, the unit will either be mislabelled or will not be labelled at all.
Unit 7 in the age classifier is labelled, "Orange." A closer examination of the im-ages, some shown in Figure 5-2, seems to illustrate the network is looking at hairlines.
Figure 5-2: Sample of Top Activated Images for Unit 7: Orange
Although, the examples are not always so extreme. The unit labelled eyebrow in layer 2 of the age classification network, actually appears to be looking for the tops of heads. Visually, the activated regions of these images (samples shown in Figure 5-3) have similar shapes and textures as eyebrows. However, there is a human under-standable concept that fits more accurately.
5.2
Evaluating Reliability with Broden, BrodenFace,
and FaceTexture
For the results of this experiment, I expect to see BrodenFace result in the identifying the most disentangled features, followed by FaceTexture, and finally, Broden. The BrodenFace dataset contains a superset of the labels in FaceTexture and Broden. The BrodenFace probe should then label units that are also labelled by either the FaceTexture or Broden probe.
Given the similarities in the results of the FaceTexture probe of the age and gender classification networks, for this experiment I will only discuess the results of probing the age classification network with the Broden and BrodenFace datasets. Table 5.8 illustrates the number of labelled units in each layer of the age classifier when probed with each of the FaceTexture, Broden, and BrodenFace datasets.
Layer Total Units Dataset Labelled Units Layer 1 96 FaceTextureBroden 7244
BrodenFace 45 Layer2 256 FaceTextureBroden 8439 BrodenFace 53 Layer3 384 FaceTextureBroden 22955
BrodenFace 104 Table 5.8: Number of Labelled Units in AgetNet
There are two intriguing results - one interesting result immediately jumps out, and one subtlety deserves mentioning. As expected, the BrodenFace probe labels more units than the Broden dataset. However, it labels far fewer units than the FaceTexture dataset. Additionally, the labels of the units applied in the BrodenFace and Broden probes need further invstigation. In addition to seeing more units labelled than the Broden dataset, I want to determine if the BrodenFace labels applied are a strict superset of the labels applied in Broden. I also investigate if the additional labelled units are in the face_part or skin_tones categories, categories not included
in Broden.
5.2.1
Comparing Labelled Units in Broden and BrodenFace
Takeaway: For each layer of the network, there is strong consistency between the labels applied with the Broden dataset and the labels applied with the BrodenFace dataset.
To identify the overlap between the Broden and BrodenFace applied labels, and iden-tify if the BrodenFace labels are a strict superset of the Broden applied labels, I compare the quantities of the following metrics.
1. The number of units with the same label from Broden and BrodenFace 2. The number of units with different labels
3. The number of units, and category of units labelled with Broden but not Bro-denFace
4. The number of units labelled with BrodenFace but not Broden
Number of Units Labelled with Broden 44 Number of Units Labelled with BrodenFace 45 Number Matching Unit Labels 36
Label Mismatch 8
Labelled in Broden, unlabelled in BrodenFace 0 Labelled in BrodenFace, unlabelled in Broden 1
Table 5.9: Layer 1 Mismatch Stats between Broden and BrodenFace
Table 5.9 shows that a large majority (81.8%) of the units labelled with Broden are given the same label with BrodenFace. Although almost 20% do not have the same label in Broden and BrodenFace. Tables 5.10 and 5.11 show the results for layers two and three.
Layers two and three show less consistency in unit labelling than layer one. 69.2% and 63.6% of units labelled with Broden are labelled the same with BrodenFace. A
Number of Units Labelled with Broden 39 Number of Units Labelled with BrodenFace 53 Number Matching Unit Labels 27
Label Mismatch 8
Labelled in Broden, unlabelled in BrodenFace 3 Labelled in BrodenFace, unlabelled in Broden 17
Table 5.10: Layer 2 Labelled Unit Quantities between Broden and BrodenFace
Number of Units Labelled with Broden 55 Number of Units Labelled with BrodenFace 104 Number Matching Unit Labels 35
Label Mismatch 18
Labelled in Broden, unlabelled in BrodenFace 2 Labelled in BrodenFace, unlabelled in Broden 51
Table 5.11: Layer 3 Labelled Unit Quantities between Broden and BrodenFace
possible reason could explain why this number falls below 100% - a unit labelled with BrodenFace are in categories not present in Broden. In that case, NetworkDissection applied a more accurate label for the unit given a new ground truth label. Moreover, the method could still be reliable even if the number is not 100%. Broden provides a unit label based on the highest IOU. It is possible from the results to see the label from a different category that was the second choice.
I present the reults of analyzing the two reasons mentioned above in Table 5.12. A "second choice match" is a unit for which the second choice label with either Broden or BrodenFace matches the first choice label with the other. The options are not mutually exclusive, the second choice label with BrodenFace, for example, might match the first choice label with Broden and have its first choice label be a new category. In that circumstance, I only count the unit in the group with "new category applied".
Layer % units with "second choice
matches" % with new category labelapplied
Layer1 87.5% 12.5%
Layer 2 44.44% 55.6%
Layer 3 44.4% 50%
Table 5.12: Percentages of mismatched units in each layer with either "second choice matches" or a new category label is applied.
5.2.2
Why FaceNet Labels More Units than BrodenFace
Takeaway: The number of samples of ground truth labels for colors seems to affect the preference for NetworkDissection to label a unit with the color category.
This section will focus on performing a brief evaluation of the units labelled with FaceTexture but not labelled with BrodenFace. I analyze the labels applied to the units that are labelled with FaceTexture but not BrodenFace. For each layer, these types of units disproportionately fall in the color category. For layer 1, 62.9% of units with labels applied with FaceTexture but not BrodenFace are given color labels. For layer 2, it is 89.7%. For layer 3 it is 89.5%.
The fact that FaceTexture contains only 44,745 color samples across the eleven colors compared with 651,779 samples in BrodenFace, may affect the preference for assigning units those labels. Further analysis needs to be done to validate that hypothesis.
5.2.3
Policy Implications
The policy motivations underlying the work in this thesis focused on aligning the technical research conducted on interpretability and explainability with the policy aims of increasing trust and accountability in machine learning systems. This thesis accomplishes that task by performing experiments that evaluate the applicability of a novel interpretability technique in a policy relevant application.
The results described in §5.1 illustrate the usefulness of the NetworkDissection technique in identifying skin tones and facial features learned in age and gender
clas-sification networks. The results described in §5.2.1 illustrate the robustness of the technique against changes to a key component of the experimental setup: the dictio-nary of examples of human understandable concepts expected to be learned by the network. Taken together, the results of the two experiments suggest NetworkDis-section may be a useful, relevant, and robust technique to address the fundamental question of where in a facial characterization network race is learned.
Understanding how a classifier uses a policy-senstive feature, like race, in making a prediction, is critical to being able to remove that feature from consideration in the network's decision. In facial recognition and gender classification, a removal of skin tone features may not be a desired policy aim, especially if network accuracy across all demographics declines. The policy aims may be dedicated instead at identifying whether the presence or absence of a representation of different skin tones correlates with better or worse accuracy for a demographic. Such insights would address the public calls for increased transparency in the output of facial characterization net-works. Future work would be required to establish if a correlation exists. As this work illustrates skin tones can be identified as learned concepts in facial character-ization networks, investigating correlations between the emergence of these features and network bias is technically feasible.
In high trust environments where existing laws prohibit discrimination on the ba-sis of protected attributes such as race or gender, the identification of such attributes being used in machine learning models should be of particular interest to regulators. The NetworkDissection technique identifies units in models that have learned a fea-ture that was not supplied during training. For example, in the facial characterization network, the nose label was never supplied to the network during training, yet the network learned the concept of a nose. Suppose instead of an image classification network, an employment model is probed. The emergence of a human understand-able concept such as gender would raise questions about the significance the network places on the protected attribute and whether or not the use of such an algorithm vi-olates exsting regulations. NetworkDissection has not been used to evaluate machine learning models not used for image classification.
The work in this thesis demonstrates the power of the method in identifying policy relevant attributes. A natural extension that should excite the policy community is performing similar experiments on non-image classification tasks to test for the emergence of learned protected attributes.
Chapter 6
Future Work
The future research directions to continue from this thesis are the improvement of the FaceTexture dataset and the application of the NetworkDissection technique to new machine learning models.
Improvements to FaceTexture Dataset
The segmentation labels used in the FaceTexture dataset, while successful in identi-fying disentangled represetnations in the networks probed, could be more granular. For example, the face segmentation label is applied to a bounding box around the face in the image. Identifying just the face by the curve of the jawline and top of the head would improve the accuracy of the label. Secondly, rather than using flat color swatches as examples of skin tones, labelling the pixels in the face images in the FaceTexture dataset with the skin tone would provide more context to the skin tone label.
NetworkDissection Generalizability
Having demonstrated the effectiveness of the NetworkDissection method on a smaller image classifcation problem and object and scene classification, the next step towards validating the generalizability of the technique is testing it on a non-image classifica-tion network. A test on a completely different type of problem would help determine if the technique generalizes to the non-vision space, or if its effectiveness is limited to
Chapter 7
Contributions
The work in this thesis adds the following contributions
1. Show NetworkDissection can be a useful technique on smaller image classifica-tion networks
2. Created a new dataset specifically for testing for disentangled facial features 3. Show policy relevant disentangled features, skin tones, emerge in age and gender
classifiers
4. Show disentangled concepts can emerge in facial characterization networks 5. Show NetworkDissection can be effectively applied to a policy-relevant
Bibliography
[1] Joy Buolamwini and Timnit Gebru. “Gender Shades: Intersectional Accuracy Disparities in Commercial Gender Classification”. en. In: (), p. 15.
[2] Finale Doshi-Velez and Mason Kortz. Perspective | AI is more powerful than ever. How do we hold it accountable? en.
url: https://www.washingtonpost.com/outlook/ai-is-more-powerful- than-ever-how-do-we-hold-it-accountable/2018/03/20/e867b98a-2705-11e8-bc72-077aa4dab9ef_story.html (visited on 08/14/2018). [3] Sentient. Understanding the black box of artificial intelligence. en-US.
Jan. 2018. url: https://www.sentient.ai/blog/understanding-black-box-artificial-intelligence/ (visited on 08/14/2018).
[4] Kartik Hosanagar and Vivian Jair.
We Need Transparency in Algorithms, But Too Much Can Backfire. July 2018. url: https://hbr.org/2018/07/we-need-transparency-in-algorithms-but-too-much-can-backfire(visited on 08/14/2018).
[5] Joshua New and Daniel Castro.
“How Policymakers Can Foster Algorithmic Accountability”. en. In: (), p. 40. [6] Marco Túlio Ribeiro, Sameer Singh, and Carlos Guestrin.
“"Why Should I Trust You?": Explaining the Predictions of Any Classifier”. In: CoRR abs/1602.04938 (2016). arXiv: 1602.04938.
url: http://arxiv.org/abs/1602.04938. [7] F. Doshi-Velez and B. Kim.
“Towards A Rigorous Science of Interpretable Machine Learning”. In: ArXiv e-prints (Feb. 2017). arXiv: 1702.08608 [stat.ML].
[8] Leilani H. Gilpin et al. “Explaining Explanations: An Approach to Evaluating Interpretability of Machine Learning”.
In: arXiv:1806.00069 [cs, stat] (May 2018). arXiv: 1806.00069.
url: https://arxiv.org/pdf/1806.00069.pdf (visited on 07/02/2018). [9] Lisa Anne Hendricks et al. “Generating Visual Explanations”.
In: CoRR abs/1603.08507 (2016). arXiv: 1603.08507. url: http://arxiv.org/abs/1603.08507.
[10] Dong Huk Park et al.
“Multimodal Explanations: Justifying Decisions and Pointing to the Evidence”. In: arXiv:1802.08129 [cs] (Feb. 2018). arXiv: 1802.08129.
url: http://arxiv.org/abs/1802.08129 (visited on 07/02/2018). [11] Matthew D. Zeiler and Rob Fergus.
“Visualizing and Understanding Convolutional Networks”. In: CoRR abs/1311.2901 (2013). arXiv: 1311.2901. url: http://arxiv.org/abs/1311.2901.
[12] Karen Simonyan, Andrea Vedaldi, and Andrew Zisserman.
“Deep Inside Convolutional Networks: Visualising Image Classification Models and Saliency Maps”. In: CoRR abs/1312.6034 (2013). arXiv: 1312.6034. url: http://arxiv.org/abs/1312.6034.
[13] Bolei Zhou et al. “Object Detectors Emerge in Deep Scene CNNs”. In: CoRR abs/1412.6856 (2014). arXiv: 1412.6856.
url: http://arxiv.org/abs/1412.6856.
[14] David Bau et al. “Network Dissection: Quantifying Interpretability of Deep Visual Representations”. In: Computer Vision and Pattern Recognition. 2017. [15] Bangjie Yin et al. “Towards Interpretable Face Recognition”.
In: arXiv:1805.00611 [cs] (May 2018). arXiv: 1805.00611.
url: http://arxiv.org/abs/1805.00611 (visited on 07/25/2018). [16] Seong Tae Kim and Yong Man Ro.
“Interpretable Facial Relational Network Using Relational Importance”. In: CoRR abs/1711.10688 (2017). arXiv: 1711.10688.
url: http://arxiv.org/abs/1711.10688.
[17] Gary B. Huang et al. Labeled Faces in the Wild: A Database for Studying Face Recognition in Unconstrained Environments. Tech. rep. 07-49.
University of Massachusetts, Amherst, 2007.
[18] M. Cimpoi et al. “Describing Textures in the Wild”. In: Proceedings of the IEEE Conf. on Computer Vision and Pattern Recognition (CVPR). 2014. [19] G. Levi and T. Hassncer.
“Age and gender classification using convolutional neural networks”. In: 2015 IEEE Conference on Computer Vision and Pattern Recognition Workshops (CVPRW). 2015, pp. 34–42. doi: 10.1109/CVPRW.2015.7301352. [20] Steve Lohr. “Facial Recognition Is Accurate, if You are a White Guy”. en-US.
In: The New York Times (June 2018). issn: 0362-4331. url:
https://www.nytimes.com/2018/02/09/technology/facial-recognition-race-artificial-intelligence.html (visited on 08/20/2018).
[21] Clare Garvie, Alvaro Bedoya, and Jonathan Frankle. The Perpetual Line-Up. en. Tech. rep.
Center on Privacy & Technology at Georgetown Law, Oct. 2016. url: https://www.perpetuallineup.org/ (visited on 08/20/2018).
![Figure 3-1: Example Explanation for Classifying Western Grebe from [9]](https://thumb-eu.123doks.com/thumbv2/123doknet/14103404.465866/19.918.130.775.848.912/figure-example-explanation-classifying-western-grebe.webp)
![Figure 3-3: Example Justification from [10]](https://thumb-eu.123doks.com/thumbv2/123doknet/14103404.465866/20.918.232.687.498.787/figure-example-justification-from.webp)
![Figure 3-5: Saliency Map Generated from Back-Propagation Pass [12]](https://thumb-eu.123doks.com/thumbv2/123doknet/14103404.465866/22.918.306.613.343.647/figure-saliency-map-generated-propagation-pass.webp)