HAL Id: hal-03157880
https://hal.archives-ouvertes.fr/hal-03157880
Submitted on 16 Apr 2021
HAL is a multi-disciplinary open access
archive for the deposit and dissemination of
sci-entific research documents, whether they are
pub-lished or not. The documents may come from
teaching and research institutions in France or
abroad, or from public or private research centers.
L’archive ouverte pluridisciplinaire HAL, est
destinée au dépôt et à la diffusion de documents
scientifiques de niveau recherche, publiés ou non,
émanant des établissements d’enseignement et de
recherche français ou étrangers, des laboratoires
publics ou privés.
between functional asymmetries in vision
Jérôme Tagu, Karine Doré-Mazars, Dorine Vergilino-Perez
To cite this version:
Jérôme Tagu, Karine Doré-Mazars, Dorine Vergilino-Perez. Saccade accuracy as an indicator of the
competition between functional asymmetries in vision. Experimental Brain Research, Springer Verlag,
2020, 238 (2), pp.411-425. �10.1007/s00221-019-05717-6�. �hal-03157880�
Saccade accuracy as an indicator of the competition between functional asymmetries in
vision
Jérôme Tagu1,2,*, Karine Doré-Mazars1, & Dorine Vergilino-Perez1,3
1 Université de Paris, VAC, F-92100 Boulogne-Billancourt, France
2 Icelandic Vision Laboratory, Faculty of Psychology, School of Health Sciences, University of Iceland, Reykjavik, Iceland
3 Institut Universitaire de France, Paris, France
* Correspondence should be addressed to:
Jérôme Tagu, [email protected] (phone: +33 1 76 53 29 44)
Laboratoire Vision Action Cognition, Institut de Psychologie, Université Paris Descartes 71 avenue Edouard Vaillant, 92100 Boulogne-Billancourt, France
ORCID IDs:
- Jérôme Tagu: 0000-0003-2331-7433
Acknowledgements. The authors warmly thank Dr. Agnes Charvillat for her language help. They also gratefully acknowledge the two anonymous reviewers for their insightful comments and suggestions.
Abstract
Hemispheric specialization refers to the fact that cerebral hemispheres are not equivalent and that cognitive processes are lateralized in the brain. Although the potential links between handedness and the left hemisphere specialization for language have been widely studied, little attention has been paid to other motor preferences, such as eye dominance, that also are lateralized in the brain. For example, saccadic accuracy is higher in the hemifield contralateral to the dominant eye compared to the ipsilateral hemifield. Saccade accuracy is however also known to be sensitive to other functional asymmetries, such as the lateralization of visuo-spatial attention in the right hemisphere of the brain. Using a global effect paradigm in three different saccade latency ranges, we here propose to use saccade accuracy as an indicator of visual functional asymmetries. We show that for the shortest latencies, saccade accuracy is higher in the left than in the right visual hemifield, which could be due to the lateralization of visuo-spatial attention in the right hemisphere. For the longest latencies however, saccade accuracy is higher toward the right than the left hemifield, probably due to the lateralization of local and global processing in the left and right hemispheres, respectively. These results could have a major impact on studies designed to measure the degree of lateralization of individuals. We here discuss both the theoretical and clinical contributions of these results.
Keywords: Saccadic eye movements, Saccadic accuracy, Global effect, Distractor, Hemispheric specialization, Asymmetries
1. Introduction
Functional asymmetries are an important topic for cognitive sciences as they have strong influences on visual and spatial processing (Corballis, Funnell, & Gazzaniga, 1999; Nebes, 1973). For example, a stroke in the right hemisphere of the brain can induce a deficit in the orientation of visuo-spatial attention toward the left hemispace, called hemineglect (for reviews, see Vallar, 1993, 1998). Because hemineglect patients are unable to orient their attention to the left hemispace, their drawings often only represent the right half of objects, and they show rightward errors in line bisection tasks (e.g., Kandel, Schwartz, & Jessell, 2000; Kerkhoff, 2001). The line bisection task consists in estimating the middle of a line. The estimation error relative to the objective midpoint can then be calculated, as well as the side of the error. Although hemineglect patients show rightward bisection errors (i.e., they estimate the midpoint at the right of the actual center of the line), healthy individuals show leftward errors in line bisection tasks. This phenomenon, called pseudoneglect (Bowers & Heilman, 1980), is assumed to result from the large involvement of the right hemisphere in the line bisection task due to the visuo-spatial nature of the task (for a review, see Jewell & McCourt, 2000). This would lead to the expansion of the left visual space, explaining the leftward bisection error. This leftward bias can be observed in many other visuo-spatial tasks and is often called “leftward attentional bias” (Mesulam, 1981, 1999; Nicholls & Roberts, 2002; Toba, Cavanagh, & Bartolomeo, 2011; Zago et al., 2017). Neuroimaging studies have corroborated these behavioral findings by showing higher activation in the right than in the left cerebral hemisphere during visuo-spatial tasks (e.g., Szczepanski & Kastner, 2013; Zago et al., 2017). One of the main neural correlates of the right lateralization of visuo-spatial attention seems to be the superior longitudinal fasciculus, which allows communication between the parietal and the frontal cortex (for review, see Corbetta & Shulman, 2002). Using diffusion tensor imaging, Thiebaut de Schotten et al. (2011) have indeed shown that the right lateralization of the middle superior longitudinal fasciculus varied between individuals, and that stronger lateralization in the right hemisphere led to larger leftward errors in line bisection tasks. The superior longitudinal fasciculus therefore seems to be directly related to the degree of lateralization of individuals’ attentional functions, and this correlation confirms that leftward errors observed in line bisection tasks are a good indicator of the degree of lateralization of individuals (see also Zago et al., 2017).
The leftward attentional bias is not restricted to the line bisection task and can also be observed in visual search tasks. In the study of Thomas & Nicholls (2018), participants had to perform a feature-based visual search task in which a target letter (“X” or “N”) was presented among five “O” on an imaginary circle at the center of the screen. Their task was to indicate whether the target was an “X” or an “N”. In some trials, an irrelevant distractor (a cartoon character) suddenly appeared outside the circle, in the left, right, upper or lower visual hemifield. The
results showed that manual response times were longer in trials including a distractor, irrespective of its position. Yet, in a second experiment based on a more complex conjunction-based visual search task (the target was presented among five other letters randomly selected from “K”, “V”, “W”, “Z”, “M” and “H”), the sudden appearance of a distractor shortened (rather than increased) manual response times, only when the distractor appeared in the left visual hemifield. Thomas & Nicholls (2018) therefore assumed that this left-right asymmetry in manual reaction times was driven by the leftward attentional bias and the right cerebral hemisphere specialization for visuo-spatial attention.
But visuo-spatial attention is not the only function that is lateralized in the brain. For example, when attention is focused on the local components of an object, the left hemisphere is more highly activated than the right one. Conversely, the right hemisphere is more highly activated than the left one for global processing (Brederoo, Nieuwenstein, Lorist, & Cornelissen, 2017; Fink et al., 1996; Martin, 1979; Van Kleeck, 1989). Typically, this can be observed in tasks involving hierarchical stimuli (e.g., a big “T” composed of several little “E”), for which local features are processed faster in the right visual hemifield (i.e., with the left cerebral hemisphere) and global features are processed faster in the left visual hemifield (i.e., with the right cerebral hemisphere).
Besides the functional asymmetries linked to the lateralization of visual processing and cognitive functions, humans show asymmetric motor preferences, such as handedness and eye dominance, that can also induce asymmetries between the left and the right visual hemifields (e.g., Chaumillon et al., 2017; Chaumillon, Blouin, & Guillaume, 2014; Tagu, Doré-Mazars, Lemoine-Lardennois, & Vergilino-Perez, 2016). Due to the special relationship between the sighting dominant eye and the ipsilateral primary visual cortex (Erdogan, Özdikici, Aydin, Aktas, & Dane, 2002; Seyal, Sato, White, & Porter, 1981; Shima et al., 2010), visual information is indeed processed faster (Chaumillon et al., 2014, 2017) and more accurately (Tagu et al., 2016) in the visual hemifield contralateral to the dominant eye than in the ipsilateral visual hemifield. Chaumillon et al. (2014) asked participants with a left or right sighting dominant eye to press a button with their left or right hand in response to a visual target appearing either into the left or the right hemifield (Poffenberger task). Their results showed that participants with a left dominant eye had shorter manual reaction times for targets presented in the right than in the left visual hemifield, whereas participants with a right dominant eye had shorter manual reaction times for target presented in the left than in the right visual hemifield. In other words, visual targets were detected faster when presented in the hemifield contralateral to the dominant eye than in the ipsilateral hemifield. The authors argued that the anatomo-functional relationship between the dominant eye and the ipsilateral V1 (Erdogan et al., 2002; Seyal et al., 1981; Shima et al., 2010) may allow faster processing of visual information in the contralateral visual hemifield
than in the ipsilateral one. Note however that in their study, Chaumillon et al. (2014) did not consider the strength of observers’ eye dominance. Indeed, by analyzing the peak velocity pattern of saccades made toward a lateralized target, it is possible to distinguish between individuals with weak and strong eye dominance. A naso-temporal asymmetry (Collewijn et al., 1988; see Jóhannesson, Tagu, & Kristjánsson, 2018 for review) in peak velocity (i.e., higher peak velocity for leftward than rightward saccades of the left eye and for rightward than leftward saccades of the right eye) indicates weak eye dominance, whereas higher peak velocity for a given saccade direction with both eyes (i.e., higher peak velocity for leftward than rightward saccades for both eyes, or higher peak velocity for rightward than leftward saccades for both eyes) indicates strong eye dominance (Tagu, Doré-Mazars, Vergne, Lemoine-Lardennois, & Vergilino-Perez, 2018a; Vergilino-Perez et al., 2012). Although the naso-temporal asymmetry is assumed to be driven by physiological asymmetries in the retinotectal pathway, recent behavioral evidence suggests other neurophysiological bases at the level of the geniculostriate pathway, and more particularly in V1 (Bompas, Sterling, Rafal, & Sumner, 2008; Tagu, Doré-Mazars, Vergne, Lemoine-Lardennois, & Vergilino-Perez, 2018b). Tagu et al. (2018a) have furthermore showed a consistent relationship between eye dominance strength and naso-temporal asymmetry manifestations, highlighting the validity of the quantification of eye dominance strength based on the naso-temporal asymmetry in saccadic peak velocity (Vergilino-Perez et al., 2012). In a recent study, Chaumillon et al. (2017) proposed the same Poffenberger task to participants differing in terms of eye dominance and eye dominance strength. Their results showed that the previously reported influence of eye dominance on manual reaction times (i.e., shorter manual reaction times for visual targets presented in the contralateral hemifield to the dominant eye, Chaumillon et al., 2014) only applied to individuals with strong eye dominance. Participants with weak eye dominance showed the standard Poffenberger effect (i.e., shorter manual reaction times when responding with the hand ipsilateral to the visual target). But besides manual reaction times, eye dominance and eye dominance strength also affect saccade accuracy (Tagu et al., 2016). In tasks in which participants have to make saccades toward a visual target appearing together with a proximal distractor, saccade amplitude is known to be modified and the saccade endpoint lands in between the saccade target and the distractor (Coren & Hoenig, 1972). This influence of a proximal distractor on saccade accuracy is called “global effect” (Findlay, 1982) and can be measured by comparing the accuracy of two types of saccades: those triggered toward the target-distractor configuration and those triggered toward isolated visual targets displayed at similar eccentricities. The global effect is assumed to result from competing interactions between neural populations coding for different locations (those of the target and of the distractor) at the level of the saccade map in the superior colliculus. The single peak of activity stemming from this competition in the saccade map falls between
the locations of the two stimuli (for reviews, see Van der Stigchel & Nijboer, 2011; Vitu, 2008). Note however that the weight attributed to each stimulus in the saccade map can be influenced by cortical processes via projections to the superior colliculus (Deubel, Findlay, Jacobs, & Brogan, 1988), which then “pull” the resulting peak of activity toward the stimulus associated with the highest weight. Functional asymmetries in the cortical areas involved in the saccade generation network, such as V1 and the parietal and frontal eye fields, could therefore affect the saccade map activity in the superior colliculus and the behavioral global effect on saccade accuracy. Tagu et al. (2016) have examined how the asymmetries linked to eye dominance found in V1 could modulate the resulting global effect on saccade accuracy. They have compared the global effect in the left and the right visual hemifields, distinguishing individuals with strong-left, strong-right, weak-left and weak-right eye dominance. In individuals with weak eye dominance (be it left or right), the effects of proximal distractors on saccade accuracy were stronger in the left than in the right visual hemifield. This difference in saccade accuracy between hemifields could be linked to the lateralization of visual attention in the right cerebral hemisphere. Indeed, the aforementioned leftward attentional bias may increase the perceptual weight of stimuli in the left visual hemifield and therefore increase the influence of the left distractor on saccade accuracy. This phenomenon could account for the higher global effect found for leftward than for rightward saccades in weak-eye-dominance individuals (see discussion in Tagu et al., 2016). In people with strong eye dominance, Tagu et al. (2016) found more accurate saccades in the hemifield contralateral to the dominant eye than in the ipsilateral hemifield. In other words, individuals with strong right eye dominance showed higher saccade accuracy in the left than in the right visual hemifield, whereas individuals with strong left eye dominance showed the reverse. Note that higher saccade accuracy means weaker global effect. Moreover, the difference in saccade accuracy between hemifields was smaller for participants with strong right eye dominance than for participants with strong left eye dominance. The difference in effect magnitude between these groups has been assumed to reflect the competition between several functional asymmetries in vision, namely between the effects of eye dominance and the effects of the leftward attentional bias. Specifically, in the left visual hemifield individuals with strong right eye dominance may have shown higher saccade accuracy due to the effects of eye dominance, that could be attenuated by the effects of the leftward attentional bias; explaining the weaker difference in saccade accuracy between hemifields. In participants with strong left eye dominance however, eye dominance effects may have increased saccade accuracy in the right visual hemifield, and for its part, saccade accuracy may have been reduced in the left visual hemifield due to the leftward attentional bias, explaining the great difference in saccade accuracy between hemifields obtained in this population.
Critically, the study of Tagu et al. (2016) showed for the first time that eye dominance and visuo-spatial attention lateralization could simultaneously influence saccadic parameters. Examining precisely how functional asymmetries influence individuals’ behavior is of critical importance when attempting to compute their laterality index. Indeed, some studies have shown that the magnitude of the leftward errors observed in a line bisection task is highly correlated with the degree of lateralization of attention functions in the brain (Thiebaut de Schotten et al., 2011; Zago et al., 2017). But line bisection is not the only spatial task impacted by the leftward attentional bias, and visuo-spatial attention is not the only lateralized brain function. Eliciting the global effect in a lateralized saccade task probably allows the effects of several functional asymmetries to be observed simultaneously. The current study therefore aims at isolating the effects of visuo-spatial attention lateralization and of eye dominance found in Tagu et al. (2016) on saccade accuracy, and to uncover the optimal conditions to observe these effects. Our leading hypothesis predicts that the effects of the leftward attentional bias linked to the lateralization of visuo-spatial attention will be mainly observed on short-latency saccades because it is assumed to be a fast phenomenon (Mesulam, 1981, 1999). On the other hand, the effects of the leftward attentional bias on long-latency saccades should be weakened, allowing clear observation of the effects of eye dominance on saccade accuracy. As in Tagu et al. (2016), we therefore have compared target-distractor conditions (in which a visual distractor appears close to the saccade target and should elicit a global effect) with no-distractor control conditions (in which the saccade target is presented alone). We moreover used three different paradigms inducing three different ranges of saccade latency. Saccades were triggered in a step paradigm, in which the visual stimuli were displayed once the fixation cross disappeared. This paradigm was the same as in Tagu et al. (2016), and we therefore expected to replicate the competition between the effects of eye dominance and of visuo-spatial attention lateralization. The step paradigm was contrasted with a gap-200 paradigm, in which a 200 ms blank screen was displayed between the fixation cross disappearance and the appearance of visual stimuli. This paradigm, which is known to reduce saccade latency (Becker, 1989; Saslow, 1967), was expected to allow us to highlight the effects of the leftward attentional bias and of the right hemisphere specialization for visuo-spatial attention. All participants should therefore show lower saccade accuracy (i.e., higher global effect) in the left than in the right visual hemifield, regardless of eye dominance and eye dominance strength. Lastly, we used an overlap-600 paradigm to increase saccade latency (namely, the visual stimuli were displayed 600 milliseconds before the go signal triggering the saccade; Becker, 1989; Leigh & Zee, 2015). These long-latency saccades were expected to let eye dominance effects emerge alone, free from the competition with leftward attentional bias effects. With this paradigm, the advantage on saccade
accuracy of the contralateral hemifield relative to the dominant eye should therefore exhibit the same magnitude for individuals with strong-left and individuals with strong-right eye dominance.
2. Methods 2.1. Participants
One hundred and fourteen individuals took part in this study. All of them were undergraduate students from the Institute of Psychology of Paris Descartes University and received course credits for their participation. All were right-handed (Edinburgh Handedness Inventory, Oldfield, 1971) and had normal or corrected-to-normal vision. They were divided into four groups based on their eye dominance (hole-in-card test repeated three times, Durand & Gould, 1910) and eye dominance strength. The latter was estimated a posteriori, by comparing the peak velocity of leftward and rightward saccades of each eye in the no-distractor control conditions (Tagu et al., 2018a; Vergilino-Perez et al., 2012). Participants showing naso-temporal asymmetry on the median differences in peak velocity between rightward and leftward saccades were considered as presenting weak eye dominance, whereas participants showing no naso-temporal asymmetry were considered as presenting strong eye dominance. All in all, four groups were created: strong-right eye dominance (n= 22, 17 ♀, mean age: 24±8 y.o., mean laterality score: 80±18%), strong-left eye dominance (n=16, 15 ♀, mean age: 24±5 y.o., mean laterality score: 87±14%), weak-right eye dominance (n=46, 35 ♀, mean age: 23±5 y.o., mean laterality score: 81±19%), and weak-left eye dominance (n=30, 23 ♀, mean age: 23±8 y.o., mean laterality score: 81±15%).
Prior to the experiment, participants were informed about the procedure and gave their written informed consent. The experimental procedure has been approved by the local ethics committee of Paris Descartes University (IRB No 20130500001072) and has been conducted in accordance with the 1964 Helsinki declaration and its later amendments or comparable ethical standards.
2.2. Materials
All the visual stimuli were white, with a luminance of 27 cd/m², and their size was 0.5°×0.5°. They were presented on a dark grey background with a luminance of 4.5 cd/m² and displayed on a Iiyama HM240DT monitor (Nagano, Japan) with a refresh rate of 170 Hz and a resolution of 800×600 pixels. The experiment was conducted in a dimly lit room and participants had their head stabilized at 57 cm from the screen with a chin and head rest. Eye movements were binocularly recorded with an EyeLink 1000 (SR Research, Ontario, Canada) sampled at 500 Hz and 0.25°. Each session began with a 9-points calibration. The position of the dominant eye was checked before
each trial, and if it was further than 0.75° away (left, right, up or down) from the center of the screen, the trial was cancelled and renewed later. In that case, a new calibration began before running the next trial. This systematic checking of the calibration before each trial allowed us to ensure that saccades were initiated from the center of the screen, and therefore guaranteed the high precision of the data collected on saccade amplitude. Saccades were detected online based on standard velocity (>30°/s) and acceleration (>8000°/s²) criteria.
2.3. Procedure
Each participant had to perform three 200-trial blocks composed of ten conditions repeated twenty times (600 trials per participant). Each block was followed by a short break and all of the blocks were completed in a single session lasting about 1h30min. Each block was composed of intermixed no-distractor control conditions and
target-distractor conditions. In the no-distractor control conditions, the saccade target was presented alone at the
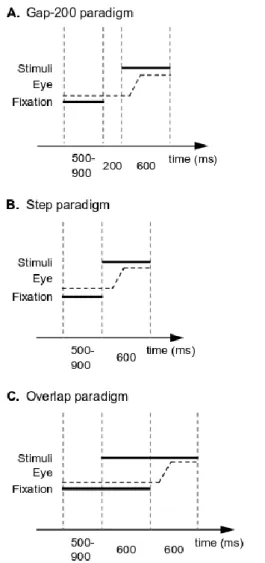
left or at the right of the central fixation cross, at 3°, 5° or 7° of eccentricity. In the target-distractor conditions, the saccade target appeared at the left or at the right of the central fixation cross, at 5° or 7° of eccentricity. The distractor was always presented at 3° of eccentricity, in the same visual hemifield as the saccade target. In each trial, participants had to make a saccade toward the target as soon as the fixation cross disappeared. They were instructed that the saccade target was always the most distant stimulus. The blocks differed in terms of the paradigm used to trigger saccades, and their order was counterbalanced across participants. There were one gap-200, one step, and one overlap-600 paradigm (see Figure 1). Each trial began with the display of a central fixation cross, for 500 to 900 ms. During this time, eye position was still checked and if the distance between the centre of the fixation cross and the dominant eye position exceeded 0.75° in any direction, the trial was cancelled and renewed later in the block. In the gap-200 paradigm (Figure 1a), the fixation cross was followed by a 200 ms blank screen, and then by the presentation of the stimuli (target and distractor). In the step paradigm (Figure 1b), the stimuli appeared immediately after the fixation cross disappeared, whereas in the overlap-600 paradigm (Figure 1c) the stimuli appeared 600 ms before the fixation cross disappeared, and thus before the triggering of the saccade. In all paradigms, the stimuli remained on the screen for 600 ms after the fixation cross had disappeared, and each trial was followed by a 400 ms blank screen before the next trial.
Figure 1: Time course of a trial for each paradigm. (a) In the gap-200 paradigm, the fixation cross disappearance is followed by a 200 ms blank screen, and then by the appearance of the visual stimuli triggering the saccade. (b) In the step paradigm, the fixation cross disappearance is immediately followed by the visual stimuli triggering the saccade. (c) In the overlap-600 paradigm, the visual stimuli appear 600 ms before the fixation cross disappearance and saccade onset.
To sum up, the experiment was therefore composed of three blocks differing by the paradigm used to trigger saccades (gap-200, step, overlap-600) containing six no-distractor control conditions (3 eccentricities × 2 visual hemifields) and of four target-distractor conditions (2 eccentricities × 2 visual hemifields) with twenty trials per condition. Each block was preceded by twenty training trials (two per condition).
2.4. Data analysis
Saccade latency, amplitude and peak velocity were computed offline. To observe the effects of functional asymmetries on saccade accuracy, we calculated the global effect percentage (GEP, Findlay, Brogan, & Wenban-Smith, 1993) with the following formula: GEP = 100 × [(At+d – Ad) / (At - Ad)], where Ad corresponds to the
target-distractor conditions), At corresponds to the average saccade amplitude to isolated target presented at 5° or 7° of
eccentricity, and At+d corresponds to average saccade amplitude to target-distractor conditions (with distractor at
3° and target at 5° or 7° depending on the trial). With this formula, a GEP of 0% means that the saccade endpoint lands at the distractor position, whereas a GEP of 100% means that the saccade endpoint lands at the target position. In other words, the higher the GEP, the lower the global effect. Typically, when target and distractor have the same size and luminance, the GEP is about 50% (Deubel, Wolf, & Hauske, 1984; Findlay, 1982).
All the analyses have been conducted on both the data from the left and right eye. However, as our hypotheses do not predict any difference on saccade latency and amplitude between the left and the right eye, and as the analyses indeed showed similar effects on both datasets, only the data from the right eye are reported here.
3. Results
Trials containing blinks (<.002%), those containing a saccade in the wrong direction (0.88%), those containing a saccade with a latency < 80 ms (1.52%) or > 800 ms (0.067%), as well as trials containing an outlier in terms of saccade latency, amplitude or peak velocity (9.97%) were removed from the analysis. For each participant, outliers were values below (Q1 – 2.3 × IQR) and above (Q3 – 2.3 × IQR), where Q1 and Q3 respectively are the first and third quartile, and IQR is the interquartile range (Tukey boxplot, Carling, 2000). In the end, 87% of the original dataset were analyzed, which represents an average of 523 saccades per participant.
All the results are reported with Mean ± Standard Deviation.
3.1. Saccade latency and amplitude
Before analyzing the influence of eye dominance and functional asymmetries on the GEP, we ran preliminary analyses on saccade latency and amplitude in order to ensure (1) that the paradigms used to trigger saccades (gap-200, step, overlap-600) had the expected effects on saccade latency, and (2) that proximal distractors modified saccade amplitude but not saccade latency compared to no-distractor control conditions. Average saccade latencies and amplitudes are shown in tables 1 and 2, respectively. For each saccade parameter, we ran two ANOVAs. The first one was run on no-distractor control conditions only, in a 2 (Visual hemifield: left, right) × 3 (Paradigm: gap-200, step, overlap-600) × 3 (Eccentricity: 3°, 5°, 7°) design. The second ANOVA compared
gap-200, step, overlap-600) × 3 (Condition: no-distractor control, target-distractor) × 2 (Target eccentricity: 5°, 7°) design. Note that the second ANOVA did not include the no-distractor control condition with target displayed at 3° of eccentricity because it had no equivalent in the target-distractor conditions. For each ANOVA, between-subject factors included Eye dominance (left, right) and Eye dominance strength (strong, weak). We furthermore have assessed the evidence in favor of the alternative hypothesis H1 versus the null hypothesis H0 using Bayes
Factor analyses1 (BF
10 > 1 brings evidence in favor of H1, whereas BF10 < 1 brings evidence in favor of H0) with
the BayesFactor R package version 0.9.12-4.2 (Morey & Rouder, 2018).
1 Bayes Factors comprised between 1 and 3 bring anecdotal evidence for H1, values between 3 and 10 bring
moderate evidence for H1, values between 10 and 30 bring strong evidence for H1, values between 30 and 100 bring very strong evidence for H1, and values above 100 bring extreme evidence for H1. In the same manner, Bayes Factors comprised between 0.33 and 1 bring anecdotal evidence for H0, values between 0.1 and 0.33 bring moderate evidence for H0, values between 0.033 and 0.1 bring strong evidence for H0, values between 0.01 and 0.033 bring very strong evidence for H0, and values below 0.01 bring extreme evidence for H0 (criteria proposed
Left visual hemifield Right visual hemifield
No-distractor control conditions Target-distractor conditions No-distractor control conditions Target-distractor conditions
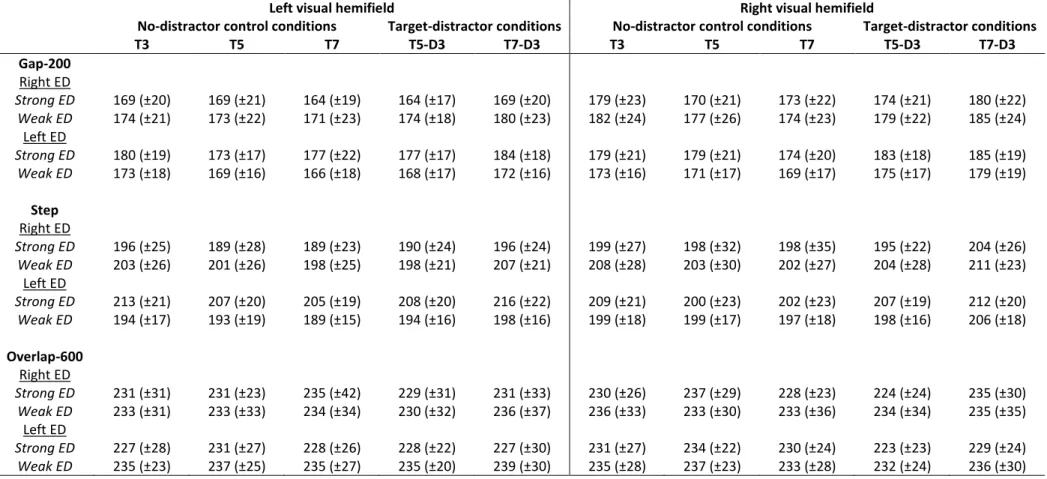
T3 T5 T7 T5-D3 T7-D3 T3 T5 T7 T5-D3 T7-D3 Gap-200 Right ED Strong ED 169 (±20) 169 (±21) 164 (±19) 164 (±17) 169 (±20) 179 (±23) 170 (±21) 173 (±22) 174 (±21) 180 (±22) Weak ED 174 (±21) 173 (±22) 171 (±23) 174 (±18) 180 (±23) 182 (±24) 177 (±26) 174 (±23) 179 (±22) 185 (±24) Left ED Strong ED 180 (±19) 173 (±17) 177 (±22) 177 (±17) 184 (±18) 179 (±21) 179 (±21) 174 (±20) 183 (±18) 185 (±19) Weak ED 173 (±18) 169 (±16) 166 (±18) 168 (±17) 172 (±16) 173 (±16) 171 (±17) 169 (±17) 175 (±17) 179 (±19) Step Right ED Strong ED 196 (±25) 189 (±28) 189 (±23) 190 (±24) 196 (±24) 199 (±27) 198 (±32) 198 (±35) 195 (±22) 204 (±26) Weak ED 203 (±26) 201 (±26) 198 (±25) 198 (±21) 207 (±21) 208 (±28) 203 (±30) 202 (±27) 204 (±28) 211 (±23) Left ED Strong ED 213 (±21) 207 (±20) 205 (±19) 208 (±20) 216 (±22) 209 (±21) 200 (±23) 202 (±23) 207 (±19) 212 (±20) Weak ED 194 (±17) 193 (±19) 189 (±15) 194 (±16) 198 (±16) 199 (±18) 199 (±17) 197 (±18) 198 (±16) 206 (±18) Overlap-600 Right ED Strong ED 231 (±31) 231 (±23) 235 (±42) 229 (±31) 231 (±33) 230 (±26) 237 (±29) 228 (±23) 224 (±24) 235 (±30) Weak ED 233 (±31) 233 (±33) 234 (±34) 230 (±32) 236 (±37) 236 (±33) 233 (±30) 233 (±36) 234 (±34) 235 (±35) Left ED Strong ED 227 (±28) 231 (±27) 228 (±26) 228 (±22) 227 (±30) 231 (±27) 234 (±22) 230 (±24) 223 (±23) 229 (±24) Weak ED 235 (±23) 237 (±25) 235 (±27) 235 (±20) 239 (±30) 235 (±28) 237 (±23) 233 (±28) 232 (±24) 236 (±30) Table 1: Average saccade latencies (and standard deviations) in milliseconds. Participants were divided into four groups according to their eye dominance (left ED / right ED) and eye dominance strength (strong ED / weak ED). In no-distractor control conditions, the saccade target could appear at 3° (T3), 5° (T5) or 7° (T7) of eccentricity, in the left or right visual hemifield. In the target-distractor conditions, the distractor was always presented at 3° of eccentricity whereas the saccade target could be presented at 5° (T5-D3) or 7° (T7-D3) in the left or right visual hemifield.
Left visual hemifield Right visual hemifield
No-distractor control conditions Target-distractor conditions No-distractor control conditions Target-distractor conditions
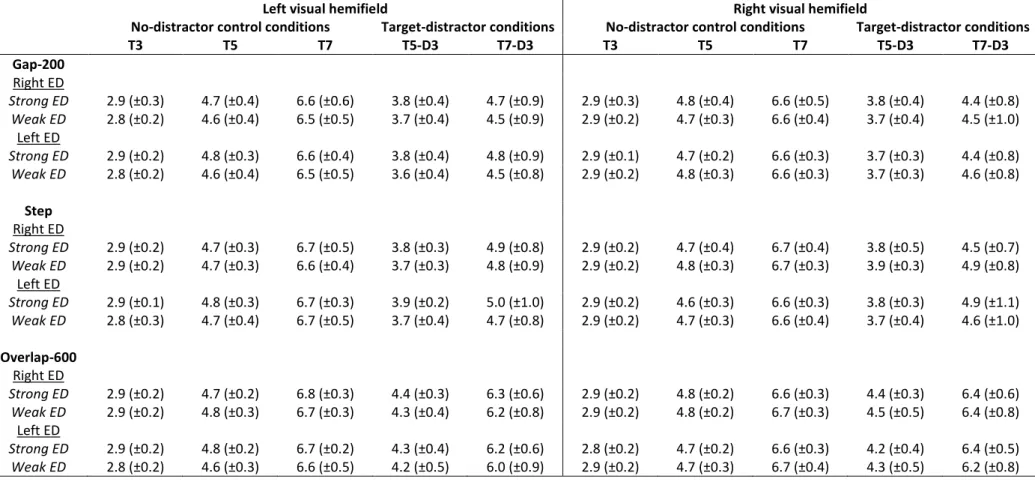
T3 T5 T7 T5-D3 T7-D3 T3 T5 T7 T5-D3 T7-D3 Gap-200 Right ED Strong ED 2.9 (±0.3) 4.7 (±0.4) 6.6 (±0.6) 3.8 (±0.4) 4.7 (±0.9) 2.9 (±0.3) 4.8 (±0.4) 6.6 (±0.5) 3.8 (±0.4) 4.4 (±0.8) Weak ED 2.8 (±0.2) 4.6 (±0.4) 6.5 (±0.5) 3.7 (±0.4) 4.5 (±0.9) 2.9 (±0.2) 4.7 (±0.3) 6.6 (±0.4) 3.7 (±0.4) 4.5 (±1.0) Left ED Strong ED 2.9 (±0.2) 4.8 (±0.3) 6.6 (±0.4) 3.8 (±0.4) 4.8 (±0.9) 2.9 (±0.1) 4.7 (±0.2) 6.6 (±0.3) 3.7 (±0.3) 4.4 (±0.8) Weak ED 2.8 (±0.2) 4.6 (±0.4) 6.5 (±0.5) 3.6 (±0.4) 4.5 (±0.8) 2.9 (±0.2) 4.8 (±0.3) 6.6 (±0.3) 3.7 (±0.3) 4.6 (±0.8) Step Right ED Strong ED 2.9 (±0.2) 4.7 (±0.3) 6.7 (±0.5) 3.8 (±0.3) 4.9 (±0.8) 2.9 (±0.2) 4.7 (±0.4) 6.7 (±0.4) 3.8 (±0.5) 4.5 (±0.7) Weak ED 2.9 (±0.2) 4.7 (±0.3) 6.6 (±0.4) 3.7 (±0.3) 4.8 (±0.9) 2.9 (±0.2) 4.8 (±0.3) 6.7 (±0.3) 3.9 (±0.3) 4.9 (±0.8) Left ED Strong ED 2.9 (±0.1) 4.8 (±0.3) 6.7 (±0.3) 3.9 (±0.2) 5.0 (±1.0) 2.9 (±0.2) 4.6 (±0.3) 6.6 (±0.3) 3.8 (±0.3) 4.9 (±1.1) Weak ED 2.8 (±0.3) 4.7 (±0.4) 6.7 (±0.5) 3.7 (±0.4) 4.7 (±0.8) 2.9 (±0.2) 4.7 (±0.3) 6.6 (±0.4) 3.7 (±0.4) 4.6 (±1.0) Overlap-600 Right ED Strong ED 2.9 (±0.2) 4.7 (±0.2) 6.8 (±0.3) 4.4 (±0.3) 6.3 (±0.6) 2.9 (±0.2) 4.8 (±0.2) 6.6 (±0.3) 4.4 (±0.3) 6.4 (±0.6) Weak ED 2.9 (±0.2) 4.8 (±0.3) 6.7 (±0.3) 4.3 (±0.4) 6.2 (±0.8) 2.9 (±0.2) 4.8 (±0.2) 6.7 (±0.3) 4.5 (±0.5) 6.4 (±0.8) Left ED Strong ED 2.9 (±0.2) 4.8 (±0.2) 6.7 (±0.2) 4.3 (±0.4) 6.2 (±0.6) 2.8 (±0.2) 4.7 (±0.2) 6.6 (±0.3) 4.2 (±0.4) 6.4 (±0.5) Weak ED 2.8 (±0.2) 4.6 (±0.3) 6.6 (±0.5) 4.2 (±0.5) 6.0 (±0.9) 2.9 (±0.2) 4.7 (±0.3) 6.7 (±0.4) 4.3 (±0.5) 6.2 (±0.8) Table 2: Average saccade amplitudes (and standard deviations) in degrees of visual angle. Participants were divided into four groups according to their eye dominance (left ED / right ED) and eye dominance strength (strong ED / weak ED). In no-distractor control conditions, the saccade target could appear at 3° (T3), 5° (T5) or 7° (T7) of eccentricity, in the left or right visual hemifield. In the target-distractor conditions, the distractor was always presented at 3° of eccentricity whereas the saccade target could be presented at 5° (T5-D3) or 7° (T7-D3) in the left or right visual hemifield.
The first ANOVA on no-distractor control conditions confirmed that the Paradigm factor influenced saccade latencies (F[2,220]=259.8, p<.0001, ηp2=.70, BF10 > 100), that were shorter in the gap-200 paradigm (173±20
ms) than in the step paradigm (200±23 ms) and than in the overlap-600 paradigm (233±28 ms) (all p<.0001 at Tukey HSD post-hoc test). But as expected, Paradigm did not influence saccade amplitude in no-distractor control
conditions (F[2,220]=2.28, p>.10, ηp2=.02, BF10 = .007). The ANOVA on saccade amplitude only revealed a
significant effect of target eccentricity (F[2,220]=29752, p<.0001, ηp2=.99, BF10 > 100), showing that saccade
amplitude increased with target eccentricity (see Table 2). Note that Visual hemifield (F[1,110]=5.62, p<.02,
ηp2=.05, BF10 = .55) and Target eccentricity (F[2,220]=14.46, p<.0001, ηp2=.12, BF10 = .05) seemed to influence
saccade latency, but the Bayes Factor analyses indicated evidence in favor of the null hypothesis (all BF10 < 1),
and the observed differences (from 2 to 4 ms) were close to the resolution limits of the eye-tracker we used. These analyses did not show any other significant effect or interaction on saccade latency and amplitude in no-distractor
control conditions.
Moreover, the second ANOVA confirmed that displaying a distractor close to the saccade target decreased saccade amplitude compared to a no-distractor control condition (4.6±.6° vs. 5.7±.3°, F[1,110]=1194.5, p<.0001, ηp2=.92, BF10 > 100). This factor (presence vs. absence of a distractor) also seemed to influence saccade latency
(F[1,110]=25.0, p<.0001, ηp2=.19, BF10 = .64), but note that the Bayes Factor indicated evidence in favor of the
null hypothesis and that the observed difference (201 ms in no-distractor control conditions vs. 204 ms in
target-distractor conditions) was very close to the resolution limits of the eye-tracker we used.
In conclusion, these preliminary analyses confirm that the paradigms used to trigger the saccades had the expected effects on saccade latency, and that the presence of a distractor close to the saccade target did influence saccade amplitude.
3.2. Global effect percentage
We then examined how eye dominance and functional asymmetries influence the GEP, assuming that the effects should vary depending on the paradigm used to trigger saccades. We ran an ANOVA on the GEP in a 2 (Visual hemifield: left, right) × 3 (Paradigm: gap-200, step, overlap-600) × 2 (Target eccentricity: 5°, 7°) design, with Eye dominance (left, right) and Eye dominance strength (strong, weak) as between-subject factors. We have also conducted Bayes Factor analyses to assess the evidence in favor of H1 versus H0. For the interaction terms,the
BF10 corresponds to the Bayes Factor from the comparison between the model containing the factors and their
Factors (BFincl). The latter compares the models containing the factors and their interaction to the equivalent
models containing the factors only, without the interaction.
The results on the GEP have then been analyzed using a linear mixed effect approach, to ensure that the observed effects withstood both between-individual and between-condition variations. We have run the analysis in R using the lmer() function of the lme4 package, version 1.1-21 (Bates et al., 2015). Predictor variables included three within-participant factors (Target Hemifield: left, right; Paradigm: gap-200, step, overlap-600; Target Eccentricity: 5°, 7°), two between-participant factors (Eye dominance: left, right; Eye dominance strength: strong, weak), and all interactions. All the 2-level predictors were coded using mean-centered effect coding. The reference value for the 3-level Paradigm factor was the mean of the gap-200 level. The high number of participants and of trials per condition allowed us to implement the model using the maximal random-effect structure, including random slopes and intercepts for both participants and items (Barr et al., 2013). χ2 statistics and p-values were then obtained by
model comparison.
Note that before running the analyses of interest, we ensured that the counterbalanced factor (block order: Overlap-Step-Gap, Step-Gap-Overlap, Gap-Overlap-Step) had no effect on the GEP, both in an ANOVA (F<1, BF10 = .04)
and in a linear mixed effect model (Intercept = 47.05, SE = 2.28, EstimateSGO = 4.48, SESGO = 3.34, EstimateGOS = -5.94, SEGOS = 3.08; χ2 = 1.43, df = 2, p > .50). Note that in the Linear Mixed Effect analysis, the reference
value of the Block Order factor was the mean of the “Overlap-Step-Gap” level. EstimateSGO and EstimateGOS
correspond to the fixed effects for block orders “Step-Gap-Overlap” and “Gap-Overlap-Step”, respectively.
Gap-200 Step Overlap-600
T5-D3 T7-D3 T5-D3 T7-D3 T5-D3 T7-D3 Left visual hemifield
Right ED Strong ED 49.7 (±14.4) 47.8 (±18.5) 47.0 (±12.3) 53.3 (±16.7) 79.0 (±14.2) 88.5 (±13.4) Weak ED 47.0 (±14.9) 44.2 (±20.6) 47.7 (±12.5) 50.7 (±21.1) 74.4 (±13.5) 86.8 (±19.5) Left ED Strong ED 52.3 (±13.0) 50.4 (±21.3) 52.6 (±6.4) 55.5 (±22.8) 76.3 (±12.3) 88.0 (±15.2) Weak ED 46.1 (±12.4) 46.5 (±20.0) 46.7 (±10.8) 49.5 (±17.8) 74.7 (±17.4) 84.0 (±18.4) Right visual hemifield
Right ED Strong ED 47.2 (±14.1) 41.0 (±18.4) 49.4 (±14.1) 43.5 (±19.4) 83.7 (±14.1) 93.5 (±10.9) Weak ED 46.3 (±14.0) 42.0 (±22.5) 50.2 (±15.7) 52.1 (±20.5) 83.1 (±18.6) 91.7 (±17.8) Left ED Strong ED 43.6 (±13.3) 40.1 (±21.5) 52.5 (±16.0) 52.8 (±24.5) 76.3 (±16.7) 94.8 (±9.4) Weak ED 44.6 (±11.1) 45.6 (±17.5) 45.9 (±12.7) 45.3 (±23.1) 75.8 (±21.2) 88.5 (±19.0) Table 3: Average global effect percentages (and standard deviations). Participants were divided into four groups according to their eye dominance (left ED / right ED) and eye dominance strength (strong ED / weak ED). In all
the three paradigms (gap-200, step, overlap-600), the saccade target could appear in the left or right visual hemifield, at 5° (T5-D3) or 7° (T7-D3) of eccentricity along with a distractor presented at 3°.
The average GEP for each group and each condition is presented in table 3. The results show a main effect of target eccentricity (F[1,110]=18.9, p<.0001, ηp2=.15, BF10 = 2.7), the influence of the distractor being higher (i.e.,
smaller GEP) for targets presented at 5° (58.0±14.0%) than for targets presented at 7° (61.5±18.7%). However, the interaction with Paradigm (F[2,220]=37.7, p<.0001, ηp2=.26, BF10 > 100, BFincl > 100) reveals that this effect
only emerges in the overlap-600 paradigm (77.9±16.0% vs. 89.5±15.5%, p<.0001; all other p>.20 at Tukey HSD post-hoc tests). Besides, the main effect of Paradigm (F[2,220]=429.2, p<.0001, ηp2=.80, BF10 > 100) confirms
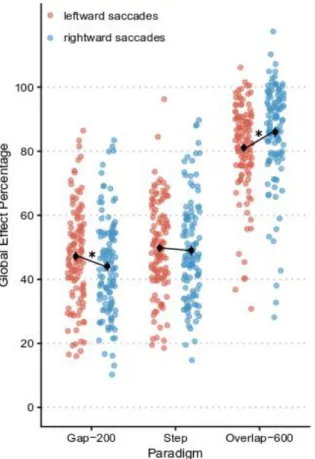
that the increase in saccade latency boosts saccade accuracy, the influence of the distractor being lower (i.e., higher GEP) in the overlap-600 paradigm (83.7±15.7%) than in the step paradigm (49.7±16.6%) and than in the gap-200 paradigm (45.9±16.7%; all ps<.01 at Tukey HSD post-hoc tests). Interestingly for our purpose, although the visual hemifield factor had no significant overall effect (F<1, BF10 = .06), it interacted with Paradigm (F[2,220]=15.8, p<.0001, ηp2=.13, BF10 > 100, BFincl > 100). The interaction (see Figure 2) shows that in the gap-200 paradigm,
the distractor affects less (i.e., higher GEP) leftward (48.0±2.7%) than rightward (43.8±2.6%) saccades accuracy (p<.03 at Tukey HSD post-hoc tests), while in the overlap-600 paradigm it affects more (i.e., lower GEP) leftward (81.4±6.1%) than rightward (85.9±7.4%) saccades (p<.0001 at Tukey HSD post-hoc tests). Surprisingly, no difference of GEP between hemifields arises in the step paradigm (p>.05 at Tukey HSD post-hoc tests). Moreover, the ANOVA does not show any effect of between-subject factors (Eye dominance: F<1, BF10 = .11; Eye dominance strength: F<1, BF10 = .14) nor any interaction including them (all ps>.05), suggesting that eye
dominance and eye dominance strength did not modulate the visual hemifield effects observed in the gap-200 and overlap-600 paradigms.
Figure 2: GEP as a function of visual hemifield and paradigm. The red and blue dots correspond to individual data points for leftward and rightward saccades, respectively. The black dots represent the average GEP in each condition. Error bars represent standard errors of the mean, and asterisks indicate significant differences at p<.05.
We also have tested the results obtained on the GEP in a linear mixed effect approach, to account both for between-individual (114 participants) and between-trial (20 trials × 12 conditions) variations. The fixed effects of the model are presented in Supplementary Table S1. Overall, the analysis revealed that neither Eye dominance (Estimate =
-0.68, SE = 2.73; χ2 = .08, df = 1, p = .78) or Eye dominance strength (Estimate = -1.06, SE = 2.73; χ2 = 0.15, df = 1, p = .70) contributed significantly to the model. Moreover, none of the interactions involving Eye dominance
and/or Eye dominance strength showed significant differences during model comparisons (all ps > .05). Target hemifield (Estimate = -4.24, SE = 1.39; χ2 = 8.91, p = .002), Paradigm (Estimatestep = 3.83, SEstep = 1.01, Estimateoverlap = 37.59, SEoverlap = 1.57; χ2 = 74.14, df = 2, p < .0001) and Eccentricity (Estimate = -2.49, SE = 1.17; χ2 = 4.47, df = 1, p = .03) however had significant effects. The analysis also confirmed the interaction
between Target hemifield and Paradigm, presented in Figure 2 (Estimatestep = 3.07, SEstep = 1.24, Estimateoverlap = 8.49, SEoverlap = 1.64; χ2 = 21.74, df = 2, p < .0001). Overall, the linear mixed effect approach has confirmed the
ANOVA results on the GEP. Importantly, it has shown that our main finding, i.e., the interaction between target hemifield and paradigm, is robust and resistant to both between-individual and between-condition random effects.
The rationale for the manipulation of the paradigms used to trigger saccades (gap-200, step, overlap-600) was to induce different saccade-latency ranges, and to examine whether different left-right asymmetries would emerge depending on saccade latency. However, saccade latency effects can also be investigate within each paradigm, by splitting the data of each individual and condition into two equal saccade-latency bins; one clustering the saccades with a latency equal to or shorter than the median latency in a given condition and individual (short-latency bin, with average latencies of 162±19 ms, 187±20 ms and 208±27 ms in the Gap-200, Step and Overlap-600 paradigms, respectively), and the other one clustering the saccades with a latency longer than the median saccade latency in a given condition and individual (long-latency bin, with average latencies of 193±23 ms, 219±26 ms and 261±37 ms in the Gap-200, Step and Overlap-600 paradigms, respectively). The results on GEP have therefore been examined separately for the two saccade-latency bins in a linear mixed effect approach. Supplementary tables S2 and S3 present the fixed effects of the models on short- and long-latency bins, respectively. The analyses reveal that the interaction between visual hemifield and paradigm (Figure 2) significantly contributes to the model, for both latency bins (short-latency bin: Estimatestep = 2.61, SEstep = 1.33, Estimateoverlap = 7.97, SEoverlap = 1.63, χ2 = 19.62, df = 2, p < .0001; long-latency bin: Estimatestep = 3.36, SEstep = 1.51, Estimateoverlap = 8.90, SEoverlap = 2.01,
χ2 = 18.71, df = 2, p < .0001). Eye dominance (short-latency bin: Estimate = -0.98, SE = 2.80, χ2 = .12, df = 1, p = .72; long-latency bin: Estimate = -0.42, SE = 2.90, χ2 = .03, df = 1, p = .87) and Eye dominance strength
(short-latency bin: Estimate = 0.42, SE = 2.80, χ2 = .02, df = 1, p = .89; long-latency bin: Estimate = -2.77, SE = 2.90, χ2 = .91, df = 1, p = .34) do not appear to affect the GEP results. Overall, this additional analysis reveals that our
main result (interaction between visual hemifield and paradigm, Figure 2) is robust and holds for both saccade-latency bins.
3.3. Landing position distributions
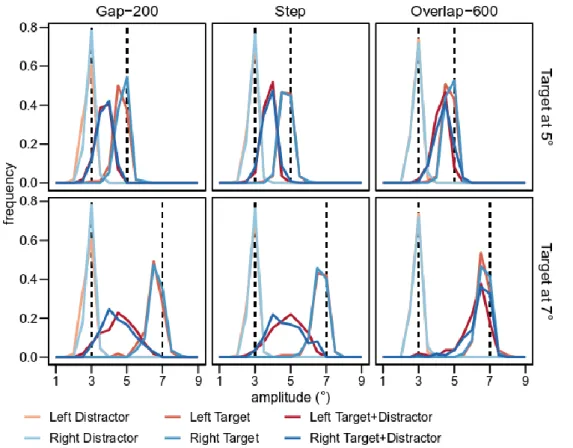
The GEP results suggest that different asymmetries arise depending on the paradigm used to trigger saccades, the effect of the distractor on saccade accuracy being stronger for rightward than for leftward saccades in the gap-200 paradigm, but stronger for leftward than for rightward saccades in the overlap-600 paradigm. Another way to examine this effect is to compare the distributions of saccade landing positions of leftward and rightward saccades. The asymmetry between hemifields found in the GEP analysis should indeed be reflected in shifts in the landing position distributions. In the target-distractor conditions of the gap-200 paradigm, the landing position distributions of leftward saccades should display a shift toward the target location, while in the overlap-600 paradigm it should display a shift toward the distractor (and vice versa for rightward saccades). Figure 3 presents saccade landing position distributions for target-distractor conditions as well as for no-distractor control
conditions, for each paradigm, each target eccentricity, and each visual hemifield. All the distributions are
unimodal (smallest p = 0.38 at Hartigan’s dip test, Hartigan & Hartigan, 1985), including the target-distractor
conditions, which confirms the actual triggering of a global effect on saccade accuracy. The examination of landing
position distributions in target-distractor conditions confirms that during the gap-200 paradigm, rightward saccade distributions are slightly more shifted toward the distractor than leftward saccade distributions, and that it is the reverse during the overlap-600 paradigm. Note however that although the effect is observed at both target eccentricities in the overlap-600 paradigm, it seems to be only at the 7° target eccentricity in the gap-200 paradigm. Interestingly, the landing position distributions tend to show the same pattern in the step and in the gap-200 paradigms (i.e., shift of rightward saccades toward the distractor in target-distractor conditions). Although the effect in the step paradigm is not significant in the GEP analysis, it might reflect a dichotomy between reactive (in gap-200 and step paradigms) and voluntary saccades (in the overlap-600 paradigm).
Figure 3: Saccade landing position distributions. Distribution of saccade amplitudes with 0.5° bin-width as a function of Paradigm (gap-200, step, overlap-600) and Target eccentricity (5°, 7°). The colored lines represent the different conditions, and the vertical dashed lines correspond to distractor (3°) and target (5 or 7°) physical locations.
In conclusion, both the analyses of the GEP and of saccade landing position distributions show that short-latency saccades triggered in a gap-200 paradigm are shifted toward the distractor and are more accurate in the left than
in the right visual hemifield, whereas long-latency saccades triggered in an overlap-600 paradigm are shifted toward the target and are more accurate in the right than in the left visual hemifield.
4. Discussion
On the whole, the main result of this study is that the visual hemifield and the paradigm used to trigger the saccades both influence the global effect on saccade accuracy. Eye dominance and eye dominance strength however do not seem to influence the global effect, which runs against the findings of Tagu et al. (2016) showing that among strong-eye-dominance individuals, distractors affected less saccade accuracy (i.e., higher GEP) in the hemifield contralateral to the dominant eye than in the ipsilateral visual hemifield. Some methodological differences can however explain such a discrepancy with the results of the current study. Critically, in Tagu et al. (2016), participants had to perform saccades in a global effect paradigm including several blocks of trials in which the target hemifield was held constant. Conversely, in the current study, the target hemifield was intermixed in each block of trials, which has two major consequences. First, as the uncertainty about target location is much more important, the influence of decisional and strategy-based processes on the global effect may have been maximized (Casteau & Vitu, 2012), interfering with the potential effects of eye dominance and eye dominance strength. By contrast, as each block of trials had the same target hemifield in Tagu et al. (2016), the influence of these higher-order processes were minimized, allowing the effects of eye dominance and eye dominance strength to emerge. Second, by increasing the uncertainty about target location, we have considerably increased task difficulty, as reflected in the higher influence of the distractor (lower GEP), and in higher saccade latency in the step paradigm of the current study (49.7±16.6% and 200±23 ms) compared to the previous study that only included one step paradigm (70.6±16.6% and 182±22 ms). The massive influence of the distractor may have overridden effects presumably more difficult to show in behavioral performance, namely those of eye dominance and eye dominance strength on saccade accuracy. Interestingly, the difference in saccade latency between the two studies is not linked to a difference in the proportion of saccade direction errors (current study: 0.88%; Tagu et al., 2016: 0.81%). This possibly reflects a speed-accuracy trade-off between saccade latency and saccade direction errors: in the current study, participants’ increased saccade latencies may result from their attempt to reduce saccade direction errors. Here, eye dominance strength has been assessed on the basis of the examination of the naso-temporal asymmetry in saccadic peak velocity, using the method proposed by Vergilino-Perez et al. (2012). Although efficient and robust, this method merely provides a dichotomy contrasting strong and weak eye dominances. In a recent study (Tagu et al., 2018a), we have proposed a new method based on the consideration of two asymmetries impacting
saccadic peak velocity: the naso-temporal and the centripetal-centrifugal asymmetries. This method provides a graded measure allowing the characterization of individuals in terms of percentage of eye dominance strength (from -100%: no eye dominance to +100%: very strong eye dominance). However, while this estimation requires the analysis of both centripetal and centrifugal saccades, the current study only involves centrifugal saccades initiated from the center of the screen. Hence, the binary quantification of eye dominance strength used in the current study might have impeded the emergence of eye dominance effects on saccade accuracy. Future studies examining saccade accuracy with a graded measure of eye dominance strength might help to clarify the differing results reported in Tagu et al. (2016) and in the step paradigm in the current study.
Despite the absence of effects of eye dominance and eye dominance strength on the GEP, our results show that in the gap-200 paradigm, leftward saccades were more accurate (i.e., higher GEP) than rightward saccades (see Figure 2). This is surprising as we expected the reverse, i.e., less accurate leftward than rightward saccades due to the leftward attentional bias giving more weight to the distractor in the left than in the right visual hemifield. This result, expected in the gap-200 paradigm, was actually found in the overlap-600 paradigm, where rightward saccades were more accurate than leftward saccades (see Figure 2). These results could mean that, contrary to our expectations, the leftward attentional bias needs time to occur, and only does so during the long-latency saccades induced with the overlap-600 paradigm (not during short-latency saccades induced with the gap-200 paradigm). Note however that the leftward attentional bias is expected to be a fast phenomenon, driven by early parietal structures (Mesulam, 1981, 1999; Thiebaut de Schotten et al., 2011; Toba et al., 2011). Hence, another possibility is that the leftward attentional bias does not give more weight to the distractor, but rather boosts saccade accuracy in the left visual hemifield by giving more weight to the target. The leftward attentional bias would then be a fast phenomenon observed on short latency saccades, explaining the higher accuracy of leftward than rightward saccades observed in the gap-200 paradigm of the current study. This interpretation is consistent with the results of Thomas & Nicholls (2018), showing that the sudden appearance of an irrelevant distractor has either inhibiting or facilitating effects on detection performance, depending on task complexity (feature-based or conjunction-based visual search). Furthermore, the authors found evidence for left-right asymmetries in detection performance only in the more complex conjunction-based task, where the appearance of a distractor in the left visual hemifield shortened (rather than increased) manual reaction times. Despite the large methodological differences between Thomas & Nicholls (2018)’s study and the current one, both suggest that the leftward attentional bias tends to improve performance in the left visual hemifield compared to the right one, either by shortening manual response times or by increasing saccade accuracy.
Using a paradigm more similar to ours, Wollenberg, Deubel, & Szinte (2018) interestingly showed that before averaging saccades, visual attention is not focused on the saccade endpoint, but rather shared between target and distractor locations (“discontinuous deployment of attention”, see also Van der Stigchel & de Vries, 2015). Based on these results, they suggest that averaging saccades arise from an uncompleted attentional selection, with two peaks of activity in the saccade map of the superior colliculus, corresponding the target and distractor locations. This uncompleted attentional selection would then result in a decoupling between saccade endpoint and locus of attention. Our results in the gap-200 paradigm clearly show saccade averaging, with GEP close to 50% and unimodal distributions of saccade landing positions. However, the distribution of leftward averaging saccades was less shifted toward the distractor location when compared with rightward averaging saccades. In the light of Wollenberg et al. (2018)’s results, this probably means that the leftward attentional bias (right hemisphere specialization) allows for a more efficient attentional selection process for leftward saccades than for rightward saccades. In other words, the higher accuracy of leftward saccades in the gap-200 paradigm possibly reflects a more advanced attentional selection, imputable to the lateralization of visuo-spatial attention in the right cerebral hemisphere.
So far, we have discussed the results obtained in the gap-200 paradigm, but the higher accuracy found for rightward than leftward saccades in the overlap-600 paradigm (Figure 2) remains to be explained. One possibility is that because the leftward attentional bias driven by the right hemisphere specialization for visuo-spatial attention is a fast phenomenon, its effects cannot be observed on longer latency saccades. The higher accuracy of rightward saccades may therefore be driven by another functional asymmetry, and could reflect the left hemisphere local processing / right hemisphere global processing lateralization (Brederoo et al., 2017; Fink et al., 1996; Martin, 1979; Van Kleeck, 1989). The stronger distractor effect for leftward than for rightward saccades indeed suggests that the target-distractor visual configuration is processed globally in the left visual hemifield (right hemisphere), whereas the weaker distractor effect for rightward saccades suggests that the saccade target is selected locally in the right visual hemifield (left hemisphere). This interpretation critically suggests that in Tagu et al. (2016), the phenomenon interfering with eye dominance effects did not result from the lateralization of visuo-spatial attention, but from the lateralization of global/local processing in the brain. Saccade accuracy was lower for leftward than rightward saccades due to the specialization of the right hemisphere for global processing, not to its specialization for visuo-spatial attention. This interpretation is consistent with Wollenberg et al. (2018), who propose that averaging saccades co-occur with an enhancement of local visual information processing. Note however that we here assume that the global/local lateralization takes more time than the visuo-spatial attention lateralization to be
accessible for observation. Indeed, if the leftward attentional bias is assumed to be a fast phenomenon mostly guided by parietal structures of the attentional network (Mesulam, 1981, 1999), the asymmetry between local and global processing should be a slower phenomenon, because of the involvement of higher order temporal areas (Heinze, Hinrichs, Scholz, Burchert, & Mangun, 1998; Martinez et al., 1997; Mesulam, 1981, 1999). The average saccade latency being shorter in Tagu et al. (2016) than in the current study, one could expect to observe the visuo-spatial attention lateralization rather than the local/global processing lateralization. In the light of Thomas & Nicholls (2018)’s results, it however seems that the leftward attentional bias improves rather than impairs performance in the left visual hemifield. Its effect should therefore increase (as found in the gap-200 paradigm of the current study) rather than decrease saccade accuracy. As argued earlier, we moreover assume that due to the less difficult task used in Tagu et al. (2016), all the effects of the functional asymmetries on saccade accuracy may have emerged on shorter latencies. This could explain why in Tagu et al. (2016) the global/local processing lateralization was observed for saccade latencies as short as 180 ms. Note however that saccade latency might not be the only temporal parameter affecting the manifestation of functional asymmetries in the accuracy of averaging saccades. Indeed, the comparison of short- and long-latency bins has revealed that the opposite asymmetries differentiating the gap-200 and the overlap-600 paradigms were observed for both latencies above and latencies below the median of each condition. Moreover, the study of Wollenberg et al. (2018) suggests that what matters is the timing of the attentional selection process. As long as this process is ongoing, averaging saccades can emerge, including in long-latency saccades. While our results in the gap-200 paradigm suggest that the leftward attentional bias allows for a more efficient attentional selection process for leftward saccades, our results in the overlap-600 paradigm suggest instead the enhancement of local visual information before averaging saccades lead to more accurate rightward averaging saccades. All in all, we therefore suggest that in gap-200, the right lateralization of visuo-spatial attention influences the early stages of the attentional selection process, leading to higher accuracy for leftward saccades; whereas in overlap-600, the local-global lateralization influences the late stages of the attentional selection process, leading to higher accuracy for rightward saccades (advantage of the left hemisphere for local processing).
Importantly, the literature about the underlying mechanisms of the global effect suggests that it is a low-level process, arising from competitive interactions between different neural populations at the level of the saccade map in the superior colliculus (for reviews, see Van der Stigchel & Nijboer, 2011; Vitu, 2008). Hence, one may wonder how functional asymmetries at the cortical level could influence such a low-level process. The saccade generation network actually involves a high number of cortical areas (Corneil & Munoz, 2014; Leigh & Zee, 2015; Sparks,
2002; White & Munoz, 2011). When triggering a saccade, V1 notably transmits the visual information to the parietal and frontal eye fields which both project onto the superior colliculus. Recent results (Wollenberg, Deubel, & Szinte, 2018) support the view that these cortical regions are involved in the global effect and influence the competition between target and distractor locations in the saccade map of the superior colliculus (see also Deubel et al., 1988). We therefore argue that functional asymmetries in the parietal or occipital cortex (e.g., the lateralization of visuo-spatial attention or of eye dominance) spread across the upcoming saccade generation network via descending projections to the superior colliculus.
To conclude, we have shown that studying saccade accuracy in a global effect paradigm through three different saccade latency ranges makes it possible to analyze the combined effects of several functional asymmetries in vision. If the right cerebral hemisphere specialization for visuo-spatial attention seems to mainly influence the accuracy of short-latency saccades elicited in a gap-200 paradigm, the lateralization of global/local processing seems to mainly affect the accuracy of long-latency saccades elicited in an overlap-600 paradigm. Moreover, a better understanding of the time course of these functional asymmetries could be of critical importance in light of their impact on our behavior, and regarding their neural correlates. First, better understanding of the behavioral expression of visuo-spatial attention lateralization could for example provide new clues for the rehabilitation of attentional disorders such as hemineglect (Vallar, 1998). Second, these results could have a strong impact on research aiming at measuring individuals’ degree of lateralization. In the existing literature, studies mainly use line bisection tasks, and only assess the degree of lateralization of visuo-spatial attention (Nicholls, Beckman, & Churches, 2016; Thiebaut de Schotten et al., 2011; Zago et al., 2017, 2016). Here, we show that analyzing saccade accuracy in a global effect paradigm allows assessing individuals’ degree of lateralization for several functional asymmetries, not only for the visuo-spatial attention lateralization. Finally, this study shows that observing or not the effects of eye dominance and eye dominance strength on oculomotor dynamics depends on task difficulty, and that minimizing decisional and strategy-based processes is a prerequisite to observe them.
Funding. This research did not receive any specific grant from funding agencies in the public, commercial, or not-for-profit sectors.
5. References
Barr, D. J., Levy, R., Scheepers, C., & Tily, H. J. (2013). Random effects structure for confirmatory hypothesis testing: Keep it maximal. Journal of Memory and Language, 68(3), 255-278. https://doi.org/10.1016/j.jml.2012.11.001
Bates, D., Maechler, M., Bolker, B., & Walker, S. (2015). Fitting linear mixed-effects models using lme4. Journal
of Statistical Software, 67(1), 1-48. https://doi.org/10.18637/jss.v067.i01
Becker, W. (1989). The neurobiology of saccadic eye movements. Metrics. In R. H. Wurtz & M. E. Goldberg (Eds.), Reviews of Oculomotor Research, 3, (pp. 13-66). Michigan: Elsevier.
Bompas, A., Sterling, T., Rafal, R. D., & Sumner, P. (2008). Naso-temporal asymmetry for signals invisible to the retinotectal pathway. Journal of Neurophysiology, 100(1), 412-421. https://doi.org/10.1152/jn.90312.2008
Bowers, D., & Heilman, K. M. (1980). Pseudoneglect: Effects of hemispace on a tactile line bisection task.
Neuropsychologia, 18(4–5), 491–498. https://doi.org/10.1016/0028-3932(80)90151-7
Brederoo, S. G., Nieuwenstein, M. R., Lorist, M. M., & Cornelissen, F. W. (2017). Hemispheric specialization for global and local processing: A direct comparison of linguistic and non-linguistic stimuli. Brain and
Cognition, 119, 10–16. https://doi.org/10.1016/j.bandc.2017.09.005
Carling, K. (2000). Resistant outlier rules and the non-Gaussian case. Computational Statistics & Data Analysis,
33(3), 249–258. https://doi.org/10.1016/S0167-9473(99)00057-2
Casteau, S., & Vitu, F. (2012). On the effect of remote and proximal distractors on saccadic behavior: A challenge to neural-field models. Journal of Vision, 12(12), 14–14.
Chaumillon, R., Alahyane, N., Senot, P., Vergne, J., Lemoine-Lardennois, C., Blouin, J., … Vergilino-Perez, D. (2017). Asymmetry in visual information processing depends on the strength of eye dominance.
Neuropsychologia, 96, 129–136. https://doi.org/10.1016/j.neuropsychologia.2017.01.015
Chaumillon, R., Blouin, J., & Guillaume, A. (2014). Eye dominance influences triggering action: The Poffenberger paradigm revisited. Cortex, 58, 86–98. https://doi.org/10.1016/j.cortex.2014.05.009
Collewijn, H., Erkelens, C. J., & Steinman, R. M. (1988). Binocular co‐ordination of human horizontal saccadic eye movements. The Journal of Physiology, 404(1), 157-182.
Corballis, P. M., Funnell, M. G., & Gazzaniga, M. S. (1999). A dissociation between spatial and identity matching in callosotomy patients. NeuroReport, 10(10), 2183.