A
SSESSING THE
I
MPACT
OF
H
APTIC
P
ERIPHERAL
D
ISPLAYS FOR
UAV
O
PERATORS
B. Donmez
H.D. Graham
M.L. Cummings
M
ASSACHUSETTS
I
NSTITUTE OF
T
ECHNOLOGY
*
P
REPARED
F
OR
C
HARLES
R
IVER
A
NALYTICS
,
I
NC
.
HAL2008-02
M
ARCH
2008
*MIT Department of Aeronautics and Astronautics, Cambridge, MA 02139
ii
Table of Contents
ABSTRACT ...1 INTRODUCTION ...2 EXPERIMENTAL PROTOCOL...3 Objective ...3 Participants...3 Apparatus...3 Experimental Tasks ...6 Haptic Feedback ...8 Experimental Design...9 Dependent Variables...10 Procedure...10 RESULTS ...11 Course Deviations...11 Late Arrivals ...11Secondary Task Engagement and Subjective Workload ...12
Post-test Feedback ...13
DISCUSSION...14
ACKNOWLEDGEMENTS ...15
REFERENCES ...15
APPENDIX: PHASE I REPORT...17
iii
List of Figures
Figure 1: Multiple Autonomous Unmanned Vehicle Experimental (MAUVE) test bed. ... 4
Figure 2: The Multi-Modal Workstation (MMWS)... 4
Figure 3: Sensimetrics HDiSP. ... 5
Figure 4:Haptic feedback hardware: pressure vest, and vibrating wristband. ... 6
Figure 5. Vibrating wristband and air pressure bladders for the vest. ... 6
Figure 6: A course deviation event. ... 7
Figure 7: A late arrival event. ... 7
Figure 8. Number of motors activated and gap time between each activation as a function of UAV course deviation... 9
Figure 9: Course deviation reaction times (means and standard error bars)... 11
Figure 10: Late arrival reaction times (means and standard error bars). ... 12
Figure 11: Number of push call responses and subjective workload (means and standard error bars)... 13
1
A
BSTRACTObjectives: A pilot study was conducted to investigate the effectiveness of continuous haptic peripheral displays in supporting multiple UAV supervisory control. Background: Previous research shows that continuous auditory peripheral displays can enhance operator performance in monitoring events that are continuous in nature, such as monitoring how well UAVs stay on their pre-planned courses. This research also shows that auditory alerts can be masked by other auditory information. Command and control operations are generally performed in noisy environments with multiple auditory alerts presented to the operators. In order to avoid this masking problem, another potentially useful sensory channel for providing redundant information to UAV operators is the haptic channel. Method: A pilot experiment was conducted with 13 participants, using a simulated multiple UAV supervisory control task. All participants completed two haptic feedback conditions (continuous and threshold), where they received alerts based on UAV course deviations and late arrivals to targets. Results: Threshold haptic feedback was found to be more effective for late target arrivals, whereas continuous haptic feedback resulted in faster reactions to course deviations. Conclusions: Continuous haptic feedback appears to be more appropriate for monitoring events that are continuous in nature (i.e., how well a UAV keeps its course). In contrast, threshold haptic feedback appears to better support response to discrete events (i.e., late target arrivals). Future research: Because this is a pilot study, more research is needed to validate these preliminary findings. A direct comparison between auditory and haptic feedback is also needed to provide better insights into the potential benefits of multi-modal peripheral displays in command and control of multiple UAVs.
2
I
NTRODUCTIONIn current military conflicts, the unmanned aerial vehicle (UAV) is one of the most highly sought after air assets (Whitney, 2007). UAVs provide real time information and support to battlefield operations remotely from either local or global control station platforms. Each of these operational environments presents fluid atmospheres of noise and activity.
Currently many medium and high altitude UAV operations require multiple operators to control a single UAV; the desire for the future is to invert the numbers and have a single operator control multiple UAVs (Culbertson, 2006). To achieve this, research is needed to understand how best to aid and integrate the human operator into a system of semi-autonomous UAVs. Due to potential information overload of operators in visually-saturating domains such as UAV supervisory control, reducing mental workload by offloading some cognitive processing to the other senses, primarily auditory and haptic, is critical.
Graham & Cummings (2007) investigated whether continuous auditory displays could be applied to a command and control setting, particularly for supervisory control of one or more unmanned vehicles by a single operator (see the Appendix). Specifically, two continuous audio displays were mapped to the alerting of two human supervisory task problems: UAV course deviations and late target arrivals. The findings suggest that for UAV course conformance, the continuous audio alert resulted in better performance than discrete audio, regardless of the alert type provided for late target arrivals (i.e., continuous or threshold). For late arrivals, continuous late arrival alert in general, and the threshold late arrival alert only when accompanied by threshold course deviation alert resulted in good performance. When accompanied by continuous course deviation alert, the threshold late arrival alert generated the worst performance. The authors attributed this performance degradation to a possible masking problem where the continuous course deviation audio alert saturated the audio channel to a point that the late arrival’s threshold beep alerts were not heard, resulting in longer late arrival reaction times.
Auditory feedback could enhance operator performance, but command and control settings are generally noisy, and auditory alerts may be masked, as was highlighted in the previous study. Another sensory channel that can be utilized to provide feedback to operators is the haptic channel. Haptic feedback has been shown to support operator performance in different domains, such as driving (Schumann, Godthelp, Farber, & Wontorra, 1993; Suzuki & Jansson, 2003), and aviation (Sklar & Sarter, 1999). Sklar & Sarter (1999) showed that when compared to visual cues, both tactile, and redundant visual and tactile cues result in faster response to and higher detections rates for mode transitions in an automated cockpit system. Burke et al. (2006) compared the effects of visual-auditory and visual-tactic feedback using a meta-analytic approach on 43 different studies. Adding an additional modality was found to enhance performance overall, with visual-auditory feedback most effective for moderate workload, single task conditions, and visual-tactile feedback more effective for high workload, multiple task conditions. As the command and control tasks shift from many operators controlling one vehicle to one controlling many, high operator workload can become a major issue. Moreover, as mentioned above, auditory warnings provided to the operator can be masked by environmental noise and other auditory alerts. Therefore, haptic feedback may provide better support for command and control, and merits research in this domain.
3
As a follow on to the research of Graham & Cummings (2007), a pilot study was conducted to assess the potential benefits of continuous haptic feedback in UAV supervisory control. This report presents the findings of this study which in particular compared continuous haptic feedback to discrete haptic feedback.
E
XPERIMENTALP
ROTOCOL ObjectiveThe objective of this experiment was to assess and compare the effects of continuous and discrete haptic feedback in supporting multiple UAV supervisory control. Participants were presented with continuous or discrete haptic feedback on UAV course deviations and late target arrivals while performing an auditory secondary task.
Participants
Thirteen participants completed the study. The majority of participants were Humans and Automation Laboratory members. The experiment took between 2.5 and 3 hours to complete. The threshold condition data for the first participant could not be included in the analysis due to a bug in the experimental software which was later fixed. Another participant’s data was completely dropped from analysis because of the test proctor failing to administer proper training. This participant was also an outlier in regards to their age (i.e., 63). The remaining participants consisted of five females and seven males, ages ranging from 18 to 45 years (mean = 27, standard deviation = 8.14).
Apparatus
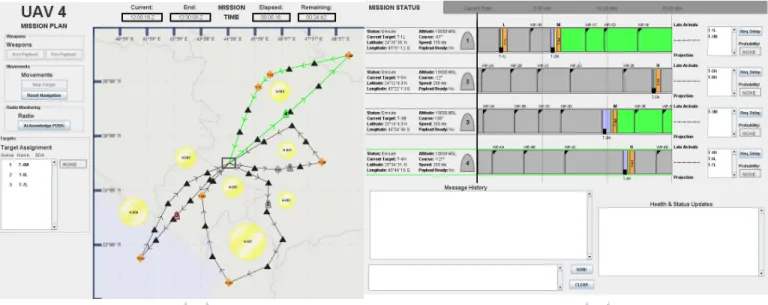
The simulated task of controlling multiple UAVs was carried out in Multiple Autonomous Unmanned Vehicle Experimental (MAUVE) test bed developed by The Massachusetts Institute of Technology’s Humans and Automation Laboratory (HAL). MAUVE is a two screen interface that allows the simulation of any number of unmanned vehicles conducting strike operations in hostile environments (Figure 1). MAUVE, for this experiment, allowed the operator to arm and fire on targets with various priorities while monitoring each UAV’s flight of path, event timeline, and radio traffic (The Appendix provides more details).
The test bed provided a map for geo-spatial tracking of UAVs on their preset flight paths along with an interaction control panel for making UAV control inputs (Map Display, Figure 1). Control inputs included arming and firing a UAV to destroy targets, directing specific path changes, and acknowledging radio calls. The path changes included commanding a UAV to skip a target to get a UAV back on schedule. The operator could also reset the UAV’s onboard navigation to get the vehicle back on course if it drifted.
A timeline for each UAV, a scheduling decision support tool for each UAV, and chat interfaces were also provided (Timeline Display, Figure 1). The timeline display helped operators ensure
4
UAVs would be on time to targets by monitoring when they would arrive at targets, and in what phase they were currently located.
Figure 1: Multiple Autonomous Unmanned Vehicle Experimental (MAUVE) test bed.
Figure 2: The Multi-Modal Workstation (MMWS).
The MAUVE simulation environment was run on a multi-modal workstation (MMWS). Pictured in Figure 2, the MMWS is a four screen computer display (Osga, Van Orden, Campbell, Kellmeyer, & Lulue, 2002). The three screens across the top were 21 inches and set to display at 1280 x 1024 pixel, 16 bit color resolution, and the 15 inch bottom center screen was set at 1024 x 768 pixels, 32 bit color resolution. The computer used to run the simulator was a Dell Optiplex GX280 with a Pentium 4 processor and an Appian Jeronimo Pro 4-Port graphics card.
5
Participants controlled the simulator through a generic corded computer mouse. Throughout the experiment, the top left display showed the mission objectives and priorities, and the bottom center displayed the color-coding for MAUVE. The top center display contained the left MAUVE map and interaction display, and the top right display included the right MAUVE timeline and decision support display. During the test sessions, the screen recordings for the left and right MAUVE displays were captured by Camtasia ® recording software.
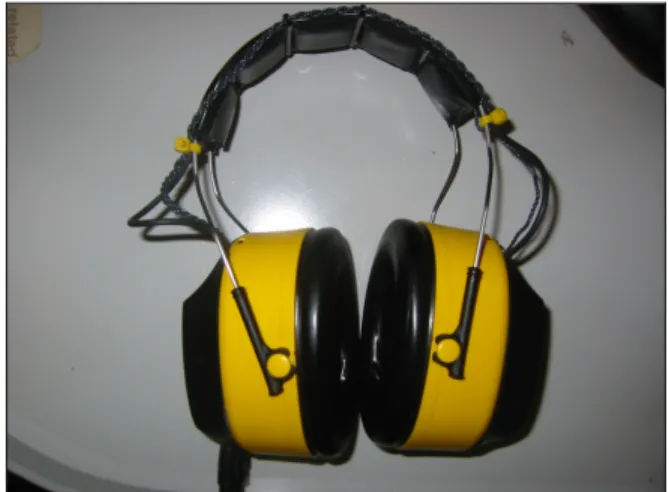
An over-the-head headset with sealed around-the-ear cups (Sensimetrics HDiSP, Figure 3) was used to present the auditory secondary task used in the experiment. This headset provides ambient noise attenuation ranging from 35 to 40 db for the spectrum between 500 Hz and 8 kHz.
Figure 3: Sensimetrics HDiSP.
Haptic feedback was presented through a pressure vest that expanded based on late target arrivals, and a wristband that vibrated to indicate course deviations (Figure 4, Figure 5). The hardware for the pressure vest included miniature face-mounted control valves and eight place manifolds from the Lee Inc. “LH Series”. The bladders inflated to 20 psi. The wristband used five Electronics Inc. “QX” miniature vibration motors. The frequency of the vibrations depended on the tightness with which the motors were held against the body, but the nominal frequency was 100 Hz. Participants wore the wristband on their right hand which they also controlled the mouse with. How these haptic devices behaved for late target arrivals, and course deviations will be described in further detail in a subsequent section.
6
Figure 4:Haptic feedback hardware: pressure vest, and vibrating wristband.
Figure 5. Vibrating wristband and air pressure bladders for the vest.
Experimental Tasks
The task used in this experiment was identical to the multiple UAV level scenario tested by Graham & Cummings (2007), where participants had to control four UAVs. In particular, participants had to respond to UAV course deviations and late target arrivals while performing an auditory secondary task. The primary task of the operator was to ensure weapons were dropped on the correct targets during the specified windows of opportunity. However, unexpected head winds or crosswinds could cause UAVs to slow their speed or drift off course, requiring the operator to take corrective action for projected target late arrivals or course deviations. Late arrivals were a higher priority than course deviations. In addressing late arrivals,
7
the priority of the target (high, medium, or low) also had to be addressed, such that it was more important to hit a high priority target than a medium priority target, and so on. In addition, operators also had to ensure the UAVs would return to base by a specified time.
Course deviations: The green line in Figure 6 indicates the plotted and desired flight path of a UAV. Anytime the UAV has completely departed from the green course line, it is considered to have deviated. During the simulation, the UAVs constantly fluctuated back and forth on their flight paths, but participants were trained to respond when the UAV actually was no longer touching the course line. Figure 6 illustrates UAV 3 on course, almost off course, and off course. The instructions on how to comply with recovery rules for course deviations were to click “Reset Navigation.” This theoretically reset the onboard navigation in the UAV and caused it to fly back to the planned flight path.
On Course Almost Off Course Off Course
Figure 6: A course deviation event.
Late target arrivals: Late arrivals were caused when a UAV slowed down because of unforeseen headwinds and was no longer able to reach a target in time to complete the firing mission, according to its originally scheduled time. Figure 7 shows the visual representation for a late arrival. A black rectangle on the timeline shows when the UAV is going to arrive at the labeled target, and changes from black to red when the UAV is late. This can also be seen when the black rectangle moves past the orange window of opportunity. On the timeline below, the red rectangle labeled “T-1L” indicates that the UAV is going to be late to target T-1L. In contrast, the black rectangle labeled “T-2M” indicates that the UAV is going to be on time to target T-2M.
Figure 7: A late arrival event.
Participants were instructed to skip the low priority targets by clicking the “Skip Target” button, which caused the UAV to proceed immediately to the next target. For medium and high priority targets, the option was given to use a decision support visualization tool (DSV), which illustrated the effect of requesting delay for the current late target on the remaining targets for that UAV’s flight plan. With the assistance of the information presented in the DSV, participants then
8
decided whether they should click the “Skip Target” button or “Request Delay” button. If they clicked “Request Delay,” they then had to wait to see if a delay was granted, and if the delay was granted the UAV was then no longer late to the target and would be able to destroy it. For a high priority target the participants were instructed to employ DSV before requesting delay or skipping target.
The instructions on how to comply with recovery rules for target late arrivals were: • Low Priority – Click “Skip Target”
• Medium Priority – Click “Skip Target” or Employ DSV.
• High Priority – Employ DSV before Requesting Delay or Clicking “Skip Target”
Auditory secondary task: As a secondary workload task, participants were instructed to monitor a recording of continual air traffic radio chatter for the word “Push.” The word “Push” occurred 62 times in a 30 minute session, with an average of 27 seconds between each “Push” radio call. To acknowledge the radio call, participants clicked an “Acknowledge Push” button on the display.
Task priorities: The operator was given the following as the primary objective for each mission: Make sure the UAV(s) maximize the number of targets engaged as well as arrive back at the base safely.
Further, supervision of each of the UAV(s) for each mission was broken down into the following prioritized sub-tasks, from highest priority to lowest:
1. Return to base (RTB) within the time limit for the mission (this limit was clearly marked).
2. Comply with recovery rules for course deviations. 3. Comply with recovery rules for target late arrivals.
4. Destroy all targets before their time on target (TOT) window ended. 5. Avoid taking damage from enemies by avoiding all threat areas. 6. Acknowledge all “Push” radio calls.
Participants were trained to follow these priorities, and the objectives and priorities above were displayed to them throughout the experiment. Within the priorities, recovery rules of how to recover the UAV from a course deviation or late arrival were also displayed.
Haptic Feedback
Continuous feedback for late target arrivals: The pressure vest inflated with the number of air bladders filled proportional to the target priority, and stayed on until the participant responded to the late arrival. Each air bladder inflated to 20 psi. There were two sets of air bladders, with a total of eight bladders (Figure 5). Each set contained four bladders. Four (top most two in each set), six (top most three in each set), and eight (all) bladders were filled for low, medium, and high priority targets, respectively. The bladders stayed inflated until the operator addressed the
9
issue with corrective action or the issue disappeared because the UAV has continued to the next target.
Threshold feedback for late target arrivals: The pressure vest inflated for late arrivals and stayed on for 2000 ms including the time it took to pump up the bladders to 20 psi. All eight bladders were filled for 2000 ms, independent of target priority.
Continuous feedback for course deviations: The wristband buzzed continually throughout the experiment and the buzzing intensified as the UAV deviated further off course. The motors always buzzed at their nominal 100 Hz frequency, and were always turned on for 300ms for a given activation. As course deviation increased, the number of activated motors increased and the amount of time that passed between each activation (i.e., gap time) was decreased. The number of motors turned on and the duration between activations were dynamically mapped to the course deviation parameter defined in MAUVE as degrees off the course (Figure 8). For example, at a very low course deviation (e.g., “3 degrees” in MAUVE), a single motor would buzz (at 100 Hz) for 300 ms approximately every 6 seconds. When the deviation increased to nine degrees, three motors were activated, and the length of time between activations was 2.5 seconds. 0 1 2 3 4 5 1 3 5 7 9 11 13 15 17 19
Deviation (degrees off course)
N u m b e r o f M o to rs A c ti v a te d
Figure 8. Number of motors activated and gap time between each activation as a function of UAV course deviation.
Threshold feedback for course deviations: When a UAV deviated from its course by 10 degrees, all five motors on the wristband turned on for 600 ms at their nominal frequency of 100 Hz. Falling below the threshold and rising past it again caused another activation of the motors.
Experimental Design
The independent variable of interest was haptic feedback type, which had two levels: continuous (continuous course deviation and continuous late arrival), and threshold (threshold course deviation and threshold late arrival). The experiment was a single factor repeated measures design. That is, each participant completed both the continuous and the threshold feedback
0 2 4 6 8 10 12 14 16 18 20 22 1 3 5 7 9 11 13 15 17 19
Deviation (degrees off course)
G a p T im e ( s e c )
10
conditions. The order of presentation for the two conditions was counterbalanced and randomly assigned to participants.
While the experiment conducted by Graham & Cummings (2007) included a factor that varied number of UAVs under control (from 1 to 4), the current experiment focused on the 4 vehicle condition, which represents the higher workload situation.
Dependent Variables
Dependent variables included the number of missed course deviations, reaction time to correct course deviations, number of missed late arrivals, reaction time to correct projected late arrivals, NASA TLX scores, and the number of acknowledged radio calls.
In each test scenario, participants were expected to respond to four triggered course deviations and four late target arrivals. Anytime the participant failed to respond to one of four triggered course deviations, an error of omission was counted. Similarly, errors of omission for late arrivals occurred when the participant failed to respond to one of the four triggered late arrivals. Primary task performance was assessed using errors of omissions for and reaction times to course deviations and late target arrivals.
The number of push call responses was analyzed to assess participants’ secondary task engagement. Subjective workload was assessed using NASA Task Load Index. The NASA Task Load Index gathered participants’ subjective assessment on a scale of 1 to 20 of mental demand, physical demand, temporal demand, effort, performance, and frustration. A participant was then asked to rate these six dimensions against each other to determine their importance in the participant’s workload (Hart & Staveland, 1988). Since there was no physical demand in this experiment, each participant was told to rate the physical demand so that it was zeroed out of the score.
Procedure
Each participant experienced three separate consecutive phases in completing the experiment. Each had a 60 to 70 minute training session followed by a 70 to 80 minute test session, and then a 10 minute post-test survey. For the training session, each participant completed a demographics survey, received standardized training from a PowerPoint® tutorial, and a thirty minute practice test session with a trial run through of NASA TLX. If required, a participant could do an additional 10 minute practice session to ensure understanding of the proper MAUVE control actions.
Before each feedback condition, the participants were presented with a demonstration of how the specific feedback worked, and hence were exposed to all the haptic feedback they would feel in a test session. They were presented with their respective late arrival and course deviation alerts, as well as the radio chatter.
After the training was completed, each participant then completed both the continuous and threshold feedback conditions in two separate test session. At the conclusion of every test session, MAUVE generated a data log, with all the previously discussed dependent variables.
11
Additionally, participants completed a NASA TLX following each test session. At the conclusion of the test session, participants completed a post-test survey, and were thanked for their time and involvement.
R
ESULTSFor statistical analysis, a repeated measures ANOVA was conducted on dependent variables. Normality and homogeneity of variances assumptions were checked. As mentioned above, there were four course deviations and four late arrivals in each condition. The average reaction times were analyzed for both course deviations and late arrivals.
Course Deviations
Out of the 92 course deviations presented to the 12 participants, only 1 was missed. This miss was in the threshold condition. Figure 9 shows the means for the course deviation reaction times for the two haptic feedback conditions. Continuous haptic feedback resulted in an estimated 2.46 sec faster course deviation reaction time than threshold feedback (t(21) = -4.1, p = 0.0005, 95% CI = -3.70, -1.21). 6 7 8 9 10 11 12 13 Continuous Threshold Haptic Feedback Type
C o u rs e D e v ia ti o n R e a c ti o n T im e (s e c )
Figure 9: Course deviation reaction times (means and standard error bars).
Late Arrivals
All participants responded to all of the 4 late arrivals presented, thus there were no late arrival errors of omission.
For late arrival reaction times, out of the 92 late arrival data points, five outliers had to be removed from the analysis, which were more than three standard deviations away from the mean.
12
These values were between 34 and 42 seconds, which indicated that the participants’ actions were not in response to initiation of feedback. Four of these outliers were in threshold feedback condition and one was in continuous feedback condition. Continuous feedback was supposed to stay on until the participant responded to the late arrival. The outlier response during the continuous feedback and the two of the outlier responses during threshold feedback belonged to one participant. This participant indicated that he could not feel the inflation of the pressure vest very well in general, and also noted that the vest did not inflate for the first late target arrival in the threshold condition (this corresponded to one of the outlier responses). The two other outlier responses observed during the threshold condition belonged to two different participants. For one of these participants, the experimenter observed that the vest took longer time inflating/deflating than normal. The cause of the other outlier response is unclear, but may also be a vest malfunction.
Threshold haptic feedback resulted in an estimated 1.74 sec faster late arrival reaction time than continuous feedback (t(21) = -2.51, p = 0.02, 95% CI = -3.18, -0.30). Figure 10 shows the means for the late arrival reaction times for the two haptic feedback conditions.
3 3.5 4 4.5 5 5.5 6 6.5 7 7.5 Continuous Threshold
Haptic Feedback Type
L a te A rr iv a l R e a c ti o n T im e ( s e c )
Figure 10: Late arrival reaction times (means and standard error bars).
Secondary Task Engagement and Subjective Workload
The difference between continuous and threshold feedback types was not significant for the number of push call responses (t(18) = 1.98, p = 0.22), as well as for NASA TLX scores (t(21) = 0.26, p = 0.8) (Figure 11).
13 45 47 49 51 53 55 Continuous Threshold
Haptic Feedback Type
N u m b e r o f P u s h C a ll R e s p o n s e s
Figure 11: Number of push call responses and subjective workload (means and standard error bars).
Post-test Feedback
Almost all participants thought that the haptic cues helped them in responding to both late arrivals as well as course deviations. Some even said that they depended on haptic as the primary source of identifying an off-nominal state. These participants waited for the haptic feedback and then confirmed the need for an action visually. The haptic feedback was perceived to be useful, especially for course deviations since the farthest off-course UAV was always highlighted in red and visual information alone was not enough to determine if the course deviation required action. Despite the general positive attitude towards haptic feedback, there were also concerns about operator annoyance with prolonged use of these haptic feedback devices.
As for the pressure vest, the majority of participants thought that the differential inflation based on target priority was not as informative as simply the inflation of the vest. Most said that feedback was very salient but the differences between target priorities were indistinguishable. Participants, in general, suggested keeping the vest inflated until the late arrival was addressed. However, one participant also suggested adding pulses to the inflated vest, since they felt that if they did not attend to the late arrival as soon as they got feedback, they may forget to do so. There were two participants who found the pressure vest to be cumbersome. One of these participants indicated that he did not feel the inflation as much as he noticed vibrations on the wristband.
Most participants preferred the threshold feedback for the wristband. Participants in general did not like the continual buzzing; some even felt that they responded slower with this type of feedback. However, some still thought that the change in the intensity of buzzing did help indicate how far off course they were. A suggestion received from multiple participants was to design the wristband to not continually buzz, but still have a gradient buzz after a threshold course deviation point was exceeded. As mentioned before, all participants wore the wristband on their right hands. One participant suggested wearing the wristband on their non-dominant hand. 25 27 29 31 33 35 37 Continuous Threshold
Haptic Feedback Type
W o rk lo a d ( N A S A T L X )
14
D
ISCUSSIONA pilot experiment was conducted to evaluate continuous peripheral haptic feedback for supporting multiple UAV supervisory control. The results of this experiment showed that continuous haptic feedback promoted better performance for course deviations, whereas threshold haptic feedback resulted in better performance for late target arrivals. In general, workload and secondary task engagement did not differ between the two feedback types.
This pilot study suggests that continuous haptic feedback can be a promising way to help single operators supervise multiple semi-autonomous vehicles. The preliminary results indicate that a threshold haptic alert is more effective for tasks that require monitoring discrete events (e.g., late arrival to a target), whereas a continual alert is more appropriate for tasks that require monitoring events that are continuous in nature (e.g., monitor how well a UAV keeps its course). Graham & Cummings (2007) also found that continuous auditory feedback resulted in faster response to course deviations when compared to discrete auditory feedback. They also found that discrete feedback resulted in slowest response to late target arrivals when accompanied with continuous feedback on course deviations, which was attributed to a possible masking effect.
In this study, continuous course deviation alert was presented with continuous late arrival alert, and threshold course deviation alert was presented with threshold late arrival alert. It is unclear how continuous and discrete haptic feedback would interact in supporting operator response. For example, a combination of continuous course deviation and threshold late arrival alerts can free more perceptual/mental resources, and/or enable the operator to better timeshare between the two supervisory tasks by supporting task switching. The current study was not designed to assess the interacting effects of continuous and discrete haptic feedback, and further research is needed to understand how different feedback types interact in aiding supervisory control. Moreover, Graham & Cummings (2007) used only one device delivering feedback (i.e., headphones), whereas in the current experiment, there was a separate feedback device for the two different monitoring tasks (i.e., wristband for course deviations, and pressure vest for late arrivals). Therefore, the type of device which provides feedback may also influence results. These feedback types should be tested in more detail to detangle the effects of feedback type from the effects of feedback device. In addition, further testing with a combination of haptic and audio alerts is warranted to determine the best alerting architecture.
An additional interesting finding in this study was the mismatch between participants’ subjective responses and actual performance for course deviations. Participants in general liked the threshold feedback for course deviations, and some even said that continuous feedback undermined their performance. Even if the continual buzzing of the wristband was annoying to the participants, they still performed better with continuous feedback. It is unclear how operators’ acceptance of these alerts would change performance with long term use. Acceptance of an alert has an important influence on the use and hence the effectiveness of it (Donmez, Boyle, Lee, & McGehee, 2006), but effectiveness may also guide perceived usefulness and therefore acceptance. For example, low acceptance observed in this study may lead to disuse of the alerts in the long term, and result in degraded performance. On the other hand, if operators realize that their performance, in fact, improves with the alert, then they may accept the alerts more. Future research should address how operators would adapt to these alerts with long term
15
use. In this study, most of the participants liked the gradient buzzing of the continuous feedback. Therefore, one possible way to make the vibrating wristband more acceptable and still keep its benefits to performance may be to design the wristband to not continually buzz, but have a gradient buzz after a threshold course deviation point is exceeded.
Comments from the participants were generally positive about having haptic cues complement the visual display. Some participants even said that they used the haptic cues as the primary agent to identify an off-nominal UAV state, and did the visual check only after they received a haptic feedback. The positive attitude towards these feedback types is promising for operator acceptance, but also is concerning especially if operators start depending on feedback inappropriately. With such an overreliance on feedback, system failures can lead to hazardous situations that may not occur otherwise.
Even if the positive subjective responses seem to indicate that the operators would benefit from haptic feedback in general, the lack of a baseline condition in this experiment (i.e., no feedback) makes it hard to make such a claim. This experiment focuses on comparing continuous haptic feedback to discrete haptic feedback. In order to assess the true benefits of haptic feedback, baseline data should be collected where participants perform the same tasks without the assistance of feedback. Moreover, a direct comparison between auditory and haptic feedback is also needed. A future study focusing on these issues with a more representative participant population can provide better insights into how peripheral feedback can be implemented in UAV supervisory control.
A
CKNOWLEDGEMENTSThis research is sponsored by the United States Army through a Small Business Innovation Research lead by Charles River Analytics, Inc. The views and conclusions presented in this paper are those of the authors and do not represent an official opinion, expressed or implied, of the United States Army or Charles River Analytics, Inc. Special thanks is extended Brian Malley, the undergraduate assistant, who helped with data collection.
R
EFERENCESBurke, J. L., Prewett, M. S., Gray, A. A., Yang, L., Stilson, F. R. B., Coovert, M. D., et al. (2006). Comparing the effects of visual-auditory and visual-tactile feedback on user performance: a meta-analysis. In Proceedings of the 8th international conference on
multimodal interfaces (pp. 108-117).
Culbertson, E. (2006). COMUSAFE: unmanned aircraft key to future decision superiority. Retrieved March 18, 2008, from http://www.af.mil/news/story.asp?id=123029520
Donmez, B., Boyle, L., Lee, J. D., & McGehee, D. (2006). Drivers' attitudes towards imperfect distraction mitigation strategies. Transportation Research Part F: Psychology and
16
Graham, H. D., & Cummings, M. L. (2007). Assessing the impact of auditory peripheral displays
for UAV operators (No. HAL2007-09): Humans and Automation Laboratory, MIT.
Hart, S., & Staveland, L. (1988). Development of the NASA-TLX: Results of empirical and theoretical research. In P. A. Hancock & N. Meshkati (Eds.), Human mental workload (1 ed., pp. 139-183). Amsterdam: North Holland.
Osga, G., Van Orden, K., Campbell, N., Kellmeyer, D., & Lulue, D. (2002). Design and
evaluation of warfighter task support methods in a multi-modal watchstation (No. 1874): SPAWAR, San Diego.
Schumann, J., Godthelp, H., Farber, B., & Wontorra, H. (1993). Breaking up open-loop steering control actions the steering wheel as an active control device. In A. G. Gale (Ed.), Vision
in Vehicles IV (pp. 321-332). North-Holland, Amsterdam.
Sklar, A. E., & Sarter, N. B. (1999). Good vibrations: Tactile feedback in support of attention allocation and human-automation coordination in event-driven domains. Human Factors,
41(4), 543-552.
Suzuki, K., & Jansson, H. (2003). An analysis of driver's steering behaviour during auditory or haptic warnings for the designing of lane departure warning system. JSAE Review, 24, 65-70.
Whitney, R. (2007). Air Force stands up first unmanned aircraft systems wing. Retrieved March 18, 2008, from
http://www.spacewar.com/reports/Air_Force_Stands_Up_First_Unmanned_Aircraft_Syst ems_Wing_999.html
A
SSESSING THE
I
MPACT
OF
A
UDITORY
P
ERIPHERAL
D
ISPLAYS FOR
UAV
O
PERATORS
H.D. Graham
M.L. Cummings
M
ASSACHUSETTS
I
NSTITUTE OF
T
ECHNOLOGY
*
P
REPARED
F
OR
C
HARLES
R
IVER
A
NALYTICS
,
I
NC
.
HAL2007-08
N
OVEMBER
2007
*MIT Department of Aeronautics and Astronautics, Cambridge, MA 02139
Table of Contents
ABSTRACT...1
INTRODUCTION... 2
BACKGROUND... 2
THE MAUVESIMULATOR... 3 SONIFICATION DESIGN AND INTEGRATION... 5
EXPERIMENTAL PROTOCOL... 6 Experiment Objective... 6 Research Hypothesis ... 6 Task ... 7 Independent Variables ... 8 Dependent Variables... 8 Apparatus... 9 Participants... 10 Procedure... 11 RESULTS... 12 DISCUSSION... 16 CONCLUSION... 18 ACKNOWLEDGEMENTS...18 REFERENCES...19
APPENDIX A COURSE DEVIATION AND LATE ARRIVAL IMAGES...20
APPENDIX B SCENARIO EVENTS...21
APPENDIX C PARTICIPANT CONSENT FORM...23
APPENDIX D DEMOGRAPHICS SURVEY...26
APPENDIX E MAUVE-MITUS TUTORIAL...28
APPENDIX F POST-EXPERIMENT SURVEY...36
List of Figures
Figure 1: Multiple Autonomous Unmanned Vehicle Experimental (MAUVE) test bed. ... 4 Figure 2: Sensimetrics HDiSP. ... 5 Figure 3: The Multi-Modal Workstation (MMWS)... 10 Figure 4: The treatment means plots for the course deviations reaction times... 13 Figure 5: The treatment means plots for the two alert conditions for the course deviations reaction times. ... 14 Figure 6: The treatment means plots for the transformed (LN) late arrival reaction times. ... 15 Figure 7: The box plots of the number of missed radio calls... 16
List of Tables
Table 1: UAV Color-Coded Flight Phases ... 4 Table 2: Experimental Design. ... 8 Table 3: Summary of experiment statistical results... 12 Table 4: Post Hoc Audio Alert Experimental Design... 13
1
A
BSTRACTA future implementation of unmanned aerial vehicle (UAV) operations is having a single operator control multiple UAVs. The research presented here explores possible avenues of enhancing audio cues of UAV interfaces for this futuristic control of multiple UAVs by a single operator. This project specifically evaluates the value of continuous and discrete audio cues as indicators of course deviations or late arrivals to targets for UAV missions. It also looks at the value of the audio cues in single and multiple UAV scenarios.
To this end, an experiment was carried out on the Multiple Autonomous Unmanned Vehicle Experimental (MAUVE) test bed developed in the Humans and Automation Laboratory at the Massachusetts Institute of Technology with 44 military participants. Specifically, two continuous audio alerts were mapped to two human supervisory tasks within MAUVE. One of the continuous audio alerts, an oscillating course deviation alert was mapped to UAV course deviations which occurred over a continual scale. The other continuous audio alert tested was a modulated late arrival alert which alerted the operator when a UAV was going to be late to a target. In this case the continuous audio was mapped to a discrete event in that the UAV was either on time or late to a target. The audio was continuous in that it was continually on and alerting the participant to the current state of the UAV. It either was playing a tone indicating the UAV was on time to a target or playing a tone indicating the UAV was late to a target. These continuous alerts were tested against more traditional single beep alerts which acted as discrete alerts. The beeps were discrete in that when they were used for monitoring course deviations a single beep was played when the UAV got to specific threshold off of the course or for late arrivals a single beep was played when the UAV became late.
The results show that the use of the continuous audio alerts enhances a single operator’s performance in monitoring single and multiple semi-autonomous vehicles. However, the results also emphasize the necessity to properly integrate the continuous audio with the other auditory alarms and visual representations in a display, as it is possible for discrete audio alerts to be lost in aural saliency of continuous audio, leaving operators reliant on the visual aspects of the display.
2
I
NTRODUCTIONIn current military conflicts, the unmanned aerial vehicle (UAV) is one of the most highly sought after air assets (Whitney, 2007). UAVs provide real time information and support to battlefield operations remotely from either local or global control station platforms. Each of these operational environments presents fluid atmospheres of noise and activity.
Currently many of the medium and high altitude UAV operations require multiple operators to control a single UAV; the desire for the future is to invert the numbers and have a single operator controlling multiple UAVs (Culbertson, 2006). To achieve this, research is needed to understand how best to aid and integrate the human operator into a system of semi-autonomous UAVs. Due to potential information overload of operators in visually saturating domains such as UAV supervisory control, reducing the workload by offloading some cognitive processing to the other senses, primarily auditory and haptic, is critical. The point of this research is to explore possible auditory enhancements that can reduce operator workload and increase operator performance.
B
ACKGROUNDImproving UAV operator performance via audio enhancements has been an active area of research, particularly in the areas of spatial audio, which has been shown to aid UAV operators in target recognition, and 3D audio, which has been shown to enhance alert and warning detection (for a review of the literature, see (Nehme & Cummings, 2006)). One area in the audio domain that has received less attention is the use of continuous audio peripheral displays, particularly in complex, time pressured domains such as UAV operation in command and control settings.
Research in the medical domain indicates that continuous auditory displays (also known as sonifications) can aid anesthesiologists in monitoring patient status (Watson & Sanderson, 2004). Deviations from normal breathing patterns matched to musical notes allowed doctors to aurally detect a difference in patient status, while visually focusing on other tasks. Given that such an approach has worked in this medical monitoring domain, it is not clear whether continuous auditory displays can be applied to a command and control setting, particularly for the supervisory control of one or more unmanned vehicles by a single operator.
While continuous audio displays can allow operators to effectively divide attention so that disparate information can be taken in through different channels (such as visual and aural), the environment plays a major role. In the case of the anesthesia study, operating rooms are generally not as noisy as those settings typically found in command and control environments. For example, Shadow UAV operators must work in the back of a truck with significant noise due to nearby generators. In addition, unlike an operating room, UAV operators wear headsets so that they can communicate with both inter and intra team members. Also unlike the operating room, which may be connected to an intercom in another room, there is significant communication coming into UAV operators from the outside world. UAV operators must contend with an air traffic control-like environment, constantly scanning the audio landscape for possible incoming
3
communications, as well as listening to general radio chatter in order to gain situational awareness for the overall mission.
Given these significant UAV environmental constraints, which are tantamount to noisy working conditions, the design of an audio display, particularly a continuous one, is difficult. Moreover, a sonification should map to the task, i.e. perceptual changes should accurately match the change in the data (Barrass & Kramer, 1999). Thus, discrete events should map to discrete signals, and continuous events should map to a continuous auditory display. In addition, in high workload environments, whether sonifications can improve performance, or whether operators will ignore the auditory displays and rely primarily on the visual, is not clear. In order to investigate these issues, an experiment was conducted which is detailed in the remainder of the paper.
T
HEMAUVE
S
IMULATORThe Massachusetts Institute of Technology’s Humans and Automation Laboratory (HAL) developed the Multiple Autonomous Unmanned Vehicle Experimental (MAUVE) test bed, which is a two screen interface that allows the simulation of any number of unmanned vehicles conducting strike operations in hostile environments. MAUVE, for this experiment, allowed the operator to arm and fire on targets with various priorities while monitoring each UAV’s flight of path, event timeline, and radio traffic.
The test bed provided a map for geo-spatial tracking of UAVs on their preset flight paths along with an interaction control panel for making UAV control inputs (Map Display, Figure 1). Control inputs included arming and firing a UAV to destroy targets, directing specific path changes, and acknowledging radio calls. The path changes included commanding a UAV to skip a target to get a UAV back on schedule. The operator could also reset the UAV’s onboard navigation to get the vehicle back on course if it drifted.
A timeline for each UAV, a scheduling decision support tool for each UAV, and chat interfaces were also provided (Timeline Display, Figure 1). This display helped operators ensure UAVs would be on time to targets by monitoring when they would arrive at targets, and in what phase they were currently located. In particular, the timeline used the color-coding provided in Table 1 to represent phase of flight.
4
Figure 12: Multiple Autonomous Unmanned Vehicle Experimental (MAUVE) test bed.
Table 1: UAV Color-Coded Flight Phases
UAV Action Color
Enroute Gray
Loitering Blue
Arming Payload Yellow
Firing Payload Orange
Return to Base Green
The general task for MAUVE operators for this experiment was to monitor one or more UAVs on a preplanned mission involving several waypoints and targets. The primary task of the operator was to ensure weapons were dropped on the correct targets during the specified windows of opportunity. However, unexpected head winds or crosswinds could cause UAVs to slow their speed or drift off course, requiring the operator to take corrective action for projected target late arrivals or course deviations. Late arrivals were a higher priority than course deviations. In addressing late arrivals, the priority of the target (high, medium, or low) also had to be addressed, such that it was more important to hit a high priority target than a medium priority target, and so on. In addition, operators also had to ensure the UAVs would return to base by a specified time.
5
S
ONIFICATIOND
ESIGN ANDI
NTEGRATIONFour auditory alerts were created by Charles River Analytics, Inc. for incorporation into MAUVE, which represent experimental independent variables. These four auditory alerts were the 1) threshold course deviation alert, 2) the oscillating course deviation alert, 3) the threshold late arrival alert, and 4) the modulated late arrival alert. These four auditory alerts were designed to test the differences between discrete and continuous alarms for the two conditions of late arrivals and course deviations. The threshold alerts were designed to be discrete alarms; they emitted a single discrete audio alert when some precondition was met. The oscillating and modulated alerts were designed to be continuous alarms; they provided continual audio information about the state of a particular variable within MAUVE. Instead of indicating a clear distinct threshold, the continuous and modulating alerts gradually increased as the severity of either the late arrival or course deviation condition increased.
The threshold course deviation alert consisted of a single beep with a fundamental frequency of 1000 Hz. The beep lasted ~8 ms and played whenever a UAV moved completely away from its plotted course line.
The oscillating course deviation alert represented both the existence and severity of the UAV course deviations. It consisted of comb filters that were applied to a mix of pink noise and the ambient signal. Using pink noise means that filters equalized the energy of sound at each octave level, resulting in a constant level presentation of the audio. The mix ranged from 0.2 pink noise for low deviation to 0.9 pink noise for high deviation. The comb filters had a base delay of 0.2 ms, with a 50 percent each mix of the base signal and a feed forward delay. The delay values were then oscillated to create a periodic signal. Because this was a continuous audio scheme, it played continually to provide an auditory image of UAV path position. As a UAV drifted further off course, the frequency of oscillation of the comb filter delay decreased from 17 Hz to 4.5 Hz, and the depth of oscillation increased from 0.2 ms to 0.7 ms, thus changing on a continual scale. The threshold late arrival alert consisted of a single beep with a fundamental frequency of 415 Hz. The beep lasted ~18 ms, and played whenever a UAV was projected to be late to any target. A UAV was determined late to a target when it had exceeded its window of opportunity to destroy the target and was not going to be able to get over the target in time to fire on the target during the set time window it was required to be at the target.
The modulated late arrival alert consisted of discrete harmonic signals continuously playing to indicate when a projected late arrival at a target. These sounds played continually until the operator addressed the issue with the corrective action of choosing to delay the UAV, skip a target, or the issue disappeared because the UAV automatically continued past the target when it was going to be late to the next target. The harmonic signals were composed of five Formant filters that were applied to a mix of pink noise and the ambient signal. During the condition of no late arrivals, a baseline audio condition was generated with two filters set to 261.6 Hz, two filters set at 329.4 Hz, and one filter set at 392.0 Hz (a major C triad with extra balance in the root and third). If it was late to a low priority target, a signal was generated with two filters set to 261.6 Hz, two filters set at 311.1 Hz, and one filter set at 392.0 Hz (a minor C triad with extra balance in the root and third). If it was late to a medium priority target, a signal was generated with three filters set to 293.6 Hz and two filters set at 415.3 Hz (a tritone interval with a D root). If the
6
UAV was predicted to be late to a high priority target, a signal was generated with three filters set to 369.9 Hz and two filters set at 523.25 Hz (a tritone interval with an F# root). As the priority increased, the pink noise mix also increased, from 0.25 for the baseline, to 0.7, 0.8, and 1.0 for the three priority levels.
All audio alerts were presented equally in both ears through the Sensimetrics HDiSP. Pictured in Figure 3, the HDiSP is an over-the-head headset with sealed around-the-ear ear cups. It provides ambient noise attenuation ranging from 35 to 40 db for the spectrum between 500 and 8 kHz. The headset has integrated digital signal processors, which produce the signals used in this experiment based on generative audio filters and processing of the ambient signal, which was received from microphones mounted on the headband.
Figure 13: Sensimetrics HDiSP.
E
XPERIMENTALP
ROTOCOLExperiment Objective
The objective of this experiment was to determine whether sonifications maximize the information conveyed to UAV operators more efficiently than typical discrete alarms typically used in current ground control stations. In addition, the impact of continuous versus discrete alerting on operators attempting to control multiple UAVs was also a research question.
Research Hypothesis
There were three null hypotheses explored in this research:
1. For various combinations of discrete and continuous alerts, there was no difference in the operator’s performance.
2. For operators controlling either a single or multiple UAVs, there was no difference in the operator’s performance.
3. There was no interaction between the discrete and continuous alerts combinations and whether the operator was controlling one or more UAVs.
7
The alternative hypotheses for the first two null hypotheses, therefore, were that there is a difference, and for the third null hypothesis, that there was interaction.
Task
For this experiment, the operator was given the following as the primary objective for each mission:
Make sure the UAV(s) maximize the number of targets engaged as well as arrive back at the base safely.
Further, supervision of each of the UAV(s) for each mission was broken down into the following prioritized sub-tasks, from highest priority to lowest:
7. Return to base (RTB) within the time limit for the mission (this limit was clearly marked).
8. Comply with recovery rules for course deviations. 9. Comply with recovery rules for target late arrivals.
10. Destroy all targets before their time on target (TOT) window ended. 11. Avoid taking damage from enemies by avoiding all threat areas. 12. Acknowledge all “Push” radio calls.
Participants were trained to follow these priorities, and the objectives and priorities above were displayed to them throughout the experiment. Within the priorities, recovery rules of how to recover the UAV from a course deviation or late arrival were also displayed. See Appendix A for a description of a course deviation or late arrival. The instructions on how to comply with recovery rules for course deviations were to click “Reset Navigation.” This theoretically reset the onboard navigation in the UAV and caused it to fly back to the planned flight path.
The instructions on how to comply with recovery rules for target late arrivals were: • Low Priority – Click “Skip Target”
• Medium Priority – Click “Skip Target” or Employ the decision support visualization (DSV).
• High Priority – Employ DSV before Requesting Delay or Clicking “Skip Target”
For low priority targets, clicking the “Skip Target” button would cause the UAV to proceed immediately to the next target. For medium and high priority targets, the option was given to use the DSV, which was a tool that illustrated the effect that delaying the time on target for the one late target had on the remaining targets for that UAV’s flight plan. With the assistance of the information presented in the DSV, participants then decided whether they should click the “Skip Target” button or “Request Delay” button. If they clicked “Request Delay,” they then had to wait to see if a delay was granted, and if the delay was granted the UAV was then no longer late to the target and would be able to destroy it. For a high priority target the immediate response was to employ the DSV.
8
Independent Variables
The experiment was a 4x2 fixed factor repeated measures model, with two independent variables: the audio condition (a between-subjects treatment), and the number of vehicles under control (a repeated within-subjects factor). The four levels of the audio condition factors were combinations of the four auditory alerts described earlier. The audio conditions were: 1) the threshold audio condition for both the late arrivals and course deviations, 2) the continuous oscillating course deviation audio condition with threshold alerts for the late arrivals, 3) the continuous modulated late arrival audio condition with a threshold alert for course deviations, and 4) the combination audio condition which consisted of the oscillating course deviation alert and the modulated late arrival alert.
The second independent variable, the number of vehicles under control, had two levels: single UAV and multiple UAV. In the single level, the participant supervised only one UAV, while in the multiple factor level, the participant supervised four UAVs. The framework of this experiment is represented in Table 2.
Table 2: Experimental Design.
Scenario (Repeated)
Single UAV Multi UAV
Both Threshold -- --
Continuous Course Deviation, Threshold Late Arrival -- -- Continuous Late Arrival, Threshold Course Deviation -- --
Audio Scheme (Between)
Combination -- --
Dependent Variables
Dependent variables included the reaction time to correct course deviations, the number of missed course deviations, the reaction time to correct projected late arrivals, the number of missed late arrivals, NASA TLX scores, and number of missed radio calls. These are discussed in detail below.
1. Course deviation reaction time
In each test scenario, participants were expected to respond to four triggered course deviations. A course deviation was defined as when a UAV no longer appeared to be following its planned flight path. A general rule for defining a course deviation was a UAV that no longer appeared over the flight path’s line or a UAV completely left the flight path.
9 2. Course deviation errors of omission
Anytime the participant failed to respond to one of four triggered course deviations, an error of omission was counted.
3. Late arrival reaction time
Four late arrivals occurred in each test scenario. Late arrivals were caused when a UAV slowed down because of unforeseen headwinds and was no longer able to reach a target in time to complete the firing mission.
4. Late arrival errors of omission
Errors of omission for late arrivals occurred when the participant failed to respond to one of the four triggered late arrivals.
5. Radio calls missed (secondary workload assessment)
As a secondary workload task, the number of missed radio was an indication of the operator’s level of mental workload. The count of missed radio calls measured spare mental capacity. Participants were instructed to monitor a recording of continual air traffic radio chatter for the word “Push.” The word “Push” occurred 62 times in a 30 minute session, with an average of 27 seconds between each “Push” radio call. To acknowledge the radio call, participants clicked an “Acknowledge Push” button on the display.
6. NASA TLX score (subjective workload assessment)
The NASA Task Load Index gathered participants’ subjective assessment on a scale of 1 to 20 of mental demand, physical demand, temporal demand, effort, performance, and frustration. A participant was then asked to rate these six dimensions against each other to determine their importance in the participant’s workload (Hart & Staveland, 1988). Since there was no physical demand in this experiment, each participant was told to rate the physical demand so that it was zeroed out of the score. No difference between the single and multiple UAV scenario was expected because the scenarios were designed with equal workloads. Appendix B shows how the single and multiple UAV scenarios were designed with the same events. The only difference was that the multiple UAV scenario has the events divided over 4 UAVs while the single scenario has them all occurring with 1 UAV.
Apparatus
The experiment was administered in a testing room with a background ambient noise level of ~64dB on a C-scale. MAUVE was run on a multi-modal workstation (MMWS). Pictured in Figure 2, the MMWS is a four screen computer display.
10
Figure 14: The Multi-Modal Workstation (MMWS).
The three screens across the top were 21 inches and set to display at 1280 x 1024 pixel, 16 bit color resolution, and the 15 inch bottom center screen was set at 1024 x 768 pixels, 32 bit color resolution. The computer used to run the simulator was a Dell Optiplex GX280 with a Pentium 4 processor and an Appian Jeronimo Pro 4-Port graphics card. Participants controlled the simulator through a generic corded computer mouse. Throughout the experiment, the top left display showed the mission objectives and priorities, and the bottom center displayed the color-coding for MAUVE (Table 1). The top center display contained the left MAUVE map and interaction display, and the top right display included the right MAUVE timeline and decision support display (Figure 1). During the test sessions, the screen recordings for the left and right MAUVE displays were captured by Camtasia ® recording software.
Participants
Forty-four military personnel were paid $10 an hour to participate. The experiment took anywhere from 2.5 to 3 hours to complete. Participants’ ages ranged from 20 years to 42 years, with an average age of 26 years. There were 3 Navy midshipmen, 1 Army reservist specialist, 1 Air Force staff sergeant, and 39 officers from the Army/Navy/Air Force. Overall, the personnel tested had a combined experience of over 250 years of active duty military service, with each member having an average of 5.8 years of active duty service. Five pilots contributed as test participants, and most of the 28 junior officers tested will be future military pilots.
For the data analysis, 5 participants were dropped because of problematic data. The first two were omitted because of the failure of the test proctor to administer proper training. The third was dropped because of a 3 day interruption between the single and multiple UAV test sessions. The fourth participant was not used because his secondary data was an outlier for both the single and multiple UAV scenarios. The fifth participant dropped was an active duty Air Force lieutenant colonel with 4 years experience as a maintenance officer and an additional 4 years of


![[PDF] Cours Fortran : Procédures, Modularité et Fichiers | Formation informatique](data:image/gif;base64,R0lGODlhAQABAIAAAP///wAAACH5BAEAAAAALAAAAAABAAEAAAICRAEAOw==)