Publisher’s version / Version de l'éditeur:
Thermochimica Acta, 440, January 2, pp. 132-140, 2006-01-15
READ THESE TERMS AND CONDITIONS CAREFULLY BEFORE USING THIS WEBSITE.
https://nrc-publications.canada.ca/eng/copyright
Vous avez des questions? Nous pouvons vous aider. Pour communiquer directement avec un auteur, consultez la première page de la revue dans laquelle son article a été publié afin de trouver ses coordonnées. Si vous n’arrivez pas à les repérer, communiquez avec nous à [email protected].
Questions? Contact the NRC Publications Archive team at
[email protected]. If you wish to email the authors directly, please see the first page of the publication for their contact information.
NRC Publications Archive
Archives des publications du CNRC
This publication could be one of several versions: author’s original, accepted manuscript or the publisher’s version. / La version de cette publication peut être l’une des suivantes : la version prépublication de l’auteur, la version acceptée du manuscrit ou la version de l’éditeur.
For the publisher’s version, please access the DOI link below./ Pour consulter la version de l’éditeur, utilisez le lien DOI ci-dessous.
https://doi.org/10.1016/j.tca.2005.11.001
Access and use of this website and the material on it are subject to the Terms and Conditions set forth at
Melting and glass transitions in paraffinic and naphthenic oils
Masson, J-F.; Polomark, G. M.; Bundalo-Perc, S.; Collins, P.
https://publications-cnrc.canada.ca/fra/droits
L’accès à ce site Web et l’utilisation de son contenu sont assujettis aux conditions présentées dans le site LISEZ CES CONDITIONS ATTENTIVEMENT AVANT D’UTILISER CE SITE WEB.
NRC Publications Record / Notice d'Archives des publications de CNRC:
https://nrc-publications.canada.ca/eng/view/object/?id=df4ec3e8-044d-4416-b91e-2d4633c76e8f https://publications-cnrc.canada.ca/fra/voir/objet/?id=df4ec3e8-044d-4416-b91e-2d4633c76e8f
http://irc.nrc-cnrc.gc.ca
N a t i o n a l R e s e a r c h C o u n c i l C a n a d a
M e lt ing a nd gla ss t ra nsit ions in
pa ra ffinic a nd na pht he nic oils
N R C C - 4 7 7 3 6
M a s s o n , J - F . ; P o l o m a r k , G . M . ;
B u n d a l o - P e r c , S . ; C o l l i n s , P .
A version of this document is published in / Une version de ce document se trouve dans :
Thermochimica Acta, v. 440, no. 2, Jan. 15, 2006, pp. 132-140
Melting and glass transitions in paraffinic and naphthenic oils
J-F. Masson*, G. M. Polomark, S. Bundalo-Perc, P. Collins
Institute for Research in Construction, National Research Council of Canada, Ottawa, Ontario, Canada, K1A OR6.
*To whom correspondence should be addressed. Phone: (613) 993-2144. Fax (613) 952-8102. e-mail: [email protected]
Abstract
Naphthenic and paraffinic oils were analyzed by modulated differential scanning
calorimetry (MDSC). The results showed several improvements in the analysis of
thermal properties when compared with standard DSC. The glass transition temperature
(Tg), the enthalpy relaxation at Tg, and the melting endotherms could be deconvoluted,
and reversible melting could be identified. This allowed for an easier interpretation of the
thermal properties of the oils. With MDSC, the Tgs in mineral oils were found to
coincide with endothermic enthalpy relaxation, which is generally regarded as a melting
endotherm with standard DSC. A decrease in heat capacity after Tg was attributed to the
existence of rigid amorphous material. From Δcp at Tg and the oil molecular weight, the
number of repeat units in the oil chains was estimated at less than 20. The Tg of a
hypothetical pure aromatic oil was found to be similar to that for petroleum asphaltenes,
and that for a naphthenic oil of infinite molecular weight to be similar to that of
petroleum resins.
Keywords: differential scanning calorimetry (DSC); modulated differential scanning
calorimetry (MDSC); hydrocarbons; naphthenic oils; paraffinic oils; bitumen; cold
1. Introduction
Mineral oils and paraffinic waxes are of great technological and economic
interest, partly because crystalline waxes can lead to an array of difficulties. For
instance, the crystallization of paraffins can lead to the clogging of pipelines during the
transportation of paraffinic crude oils [1]; in roadway bitumens, crystallization may
reduce the adhesion to aggregates [2]. Waxes also affect viscosity [3], thus limiting the
use of oils in many applications.
Since the late 60’s and early 70’s, thermal analysis, and differential scanning
calorimetry (DSC) in particular, has been used to characterize petroleum products
(readers familiar with petroleum derivatives, but unfamiliar with DSC, are referred to the
Glossary). DSC was used to study the glass transition temperature (Tg) and
crystallization in bitumen [4, 5], oils [6] and waxes [7]. Noel and Corbett [5] first
established that the Tg of bitumen depended on its source and that “waxy” and
“non-waxy” bitumens could be distinguished based on the DSC profiles. Upon heating, ““non-waxy”
bitumens were found to show exothermic cold crystallization and endothermic melting,
both of which were reported to arise from the lighter bitumen fraction, the saturates.
Giavarini and Pochetti [7] later observed two endotherms in paraffinic waxes, whereas
they observed a single broad endotherm in microcrystalline (non-paraffinic) waxes. It is
thus generally considered that endotherms in petroleum products arise from paraffins, or
alkanes. However, it was recently demonstrated that the endotherm size in DSC is not
necessarily proportional to the saturates content [8] and that the ordering of aromatic
DSC is commonly used to determine crystallinity because it is rapid and more
convenient than wet chemical methods that require solvents for the extraction of
crystallizing waxes. However, the DSC method consistently provides greater
crystallinity values than the wet chemical method [10]. The difference is usually
attributed to the crystallization of methylene segments in aromatic compounds not
extracted by solvents [10], but it could also arise from the overlap of underlying
transitions that enlarge the endotherm. Such transitions could be a second endotherm
from the isotropization of aromatic rings, organized in a meso-phase [9, 11], or a second
Tg [9].
The analysis of oils and petroleum products in general has yet to benefit from the
latest advances in DSC, namely modulated DSC (MDSC), which has been used
advantageously on some n-alkanes [12], bitumen [11] and its fractions [9]. In this paper,
MDSC is used to characterize naphthenic and paraffinic oils. The method resolves
overlapping transitions in these oils, including Tg, enthalpy relaxation, cold
crystallization and melting. It is shown, amongst other results, that melting enthalpies
from MDSC are smaller than those from standard DSC, which may help reconcile the
crystallinity measurements from calorimetry and other methods [10, 13].
2. Experimental Section
2.1 Materials and Methods
Three naphthenic and two paraffinic oils were obtained from Ergon Inc. of
Jackson, MS, USA. The composition and characteristics of the oils are shown in Table 1.
For MDSC, the heating and cooling experiments were performed between
–110 °C and 50 °C, at a linear heating or cooling rate of 3°C/min, a modulation period of 60s and a modulation amplitude of ±0.47 °C. The specific heat capacity at Tg was
measured from the area of the Tg peak on the derivative curve. Details are found
elsewhere [9, 11]. When the figures show an arrow on the abscissa, the curves were
shifted for easier comparison, e.g. Å0.06 W/g Æ.
3. Results and Discussion 3.1 Naphthenic Oils
Fig. 1 shows the DSC results from the lightest of the naphthenic oils (N100).
Upon heating, the heat flow shows a rapid decrease between –100 and –60 °C, before it levels again. The interpretation of such a curve depends much on the baseline, as three
baselines (A to C) can be drawn. Baseline A drawn straight from the heat flow below –
80 °C leads to a large endotherm and excludes the possibility of a Tg. Baseline B, an
extension of the heat flow between –30 °C and 20 °C, might be interpreted as the superposition of a small Tg and a large endotherm, whereas baseline C does the reverse.
Hence, with standard (linear heat rate) DSC the interpretation of heat flow profile is
ambiguous.
With MDSC, the total heat flow is deconvoluted into the reversing heat flow
(RHF) and the non-reversing heat flow (NRHF) [17, 18, 19]. The total heat flow is
equivalent to the standard DSC signal. The origin of the RHF and NRHF, as it pertains
to hydrocarbons, has been described before [9, 11, 12]. In its simplest case, and at
temperatures below oxidation or degradation, the RHF provides the apparent heat
from non-reversing phenomena like evaporation, decomposition, chemical reactions,
melting, crystallization and relaxation [18, 19]. In some instances, however,
crystallization and melting do contribute to the reversing heat flow [9, 21] as a result of
rapid interfacial crystallization and melting within the MDSC modulation cycle [21].
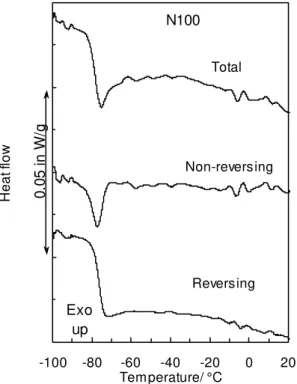
Fig. 2 shows the total, RHF and NRHF for the naphthenic oil N100. The RHF,
readily converted to the specific heat capacity (cp) [9], shows a large change between –93
°C and –70 °C due to a Tg centered at –76 °C. The deconvolution shows that baseline C
in Fig. 1 was the more appropriate, although it may not have seemed the best baseline
choice. Concurrent with the Tg, the NRHF shows an endothermic peak centered at –77
°C. This endotherm does not arise from melting, but from enthalpy relaxation [22], which arises from the cooperative chain motions in the Tg region [23]. Molecular mobility
increases sharply at Tg, and this leads to a loss of short-range order that requires energy.
This loss of order, which is an endothermic process, is reminiscent of the loss of
long-range order due to melting. In standard DSC, the enthalpy relaxation is recognized as an
endotherm near Tg [24]. The higher the short-range order of the amorphous material that
gives rise to Tg, the greater the enthalpy relaxation and the greater the endotherm.
Consequently, this enthalpy increases upon the local densification that follows annealing
[23, 25].
Above the enthalpy relaxation in the NRHF curve of Fig. 2, small endotherms
between –20 and 20 °C are attributed to the melting of residual crystallinity. As will be seen later, this is also the temperature region where paraffinic oils show their
concentration of poorly ordered naphthenic (cyclo-aliphatic) segments, which represent
49% of the carbon content (Table 1).
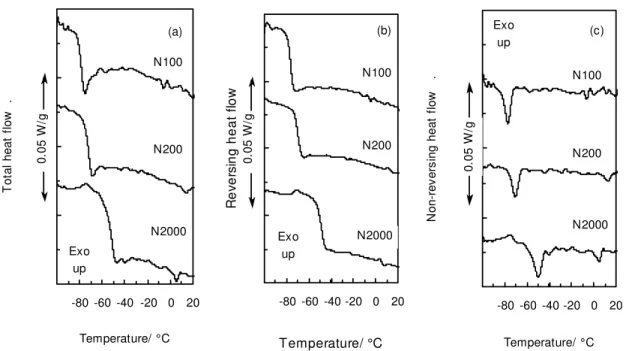
Fig. 3 shows the total, RHF and NRHF for three naphthenic oils. The main
difference between the oils is an increase in reversing heat flow at Tg, i.e. Δcp, and a shift
in Tg to lower temperatures due to an increase in saturates content. Table 2 shows that
DSC consistently placed the Tg 3 °C to 5 °C lower than MDSC. The relationship
between Tg and composition will be discussed in more detail later.
There is a noteworthy positive contribution to the baseline at the end of the Tg on
the RHF curve, which shows as negative contribution to cp (Fig. 4). Such an effect is
fairly common in semi-crystalline polymers [20]. It arises from a loss of amorphous
material responsible for Tg due to the stiffening effect of crystals near the amorphous
material. The result is a rigid amorphous material with a Tg higher than that of the free
amorphous material. In Fig. 4, the negative contribution to cp was small and no second Tg
could be discerned, but the negative contribution to cp increased with the content of
saturates, a fraction that is most often semi-crystalline. Little crystalline material is
needed to freeze a large portion of the amorphous material into a rigid amorphous phase
[20 and references therein]. The existence of such material in oils, and its effect on oil
rheology, is no doubt a subject that would benefit from further work.
3.2 Paraffinic oils
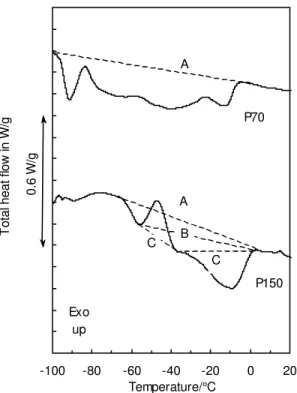
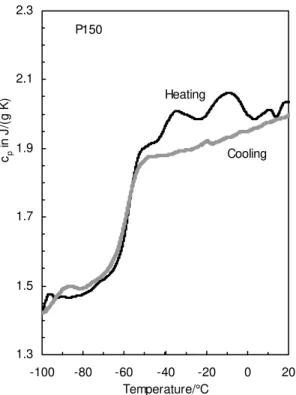
DSC signals shown in Fig. 5 were obtained upon heating two paraffinic oils, P150
and P70. Such oils are known to crystallize [6]. Again, selecting a proper baseline is
difficult, with baseline A likely being the most natural choice. The curves are typical of
MDSC results on the paraffinic P150 are shown in Fig. 6. The RHF shows a Tg
centered at –60 °C, whereas the NRHF indicates the existence of two endotherms with minima at –60 °C (enthalpy relaxation) and at –10 °C (melting), separated by an exotherm (cold crystallization) with a maximum at –45 °C. The deconvolution demonstrates that baseline C in Fig. 5 would have been the more appropriate, and would
have led to the closest assessment of the true size of the endo- and exotherms.
Interpretation of thermal events is thus facilitated by MDSC.
Above the Tg in Fig. 6, the RHF shows two small endotherms with minima at –35
°C and –7 °C. With bitumen, the existence of endotherms on the RHF curve was related to reversible melting and crystallization of saturated segments [9]. This reversible
process normally occurs at the growth face of crystals where rapid crystallization and
melting of n-paraffins or oligomers of low molar mass occurs [27]. In bitumen and oils,
short crystallisable paraffinic segments may be anchored to higher molecular weight
structures that may or may not be aromatic. Reversible melting explains the presence of
endotherms on the RHF curve and the thermal hysteresis in cp from heating and cooling
runs [9] as shown in Fig. 7. Upon cooling from the liquid state, the cp curve only shows
the Tg centered around –60 °C, whereas upon heating, the presence of low molar mass
paraffins allows for reversible melting between –50 °C and 0 °C.
Fig. 8 shows the RHF and the NRHF after the heating and cooling of the
semi-crystalline P150. From the identification of the Tg region on the RHF curves, it becomes
possible to correctly set a baseline and determine enthalpies on the NRHF curves. From
the analysis, it is conspicuous that not all heating endotherms are from melting and that
NRHF curve shows a broad crystallization exotherm that begins at –10 °C. Its large width indicates the formation of a myriad of imperfect crystalline structures rather than
large, well-shaped crystals that would have given sharp peaks upon melting. Upon
continued cooling, there is a change in baseline at the onset of Tg (–52 °C) when
molecular motions become very slow, to the point that crystallization cannot proceed
further.
Upon heating, the NRHF signal in Fig. 8 shows that past a slight endothermic
enthalpy relaxation (minimum at –60 °C), exothermic cold crystallization occurs. The
ordering of crystallisable segments begins near the end of the Tg region. The
crystallization occurs more readily above Tg, when diffusion is more rapid and
neighbouring crystallizable segments can more easily come together. The crystallization
exotherm is followed by a melting endotherm, which is smaller than that indicated by the
more “natural” baseline A in Fig. 5. On this basis, it may thus be concluded that
crystalline contents obtained by standard DSC (Fig. 5) is overestimated because it
accounts for repeating (reversible) melting and recrystallization. This may help explain
the discrepancy in crystalline content measured by standard DSC and wet chemistry [10].
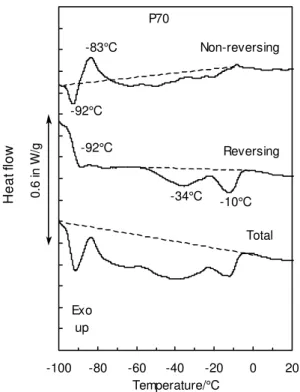
Fig. 9 shows the MDSC results obtained upon heating another paraffinic oil, P70.
Again it is conspicuous that true enthalpies are lower than estimated based on standard
DSC (total heat flow). The NRHF and RHF curves show similar phenomena to those in
Fig 6 for P150. The NRHF curve in Fig. 9 shows that the enthalpies for relaxation and
cold crystallization in P70 are 30 °C to 40 °C lower than in P150. The profiles of the
RHF are also quite similar, except for a lower Tg and larger endotherms in P70 than in
The cooling curves for P70 are shown in Figure 10. The NRHF curve show that
exothermic crystallization at –18 °C, highlighted at the top of the figure by the dotted
line, coincided with some melting, as seen at the bottom of the figure by the endothermic
peak on the RHF curve. This reversible melting upon cooling was unexpected.
Incomplete deconvolution of the NRHF and RHF was ruled out as the reason for the
reversing endotherm, after experiments with higher modulation frequencies lead to a
constant cp, unlike the case for high molecular weight polymers [20]. This suggests that
the heat released by the irreversible crystallization can be recaptured by crystals that can
melt reversibly even upon cooling, when the average temperature of the oil is being
reduced. This would be consistent with the ordering of low molar mass material [20, 27],
and as will be seen shortly, with the existence in the oils of very short oligomeric chains
with repeat numbers below 20.
Cooling experiments are not often undertaken in the study of oils or bitumen. The
results shown here, and those shown for bitumen fractions [9], indicate that it should be
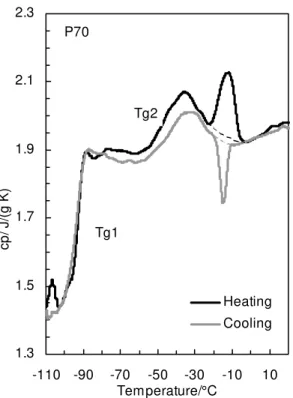
done routinely along with the heating experiments. A comparison of the cp curves after
heating and cooling clearly indicates that the seemingly endothermic melting at –34 °C in
Fig 9 is not an endotherm (Fig. 11). Both the heating and cooling curves follow each
other except for the true enthalpies around –18 °C. Fig. 11 demonstrates that the increase
in cp between about –60 °C and –30 °C was due to a second Tg.
The existence of two Tgs in the paraffinic P70 was confirmed by rheological
measurements. Fig. 12 shows the complex modulus for both P150 and P70 between –90
°C and 0 °C. With its Tg at –58 °C and its cold crystallization below –40 °C (Fig. 6),
within 40 °C as the oil slowly liquefied (Fig. 12). In contrast, the modulus of P70
decreased to the same extent, but over 80 °C. The modulus slowly decreased with
heating, and it is only beyond about –30 °C, after the second Tg (Fig. 11), that the
modulus decreased rapidly.
The second Tg in P70 was not readily apparent in Fig. 6 because of a decrease in
cp past the higher Tg (Fig. 11). Earlier, a decrease in cp was attributed the formation of a
rigid amorphous phase. In this case, however, it might be attributed to the demixing of
different phases [28]. Indeed, the two Tgs in P70 indicate the existence of two glassy
domains of different compositions. Above the second Tg, each domain is a viscous
liquid, so that two partially mixed liquids may segregate more fully from each other. The
crystalline phase may impede complete segregation, if it is not part of one of the
domains. Quite obviously, further work will be required to fully understanding the
ordering and interactions in multi-component petroleum derivatives.
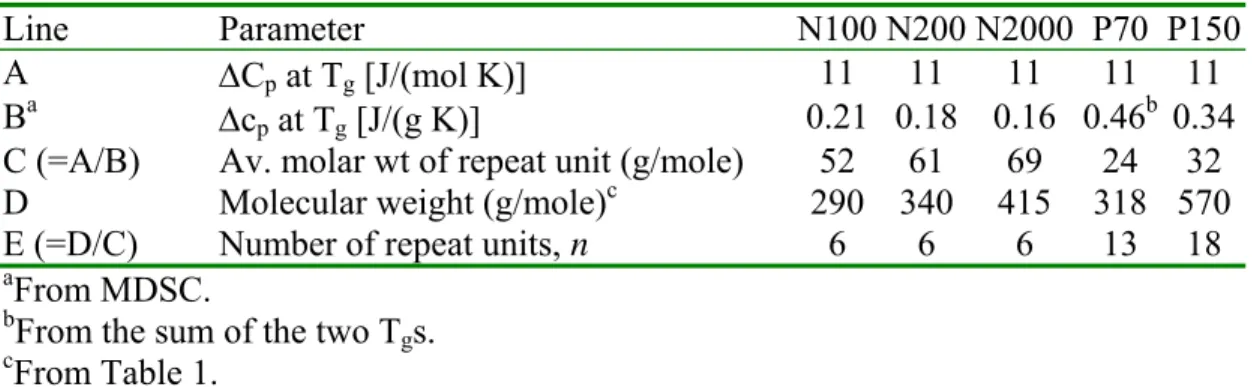
3.3 Number of repeat units in hydrocarbon chains
Like all hydrocarbon products from petroleum, the oils are mixtures. The
molecular weight and polydispersity can be measured, but the number of repeat units n in
the hydrocarbon chain remains undefined because of the lack of the structural regularity
typical of synthetic products. In other words, hydrocarbon chains are a collection of
repeat units, with each one possibly different from the next. In such a case, the value of n
may be estimated from the change in heat capacity at Tg [11]. The change in the molar
heat capacity for amorphous organic materials at Tg is 11 J/(mol K)[29]. The ratio of the
the relative molecular weight of the oil repeat unit (row C, Table 3), from which n can be
calculated (row E, Table 3).
All the naphthenic oils show values of n = 6, whereas the paraffinic oils show
larger values of 13 and 18. These values are well below the limit below which reversible
crystallization can occur. At n > 70, molecular nucleation (seeding) is necessary for
crystallization, but below this limit nucleation is not necessary for crystallization and it
can readily occur [30]. In other words, short chains can melt and crystallize reversibly
and repeatedly, which explains the reversible melting observed with the oils. The results
in Table 3 are interesting on other counts: i) n depends on the type of oil. It is larger for
paraffinic oils than for naphthenic oils, which is consistent with molecular chains with
small units in paraffinic oils (e.g. methylene) and chains of larger cyclo-alkane units in
naphthenic oils [31]; ii) the number of repeat units is constant across the naphthenic oils.
Thus the increase in the molecular weight of these oils is the result of an increase in the
average mass of the repeat units; iii) In contrast, the increase in the molecular weight of
the paraffinic oils is due to an increase in the average mass of the repeat units and to an
increase in the number of repeat units.
3.4 Tgs in light oils and higher hydrocarbons
From the MDSC results on the paraffinic and naphthenic oils, five Tgs were
obtained. This is admittedly a small data set from which to draw correlations, but this set
can nonetheless help illustrate a relationship between Tgs and factors related to molecular
architecture in oils and heavy hydrocarbon mixtures (e.g. bitumen), all derived from
The Tg of an organic compound is governed by the stiffness of its molecular
segments, as determined by segment polarity, aromaticity and crystallinity [32]. The Tg
of the naphthenic oils studied here increased with the aromatics content, or decreased
with the saturates content (Fig. 3b). From the Tgs of these naphthenic oils alone, the
correlation between the Tg and the composition in saturates and aromatics (Table 1) is
linear (Fig. 13). The extrapolation of this linearity to the Tgs of “pure” hydrocarbons is
noteworthy. The extrapolation to a composition of 100% aromatics or 0% saturates leads
to a Tg at 53 °C to 73 °C. This is coincidentally the temperature region covered by the Tg
of asphaltenes [9, 11]. Similarly, the extrapolation to 100% saturates or 0% aromatics
leads to a Tg of –142 °C to –152 °C, relatively close to the Tg of long chain n-paraffins
(polyethylene) at –125 °C [33]. The low extrapolated Tg of the saturates vs polyethylene
is likely a reflection of their low molecular weight and their greater segment mobility
compared to long-chain paraffins. It is noteworthy that the 10-20°C variation on the extrapolated Tgs in Fig. 13 is well within the variation in the Tg for many bitumens,
which vary over 18°C [34]. The extrapolations of the Tgs for the naphthenic oils studied
and their correspondence with the Tgs of much higher molecular weight hydrocarbons
thus reinforces the idea [31] that in a complex petroleum-based mixture, light and heavy
hydrocarbons co-exist as a continuum.
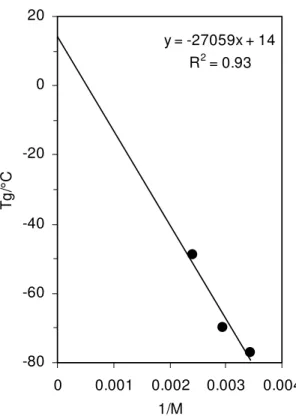
Within the continuum, Tg can be related to molecular weight by the expression Tg
= K/M – Tg ∞, where K, M, and Tg ∞ are, respectively, a constant, the molecular weight
and the Tg at infinite molecular weight. This expression is commonly used for polymers
1/M (Fig. 14). By extrapolation, a value of Tg ∞ = 14 °C is obtained, which is close to the
Tg of 20 °C for resins extracted from bitumen [9]. Consequently, naphthenic oils may be
considered as reasonable low molecular weight analogs of resins extracted from bitumen
or heavy oils. In other words, resins may be regarded as an ensemble of segments with
molecular weights typical of naphthenic oils, the basis of the assembly of the naphthenic
segments possibly being close to the dimerization process proposed by Michon et al. [35]
to explain bitumen aging.
4. Summary and Conclusion
Naphthenic and paraffinic oils were characterized by MDSC. Glass transition
temperatures, and relaxation and melting endotherms could easily be identified, in
contrast to regular DSC. With MDSC, it was found that each glass transition temperature
(Tg) coincided with an enthalpy relaxation most often mistaken for melting in regular
DSC. MDSC also allowed for the identification of reversible melting. Both the enthalpy
relaxation and the reversible melting may lead to an overestimation of the DSC
crystallinity in oils. The same may be expected after the analysis of other
petroleum-based products.
Upon heating of the oils, MDSC allowed for the identification of a negative
contribution to cp, immediately after Tg, This was attributed to the existence of rigid
amorphous material. Cooling experiments proved invaluable in determining the true
nature of some features visible in the thermogram. An apparent endotherm upon heating,
for instance, was found upon cooling to be a second Tg.
MDSC helped correctly measure Δcp at Tg and locate Tg, which was 3-4 °C higher
repeat units in the oil chains was calculated to be about 6 in naphthenic oils and 13 to 18
in paraffinic oils, and it was determined that the oil molecular weight was a function of
both the number of repeat units in oil chains and the average mass of these units.
From the precise location of the Tgs, the composition of the oils and their
molecular weights, the properties of the oils could be correlated with those of heavier
hydrocarbons. The Tg of a hypothetic pure aromatic oil was similar to that for petroleum
asphaltenes. The Tg of naphthenic oils of infinite molecular weight was similar to that for
petroleum resins. The relationships highlighted the continuum between lighter and
heavier hydrocarbons, and suggested that oils might be considered low molecular weight
analogs of much heavier hydrocarbons.
References
[1] P. Singh, H. S. Fogler and N. Nagarajan, J. Rheol. 43 (1999) 1437.
[2] I. Gawel, F. Czechowski, K. Baginska, Proc. Eurasphalt & Eurobitumen Congress, Strasbourg, France, May 7-10, 1996, E&E.5.139, 1.
[3] R.M. Webber, J. Rheol. 43 (1999)911.
[4] H. J. Connor and J. G. Spiro, J. Inst. Petrol. 54 (1968) 137. [5] F. Noel and L.W. Corbett, J. Inst. Petrol. 56 (1970) 261. [6] F. Noel, Thermochim Acta 4 (1972), 377.
[7] C. Giavarini and F. Pochetti, J. Therm. Anal. 5 (1973) 83.
[8] I. R. Harrison, G. Wang, T.C. Hsu, A Differential Scanning Calorimetry Study of Asphalt Binders, Report SHRP–A/URF-92-612, Strategic Highway Research Program, National Research Council, Washington, DC, 1992.
[9] J-F. Masson, G. M. Polomark, and P. Collins, Energy & Fuel 16 (2002) 470. [10] D. Lesueur, J. P. Planche, P. Dumas, Bull. Labo Ponts Chaussées 229 (2000) 3. [11] J-F. Masson and G. M. Polomark, Thermochim. Acta 374 (2001) 105-114. Erratum
[12] J. Pak, B. Wunderlich, J. Polym. Sci: B, 38 (2000) 2810.
[13] L.C. Michon, D. A. Netzel, T. F. Turner, D. Martin, J. P. Planche, Energy Fuels 13 (1999) 602.
[14] Anonymous, ASTM D2502, Standard Test Method for Estimation of Molecular Weight (Relative Molecular Mass) of Petroleum Oils From Viscosity Measurements. American Society for Standards and Testing, Barr Harbour, PA, USA.
[15] Anonymous, ASTM D2140 Standard Test Method for Carbon-Type Composition of Insulating Oils of Petroleum Origin, American Society for Standards and Testing, Barr Harbour, PA, USA.
[16] Anonymous, ASTM D2007, Standard Test Method for Characteristic Groups in Rubber Extender and Processing Oils and Other Petroleum-Derived Oils by Clay-Gel Absorption Chromatographic Method. American Society for Standards and Testing, Barr Harbour, PA, USA.
[17] M. Reading, Trends in Polymer Science, 8 (1993) 248.
[18] M. Reading, D. Ellliot, V. L. Hill, J. Therm. Anal. 40 (1993), 949. [19] P.S. Gill, S. R. Sauerbrunn, M. Reading, J. Therm. Anal. 40 (1993), 931. [20] B. Wunderlich, Progr. Polym. Sci. 28 (2003) 383.
[21] B. Wunderlich, I. Okazaki, K. Ishikiriyama, A. Boller, Thermochim. Acta 324 (1998) 77.
[22] B. Wunderlich, Thermal Analysis, Academic Press, New York, 1990, pp. 203-207. [23] A. Boller, C. Schick, B. Wunderlich, Thermochim. Acta 266 (1995) 97.
[24] T. Hatakeyama, F. X. Quinn, Thermal Analysis: Fundamentals and Applications to Polymer Science, John Wiley & Sons, Chichester, 1994.
[25] I. Okazaki, B. Wunderlich, J. Polym. Sci. B., 34 (1996) 2941.
[26] J. P. Planche, P. M. Claudy, J. M. Létoffé, D. Martin, Thermochim. Acta 324 (1998) 223.
[27] B. Wunderlich, Thermochim. Acta 396 (2003) 33.
[29] B. Wunderlich, Thermochim Acta 300 (1997) 43.
[30] B. Wunderlich, A. Boller, I. Okazaki, K. Ishikiriyama, Thermochim. Acta 304/305 (1997) 125.
[31] J. Speight, The Chemistry and Technology of Petroleum, 3rd Ed., Marcel Dekker, New York, 1999.
[32] A. Eisenberg, The Glassy State and the Glass Transition, in Physical Properties of Polymers, 2nd Edition, American Chemical Society, Washington, DC, 1993, p. 85-87.
[33] R. J. Andrews and E. A. Grulke, Glass Transition Temperatures of Polymers, in Polymer Handbook, J. Brandup, E.H. Immergut, and E. A. Grulke, Ed., A. Abe, D. R. Bloch, assoc. Ed., Wiley, New York, 1999, p. VI-206.
[34] T. F. Turner, J.F. Branthaver, DSC Studies of Asphalts and Asphalt Components, Chap. 3 in Asphalt Science and Technology, A. M. Usmani, Ed., Marcel Dekker, New York, 1997.
[35] L. Michon, D. Netzel, B. Hanquet, D. Martin, J. P. Planche, Petrol. Sci. Technol. 17 (1999) 369-381.
Glossary
Amorphous material. Matter without long-range atomic or molecular order. Not crystalline.
Cold crystallization. Ordering of amorphous material into crystalline material upon heating.
Crystalline material. Matter that show a regular and repeating atomic or molecular pattern.
Crystallization. Long-range ordering of matter into regular structures, i.e., crystals, upon cooling from the melt.
Crystallization temperature. Temperature at which crystallization occurs.
Deconvolution. Fourier-transformation by which the total heat flow from MDSC is split into its reversing (RHF) and non-reversing heat flows (NRHF).
Endotherm: Positive change in enthalpy, i.e., absorption of heat, that accompanies melting.
Enthalpy relaxation: Endothermic loss of order that result from an increase in molecular mobility at the glass transition.
Exotherm: Negative change in enthalpy, i.e., release of heat, which accompanies crystallization or cold crystallization.
Glass transition temperature (Tg): The critical temperature at which amorphous matter goes from a hard and brittle state to being elastic and flexible, or vice-versa. The transition is characterized by a change in relaxation time such that below Tg the
relaxation times are long and molecular motions are reduced, whereas above Tg
relaxation times are short and molecular motions are fast.
Melting. Disordering of crystalline matter into amorphous matter upon heating.
Modulated differential scanning calorimetry (MDSC): Method where a sinusoidal heating (cooling) is superimposed to the linear heating (cooling) of standard differential scanning calorimetry. The result is a modulation of the temperature that depends on the frequency and the amplitude of the cyclic signal.
Non-reversing heat flow (NRHF): Heat flow from molecular motions or processes that do not reach equilibrium within an MDSC modulation period. Non-equilibrium processes typically include oxidation, evaporation, decomposition, and chemical reactions.
Relaxation: Approach of steady-state after a change in the equilibrium condition.
Reversing heat flow (RHF): Heat flow from atomic motions responsible for the heat capacity, and from molecular processes rapid enough to occur during an MDSC modulation period.
Rigid amorphous material: Amorphous material whose molecular mobility is reduced by its association with adjacent crystalline material.
Table 1. Oil characteristics Naphthenic Paraffinic Method a N100 N200 N2000 P70 P150 Composition, % D2007 saturates 68 61 53 93 82 aromatics 31 38 45 6 17 polars 0.4 0.7 2 0.1 1.0 asphaltenes <0.1 < 0.1 < 0.1 < 0.1 <0.1 Carbon type, % D2140 paraffinic 42 44 51 62 71 naphthenic 49 46 26 37 27 aromatic 9 10 13 1 2 Molecular wt, D2502 290 340 415 318 570 a
ASTM method number
Table 2. Tg and Δcp from the various mineral oilsa
Oil Tg Δcp DSC MDSC DSC MDSC N100 –80 –77 0.18 0.21 N200 –74 –70 0.07 0.18 N2000 –53 –48 0.19 0.16 P70 n.d. b –93,–40 n.d. 0.46c P150 n.d. –58 n.d. 0.34 a
From the heat flow on heating.
b
n.d.: could not be determined.
c
For the combined Tgs.
Table 3. Determination of the number of repeat units, n
Line Parameter N100 N200 N2000 P70 P150
A ΔCp at Tg [J/(mol K)] 11 11 11 11 11
Ba Δcp at Tg [J/(g K)] 0.21 0.18 0.16 0.46b 0.34
C (=A/B) Av. molar wt of repeat unit (g/mole) 52 61 69 24 32 D Molecular weight (g/mole)c 290 340 415 318 570
E (=D/C) Number of repeat units, n 6 6 6 13 18
a
From MDSC.
b
From the sum of the two Tgs. c
-0.07 -0.06 -0.05 -0.04 -100 -80 -60 -40 -20 0 20 Temperature/ °C Heat f low in W /g N100 Exo up A B C
Fig. 1. DSC signal of the naphthenic oil N100 upon heating.
-0.12 -0.1 -0.08 -0.06 -0.04 -100 -80 -60 -40 -20 0 20 Temperature/ °C H eat f lo w Total Non-reversing Reversing N100 0. 05 i n W/ g Exo up
Fig. 2. Total, reversing and non-reversing heat flows from the heating of the naphthenic oil N100.
-0.12 -0.1 -0.08 -0.06 -0.04 -10 0 -80 -60 -40 -20 0 20 Temperature/ °C To ta l h e a t fl o w . N100 N200 N2000 Exo up 0. 0 5 W /g (a) -0.12 -0.1 -0.08 -0.06 -0.04 -10 0 -80 -60 -40 -20 0 20 Temperature/ °C N o n-rev e rs ing h eat f low . N100 N200 N2000 Exo up 0. 0 5 W /g (c) -0.12 -0.1 -0.08 -0.06 -0.04 -10 0 -80 -60 -40 -20 0 20 Temperature/ °C R ev er s ing heat f low N100 N200 N2000 Exo up 0. 0 5 W /g (b)
Fig. 3. Total (a), reversing (b), and non-reversing (c) heat flows from the heating of the naphthenic oils N100, N200 and N2000.
1.1
1.2
1.3
1.4
1.5
1.6
1.7
-100 -80 -60 -40 -20 Temperature/°C H e a t ca p a ci ty 0. 3 in J /( g K ) Saturates 68% 61% 53% N100 N200 N2000 Endo up-0.14 -0.13 -0.12 -0.11 -0.1 -0.09 -0.08 -0.07 -0.06 -0.05 -0.04 -0.03 -0.02 -0.01 0 0.01 0.02 -100 -80 -60 -40 -20 0 20 Temperature/°C T o tal heat f low in W /g P150 P70 Exo up 0. 6 W /g A A B C C
Fig. 5. Total heat flow from the heating of the paraffinic oils and some possible baselines for P150. -0.16 -0.14 -0.12 -0.1 -0.08 -0.06 -0.04 -0.02 0 -100 -80 -60 -40 -20 0 20 Temperature/°C H e a t fl ow Total Non-reversing Reversing P150 Exo up 0.6 W /g -45°C -10°C -60°C -35°C -7°C -60°C
1.3 1.5 1.7 1.9 2.1 2.3 -100 -80 -60 -40 -20 0 20 Temperature/°C cp in J /( g K ) Heating Cooling P150
Fig 7. Apparent cp from the heating and cooling of paraffinic oil P150.
-0.18 -0.16 -0.14 -0.12 -0.1 -0.08 -0.06 -0.04 -0.02 0 0.02 0.04 -100 -80 -60 -40 -20 0 20 Temperature/°C cooling heating P150 Exo up heating cooling Non-reversing Reversing 0. 06 W /g H eat f low .
Fig. 8. Reversing and non-reversing heat flow curves obtained upon heating and cooling paraffinic oil P150.
-0.2 -0.19 -0.18 -0.17 -0.16 -0.15 -0.14 -0.13 -0.12 -0.11 -0.1 -0.09 -0.08 -0.07 -0.06 -0.05 -0.04 -100 -80 -60 -40 -20 0 20 Temperature/°C Heat f low Total Non-reversing Reversing P70 Exo up 0.6 i n W /g -83°C -92°C -92°C -34°C -10°C
Fig. 9. Heat flow curves from the heating of the paraffinic oil P70.
-0.18 -0.16 -0.14 -0.12 -0.1 -0.08 -0.06 -0.04 -0.02 0 0.02 0.04 -100 -80 -60 -40 -20 0 20 Temperature/°C Heat f low Non-reversing Reversing P70 Exo up 0.6 i n W /g heating cooling heating cooling
1.3 1.5 1.7 1.9 2.1 2.3 -110 -90 -70 -50 -30 -10 10 Temperature/°C Heating Cooling Tg1 P70 cp / J/ (g K) Tg2
Fig. 11. Apparent cp from the heating and cooling of paraffinic oil P70.
1.E+02 1.E+03 1.E+04 1.E+05 1.E+06 1.E+07 1.E+08 -90 -80 -70 -60 -50 -40 -30 -20 -10 0 Temperature/°C C o mp le x Mo d u lu s /P a . P70 P150
0 25 50 75 100 -200 -150 -100 -50 0 50 100 Temperature/°C S a tu ra te s i n w t % 0 25 50 75 100 A rom a tic s in wt % Saturates Aromatics Aromatics Saturates 53°C 73°C -142°C -152°C
Fig. 13. Correlation between the naphthenic oil compositions and their Tg. Saturates and
aromatic contents are from Table 1. Extrapolated Tgs are as indicated. See text for
details. y = -27059x + 14 R2 = 0.93 -80 -60 -40 -20 0 20 0 0.001 0.002 0.003 0.004 1/M Tg /° C