IntroductIon
The prevalence of obesity in adult and children is increasing at an alarming rate all over the world. It is associated with health problems due to metabolic alterations such as hypercholeste-rolemia, hypertriglyceridemia, hyperinsulinemia, oxidative stress, inflammation, impaired fasting glucose, and insulin resistance (1–4). Many aspects of this phenomenon are still not fully understood.
In particular, the impact of obesity and excessive energy intake on protein metabolism is still controversial. At first, it was proposed that basal metabolic rate could be lower in obesity prone subjects (5), suggesting lower protein turnover rates in these subjects because protein turnover is an impor-tant component (~20%) of basal metabolic rate (6). On the other hand, it was established in young animals that, for a given protein intake, additional energy intake stimulates protein synthesis (7). But obesity-associated abnormalities like insulin resistance (8), inflammation (9,10), and oxida-tive stress (11) can modulate tissue protein synthesis rates.
It could be the reason why studies measuring protein syn-thesis in obese subjects obtained conflicting results: in the postabsorptive state, some studies in humans have reported that basal rates of protein turnover measured by leucine infu-sion and adjusted to lean body mass were similar in obese vs. nonobese subjects (12,13), whereas others have found higher rates of protein turnover in obese vs. nonobese subjects (8,14–16) or during diet-induced obesity in rats (17); in the fed state, Anderson et al. (18) found that diet-induced obesity led to an impaired activation of skeletal muscle protein syn-thesis rates in high-fat low-carbohydrates–fed mice compared with low-fat high-carbohydrates–fed mice after a test meal. No significant effects were observed in liver (18). The presence or absence of obesity-associated metabolic abnormalities could explain variations in the results obtained.
Thus, the aim of the present study was to determine the impact of excessive chronic energy intake on protein synthesis rates in adult animals without associated metabolic abnormalities suscep-tible to modulate these rates. Male Wistar rats were fed with a diet
Excessive Energy Intake Does Not Modify
Fed-state Tissue Protein Synthesis Rates
in Adult Rats
Solange Adéchian
1,2, Silvana Giardina
3, Didier Rémond
1,2, Isabelle Papet
1,2, Daniela Buonocore
3,
Claire Gaudichon
4, Dominique Dardevet
1,2, Fulvio Marzatico
3and Laurent Mosoni
1,2The impact of chronic excessive energy intake on protein metabolism is still controversial. Male Wistar rats were fed
ad libitum during 5 weeks with either a high-fat high-sucrose diet (HF: n = 9) containing 45% of total energy as lipids (protein 14%; carbohydrate 40% with 83.5% sucrose) or a standard diet (controls: n = 10). Energy intake and body weight were recorded. At the end of the experiment, we measured body composition, metabolic parameters (plasma amino acid, lipid, insulin, and glucose levels), inflammatory parameter (plasma α2-macroglobulin), oxidative stress parameters (antioxidant enzyme activities, lipoperoxidation (LPO), protein carbonyl content in liver and muscle), and in vivo fed–state fractional protein synthesis rates (FSRs) in muscle and liver. Energy intake was significantly higher in HF compared with control rats (+28%). There were significant increases in body weight (+8%), body fat (+21%), renal (+41%), and epidydimal (+28%) fat pads in HF compared with control rats. No effect was observed in other tissue weights (liver, muscle, spleen, kidneys, intestine). Liver and muscle FSRs, plasma levels of lipids, glucose, insulin and α2-macroglobulin, soleus and liver glutathione reductase and peroxidase acitivities, MnSOD activity, LPO, and protein carbonyl content were not altered by the HF diet. Only soleus muscle and liver Cu/ZnSOD activity and soleus muscle catalase activities were reduced in HF rats compared with control rats. Thus, chronic excessive energy intake and increased adiposity, in the absence of other metabolic alterations, do not stimulate fed-state tissue protein synthesis rates.
Obesity (2009) 17, 1348–1355. doi:10.1038/oby.2009.35
1INRA, UMR 1019 Nutrition Humaine, Saint Genès Champanelle, France; 2Univ Clermont 1, UFR Médecine, UMR 1019 Nutrition Humaine, Clermont-Ferrand,
France; 3Univ Pavia, Department of Physiological and Pharmacological Sciences, Pharmacology and Pharmacological Biotechnology, Pavia, Italy; 4INRA, UMR0914,
UMR INRA/INA-PG/AgroParisTech: Physiologie de la Nutrition et du Comportement Alimentaire, Alimentation Humaine, Centre de recherche de Paris, FRA INRA and AgroParisTech, Paris, France. Correspondence: Laurent Mosoni ([email protected])
containing 45% of total energy as lipid during 5 weeks. We then measured parameters associated with insulin resistance, inflam-mation, and oxidative stress, and also protein synthesis rates in vivo in the fed state in muscle and liver.
Methods and Procedures animals and experimental diets
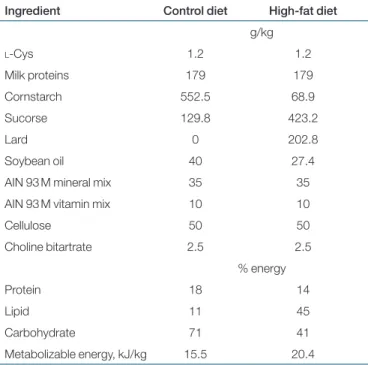
These experiments were performed in accordance with current legisla-tion on animal experimentalegisla-tion in France. Male Wistar rats (n = 19) from Harlan (Gannat, France), weighing 323.1 ± 1.7 g (means ± s.e.) were housed in individual cages under controlled environmental con-ditions (temperature 20 ± 1 °C, humidity 50 ± 5%) with a 12-h inverse light:dark cycle (light on at 1700 h) and food and water ad libitum. On arrival, rats were acclimatized to the animal facilities for 5 days and were fed commercial laboratory pellets (UAR 04, UAR, Villemoisson sur Orge, France). Then, animals were randomly distributed into two groups with similar mean body weights (322.9 ± 2.3 g) (means ± s.e.) and were fed either a control diet (n = 10) or a high-fat, high-sucrose diet (HF, n = 9) during 5 weeks (see Table 1 for detailed diet composi-tion). Both diets were prepared by a specialized unit of INRA (UPAE, INRA, Jouy-en-Josas, France) as dry powder which was mixed with tap water extemporaneously and given on a semi-liquid form to the rats.
Body weight was recorded three times a week. Food was distributed in individual ramekins and changed every day. Food intake was precisely recorded during the last week of the experiment by measuring dry mat-ter intake daily.
Killing and sampling
After 5 weeks of feeding, tissue protein synthesis rates were measured
in vivo using the flooding dose method (19). These measurements
were performed in the fed state, 4–7 h after the beginning of the dark period. Fed state was confirmed by measuring stomach dry matter content, which was positive and similar in control (2.2 ± 0.3 g) and in HF (2.7 ± 0.3 g) rats (means ± s.e.). Twenty minutes before killing, each rat was injected in a lateral tail vein under a light gaseous anesthesia (isoflurane; Baxter, Mauripas, France) with a flooding dose of valine (150 μmol/100 g body weight) to flood the precursor pools, with 50% of l-[1-13C] valine (99%; Cambridge Isotope Laboratories, Andover, MA). Then, a lethal anesthesia was induced by intraperi-toneal injection of pentobarbital sodium (Sanofi, Libourne, France) just before killing by exsanguination. Blood was rapidly collected in heparinized tubes and centrifuged at 3,000g for 10 min. Plasma was collected and kept frozen in liquid nitrogen before storing at −80 °C until further analysis. Liver, kidneys, small intestine, gastrocnemius,
extensor digitorum longus (EDL), tibialis anterior, and soleus muscles
of both hind legs were excised and quickly chilled on ice to stop tracer incorporation. The liver was cut into small pieces, rinsed in cold saline (NaCl 9 g/l solution) to remove the blood and wiped. The small intes-tine was emptied, rinsed with cold trichloroacetic acid (0.12 mol/l), and dried. The epididymal and renal fat pads were carefully removed. These tissues were weighed, frozen in liquid nitrogen 3–5 min after exsanguination and stored at −20 and −80 °C until analysis. Spleen was weighed and put back with the carcass. Stomach content was taken, dried, and weight was measured. The remaining parts of the whole digestive tract were also emptied, rinsed, dried, and put back with the carcass. After tissue sampling, the carcass was stored at −20 °C until body composition measurements.
Measurements of in vivo tissue protein synthesis rates
Measurements of valine enrichments. Free and protein-bound
valine enrichments were determined as described previously (19). Briefly, liver was powdered in liquid nitrogen in a ball mill (Dangoumeau, Prolabo, Paris, France). A 0.2 g aliquot of frozen liver powder or whole EDL muscle was homogenized in eight volumes of ice-cold 0.61 mol/l trichloroacetic acid (Potter, Bosch, France).
Homogenates were centrifuged (5,000g, 15 min, 4 °C) and supernatants, containing free amino acids, were desalted by cation-exchange chro-matography (AG 50 × 8, 100–200 mesh, H+ form; Bio-Rad, Richmond, CA) in mini- disposable columns. Amino acids were eluted with 4 mol/l NH4OH. After evaporation of NH4OH under vacuum, free amino acids were resuspended in 0.01 mol/l HCl for enrichment measurements. Trichloroacetic acid–insoluble materials were washed in four volumes of ice-cold 0.61 mol/l trichloroacetic acid and three times in four vol-umes of 0.2 mol/l perchloric acid (HClO4). Resultant pellets were solubilized in 0.3 mol/l NaOH acid (Sigma Aldrich, Chesnes, France), incubated at 37 °C for 1 h, and protein concentration was determined in a aliquot using bicinchoninic acid (20). Proteins were precipitated again with 1.99 mol/l HClO4 overnight at 4 °C, the samples were cen-trifuged (10,000g, 5 min, 4 °C) and RNA content was determined spec-trophotometrically in the supernatant as described previously (19). The protein pellet was hydrolyzed in 6 mol/l HCl at 110 °C for 48 h. HCl was removed by evaporation (SPD121P, Savant, NY) and amino acids purified by cation-exchange chromatography as described above. Mea-surement of free valine enrichment was done as its t-butyldimethylsilyl derivative under electron impact ionization by gas chromatography/ mass spectrometry, with an HP-5890 gas chromatograph coupled to an HP-5972 organic mass spectrometer quadruple (Hewlett-Packard, Paris, France). The ions m/z 288 and 289 were monitored by selective ion recording to determine the [13C]valine enrichment. Enrichment of [13C]valine into protein was measured as its N-acetyl-propyl derivative by gas chromatography-combustion-isotope ratio mass spectrometry (Micromass Isochrom II; Fisons Instruments, Middlewitch, UK) which measured the ratio 13CO
2/12CO2.
Calculations. In vivo fractional synthesis rates (FSRs, %/day) of
tissue proteins were calculated as described previously (19): FSR = 100 × (EP − EN)/(EA × t) where t is the incorporation time, expressed in days, EP and EA are the 13C enrichments of protein-bound valine and of free valine, respectively, at the end of the incorporation time. Incorporation time was measured for each rat between the time of injection and the time of exsanguination and averaged 20.4 ± 2.4 min (means ± s.e.). EN is an estimation of the natural 13C enrichment of protein-bound valine. It was determined in three rats which were not injected with the flooding dose (two control rats and one HF rat). EP, EN, and EA were expressed in AP (atom %). The absolute
table 1 composition of experimental diets
Ingredient Control diet High-fat diet g/kg l-Cys 1.2 1.2 Milk proteins 179 179 Cornstarch 552.5 68.9 Sucorse 129.8 423.2 Lard 0 202.8 Soybean oil 40 27.4
AIN 93 M mineral mix 35 35 AIN 93 M vitamin mix 10 10
Cellulose 50 50 Choline bitartrate 2.5 2.5 % energy Protein 18 14 Lipid 11 45 Carbohydrate 71 41 Metabolizable energy, kJ/kg 15.5 20.4
synthesis rate was calculated from the product of FSR and protein content of the tissue and expressed in milligrams or grams per day (mg or g/day). Ribosomal capacity was estimated as the ratio of RNA to protein (mg RNA/g protein) because most of the RNA in tissues are ribosomal. Translational efficiency was calculated as the amount of protein synthesized (mg) per day per mg RNA.
Body composition measurements
Whole rat frozen carcass minus blood, liver, leg muscles, kidney, and small intestine was milled in liquid nitrogen (Robot Coupe, Vincennes, France) to provide a fine powder, and an aliquot was lyophilized. The carcass fat content was weighed after petroleum ether extraction and drying. Protein content was measured using Kjeldahl method. Due to removal of some organs, the body composition obtained was not equal to the true rat body composition. However, control and HF-fed rats were treated exactly in the same way. Thus, we could compare both groups and determine whether HF feeding led to modifications of adiposity, and in particular subcutaneous adiposity.
Plasma assays
Plasma insulin was analyzed using a commercial RIA kit (LINCO Research, Labodia, France). Plasma α-2-macroglobulin was measured as described previously (21). All other plasma measurements were made using commercial kit from Horiba ABX (Montpellier, France): glucose with an enzyme-linked procedure based on a glucose oxidase/ peroxidase method, triglycerides, enzymatically, total cholesterol, colorimetrically, with a cholesterol oxidase method “CHOD-PAP” (22), and high-density lipoprotein cholesterol.
Plasma amino acids were purified by ion exchange chromatog-raphy after protein precipitation, i.e., 500 µl of plasma was added to 125 µl of sulfosalicylic acid solution (1 mol/l in ethanol with 0.5 mol/l thioglycol) previously completely evaporated. Norleucine was added
as an internal standard. Samples were incubated on ice for 1 h and centrifuged at 3,500g for 1 h at 4 °C. An aliquot (250 µl) of the super-natant was combined with 125 µl of 0.1 mol/l lithium acetate buffer, pH 2.2. Amino acid concentrations were determined using an auto-mated amino acid analyzer with BTC 2410 resin (Biotronic LC 3000, Roucaire, Velizy, France).
oxidative stress parameters
Antioxidant enzyme activities and oxidative stress markers were determined in liver and soleus muscle. Samples were homogenized in phospate buffer 5 mmol/l, pH 7.4 containing Triton X-100 and pro-tease inhibitors (leupeptin A 100 U/ml, aprotinin 0.1 U/ml and pep-statin 1 µmol/l), centrifuged at 800g for 15 min and the supernatants were used for measurements. Sample protein content was measured according to ref. 23.
Antioxidant enzyme activities. Antioxidant enzyme activities were
measured with spectrophotometric methods. Catalase activity was determined by measuring the decomposition of H2O2 into H2O at 25 °C and pH 7.0 according to ref. 24. Glutathione peroxidase (GSH-Px) activity was measured by following the formation of NADP+ (25). Glutathione reductase activity was determined by measuring the oxida-tion of NADPH (26). Superoxide dismutase (SOD) activity was evalu-ated according to the capability of the samples to inhibit the reduction of cytochrome C in presence of xanthine/xanthine oxidase (27). Two isoforms of SOD were evaluated, the cytosolic one (Cu/ZnSOD) and the mitochondrial one (MnSOD), by using different concentrations of KCN (10 µmol/l and 1 mmol/l, respectively).
0 100 200 300 400 500 kJ/ day * * Control HF
Figure 1 Energy intake in control and high-fat fed rats. Male Wistar
rats were fed with a control diet (n = 10) or a high-fat diet (HF, n = 9) during 5 weeks. Mean energy intake ± s.e. measured during week 5 is presented. *Significant difference between control and HF rats with
P < 0.001. 300 350 400 450 500 0 5 10 15 20 25 30 35 Body weight (g) Days * Control HF
Figure 2 Evolution of body weight in control and high-fat fed rats. Male
Wistar rats were fed with a control diet (n = 10) or a high-fat diet (HF, n = 9) during 5 weeks. Body weight was measured three times a week from week 1 to week 5. Mean values ± s.e. obtained in each group are represented. *Significant difference between control and HF rats with P < 0.01.
table 2 Body composition in control and high-fat fed rats
Control HF g
Body weight 455 ± 8 493 ± 11 Visceral fat pad
Renal 16.2 ± 1.7 22.8 ± 1.1* Epididymal 13.5 ± 1.2 17.3 ± 1.0* Muscles
Gastrocnemius 2.37 ± 0.05 2.47 ± 0.04 Soleus 0.163 ± 0.005 0.170 ± 0.006 Extensor digitorum longus 0.167 ± 0.004 0.169 ± 0.003 Tibialis anterior 0.747 ± 0.012 0.752 ± 0.017 Liver 14.7 ± 0.5 14.9 ± 0.6 Kidneys 2.43 ± 0.12 2.37 ± 0.05 Spleen 0.796 ± 0.040 0.842 ± 0.080 Intestine 7.4 ± 0.1 7.8 ± 0.2 g/kg Carcass composition Protein 194.5 ± 3.3 187.5 ± 3.1 Fat 189.6 ± 13.0 228.6 ± 14.4* Other 70.0 ± 7.0 62.9 ± 6.5 Water 546 ± 7 521 ± 9*
Male Wistar rats were fed with a control diet (n = 10) or a high-fat diet (HF, n = 9) during 5 weeks. After 5 weeks, we measured body, fat pad and tissue weights as well as carcass composition after removal of cited tissues. Mean values ± s.e. are reported. Due to sampling errors, only four to five rats could be used for renal fat pad weight, and seven to nine for epididymal fat pad.
Oxidative stress markers. Lipoperoxidation (LPO) was measured
by the method proposed by Erdelmeier et al. (28). In this assay, two molecules of malondialdeyde, one of the main final product of LPO, react with N-methyl-2-phenilindole 10.3 mmol/l at 45 °C and pH 3.6 to produce a stable complex that has maximum absorbance at 586 nm. The determination was carried out in basal condition and after stimulation of LPO by using CuSO4 0.5 mmol/l at 37 °C for 1 h.
Protein carbonyl content was measured according to ref. 29 after reaction with DNPH 10 mmol/l at 25 °C for 1 h. Streptomycine sulfate 1% was used to decrease nucleic acid contamination.
statistical analysis
Values presented are means ± s.e. Statistical evaluation of the data was performed by Student’s t-test (StatView statistical software package,
version 5; SAS Institute, Cary, NC). The level of significant difference was set at P < 0.05.
results
energy intake and body weight gain
Dry matter intake was similar in control and HF-fed rats (data not shown). However, because HF-diet energy density was higher than control diet (Table 1), energy intake was significantly higher (+28%) in HF rats compared to control rats (P < 0.001; Figure 1). At the beginning of the experi-mental period, control and HF rats had similar mean body weights (322.9 ± 2.3 g). Body weight significantly increased during the experimental period (Figure 2) in both groups table 3 effect of high-fat feeding on rat muscle and liver protein metabolism
EDL Liver
Control HF Control HF
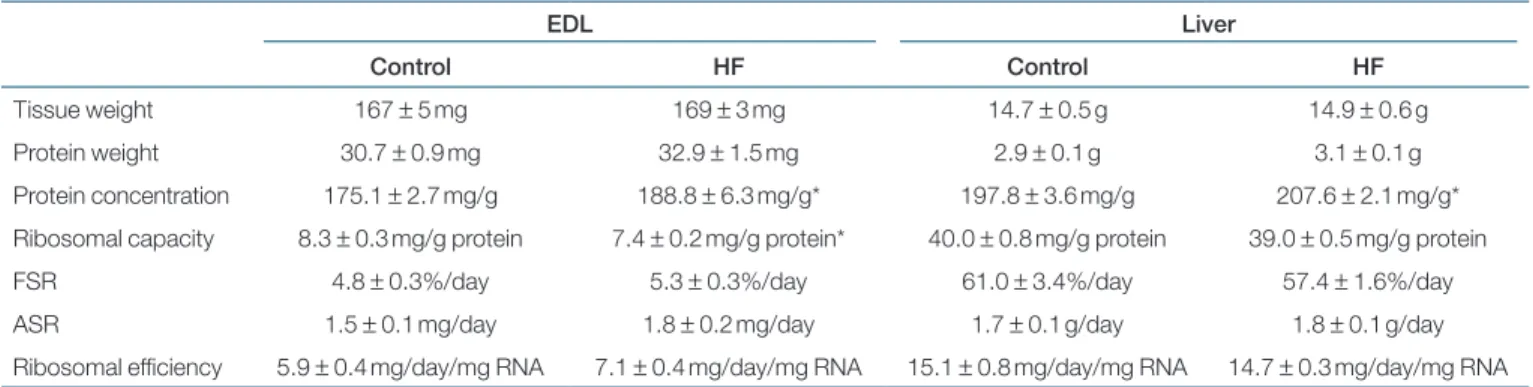
Tissue weight 167 ± 5 mg 169 ± 3 mg 14.7 ± 0.5 g 14.9 ± 0.6 g Protein weight 30.7 ± 0.9 mg 32.9 ± 1.5 mg 2.9 ± 0.1 g 3.1 ± 0.1 g Protein concentration 175.1 ± 2.7 mg/g 188.8 ± 6.3 mg/g* 197.8 ± 3.6 mg/g 207.6 ± 2.1 mg/g* Ribosomal capacity 8.3 ± 0.3 mg/g protein 7.4 ± 0.2 mg/g protein* 40.0 ± 0.8 mg/g protein 39.0 ± 0.5 mg/g protein FSR 4.8 ± 0.3%/day 5.3 ± 0.3%/day 61.0 ± 3.4%/day 57.4 ± 1.6%/day ASR 1.5 ± 0.1 mg/day 1.8 ± 0.2 mg/day 1.7 ± 0.1 g/day 1.8 ± 0.1 g/day Ribosomal efficiency 5.9 ± 0.4 mg/day/mg RNA 7.1 ± 0.4 mg/day/mg RNA 15.1 ± 0.8 mg/day/mg RNA 14.7 ± 0.3 mg/day/mg RNA
Male Wistar rats were fed with a control diet (n = 10) or a high-fat diet (n = 9) during 5 weeks. After 5 weeks of experiment, during the feeding period, in vivo fed-state tissue protein synthesis rates were measured using a flooding dose of valine injected via a lateral tail vein 20 min before killing. Mean values ± s.e. are reported.
*Significant difference vs. controls, with P < 0.05. Three rats (two control rats and one HF rat) were used for measurement of basal enrichment.
0 5 10 15 20 Control HF Plasma insulin (ng/ml) a 0 0,5 1 1,5 2 Control HF
Plasma total cholesterol
(mmol/l) c 0 1 2 3 Control HF
Plasma triglycerides (mmol/l)
e 22 24 26 Control HF Plasma α 2M ( µg/ml) f 0 0.5 1 Control HF Plasma HDL-cholesterol (mmol/l) d 0 4 8 12 Control HF
Plasma glucose (mmol/l)
b
Figure 3 Effect of high-fat diet on (a) plasma insulin, (b) glucose, (c) total cholesterol, (d) high-density lipoprotein (HDL)-cholesterol, (e) triglycerides,
and (f) α-2-macroglobulin concentrations in control and high-fat fed rats. Male Wistar rats were fed with a control diet (n = 10) or a high-fat diet (n = 9)
but it increased more in HF rats than in control rats. From day 10 to the end of the experimental period, body weight was significantly higher in HF rats than in control rats. At the end of the experiment, these weights were 455.2 ± 7.6 g and 492.9 ± 10.5 g in control and HF rats, respectively, and were significantly different (P < 0.01).
Body composition
Increasing the lipid content of the diet from 10 to 45% of energy significantly increased the weight of renal and epididy-mal fat pads by 41 and 28% (P < 0.05), respectively (Table 2). However, we observed no diet-related effects in liver, muscles, kidneys, spleen, and intestine’s weights.
High-fat diet significantly affected carcass composition (Table 2). The carcass of rats in HF group had significantly more fat than those of control group. Carcass protein content was not different in HF rats compared with control rats. However, water content was significantly higher in control rats than in HF rats. Muscle and liver protein metabolism
Among all variables measured in liver and muscle regarding protein metabolism (Table 3), i.e., total protein content, pro-tein concentration, ribosomal capacity, FSR, absolute synthesis
rates, ribosomal efficiency, the significant effects observed were a lower EDL ribosomal capacity (−10%) and an increase in EDL (+8%) and liver (+5%) protein concentrations in HF rats compared with control rats.
Plasma parameters
As observed for liver and muscle protein metabolism, there was no diet effect for all measured plasma parameters (Figure 3) i.e., insulin, glucose, total cholesterol, high-density lipoprotein cholesterol, triglycerides, α-2-macroglobulin.
Free plasma amino acid concentrations
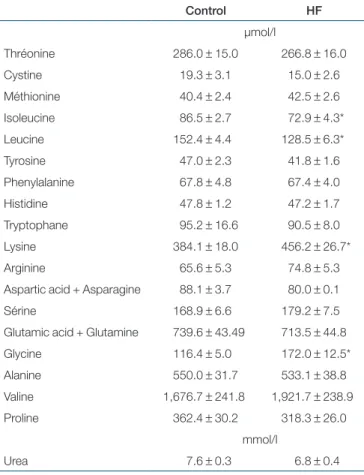
During fed state, high-fat diet significantly affected plasma concentration of leucine (−16%), isoleucine (−16%), lysine table 4 Fed state plasma urea and amino acid concentrations
in control and high-fat fed rats
Control HF µmol/l Thréonine 286.0 ± 15.0 266.8 ± 16.0 Cystine 19.3 ± 3.1 15.0 ± 2.6 Méthionine 40.4 ± 2.4 42.5 ± 2.6 Isoleucine 86.5 ± 2.7 72.9 ± 4.3* Leucine 152.4 ± 4.4 128.5 ± 6.3* Tyrosine 47.0 ± 2.3 41.8 ± 1.6 Phenylalanine 67.8 ± 4.8 67.4 ± 4.0 Histidine 47.8 ± 1.2 47.2 ± 1.7 Tryptophane 95.2 ± 16.6 90.5 ± 8.0 Lysine 384.1 ± 18.0 456.2 ± 26.7* Arginine 65.6 ± 5.3 74.8 ± 5.3 Aspartic acid + Asparagine 88.1 ± 3.7 80.0 ± 0.1 Sérine 168.9 ± 6.6 179.2 ± 7.5 Glutamic acid + Glutamine 739.6 ± 43.49 713.5 ± 44.8 Glycine 116.4 ± 5.0 172.0 ± 12.5* Alanine 550.0 ± 31.7 533.1 ± 38.8 Valine 1,676.7 ± 241.8 1,921.7 ± 238.9 Proline 362.4 ± 30.2 318.3 ± 26.0 mmol/l Urea 7.6 ± 0.3 6.8 ± 0.4
Male Wistar rats were fed with a control (n = 10) or a high-fat diet (HF, n = 9) during 5 weeks. Mean free plasma amino acid concentrations ± s.e. measured in the fed state are presented. The value for plasma valine is artificially high due to the injection of the flooding dose containing labeled and unlabeled valine. *Significant difference vs. controls, with P < 0.05.
table 5 antioxidant enzyme activities and oxidative damage in soleus muscle and liver
Control HF
Tissue weight (g)
Liver 14.7 ± 0.5 14.9 ± 0.6 Soleus 0.163 ± 0.005 0.170 ± 0.006 Antioxydant enzyme activities
Catalase (nmol H2O2/(min × mg protein))
Liver 104.2 ± 6.0 109.2 ± 5.2 Soleus 42.9 ± 6.0 24.9 ± 4.1* GR (nmol NADPH/(min × mg protein))
Liver 30.6 ± 1.9 29.7 ± 1.8 Soleus 23.1 ± 5.1 16.2 ± 2.2 GSH-Px (nmol NADPH/(min × mg protein))
Liver 716 ± 49 750 ± 93 Soleus 367 ± 74 306 ± 49 Cu/Zn SOD (U/mg protein)
Liver 11.0 ± 1.6 6.0 ± 1.6* Soleus 16.4 ± 2.0 11.4 ± 1.0* Mn SOD (U/mg protein)
Liver 7.8 ± 1.1 8.1 ± 0.6 Soleus 3.4 ± 1.2 2.2 ± 0.5 LPO basal (µmol MDA/mg protein)
Liver 2.8 ± 0.4 3.5 ± 0.5 Soleus 3.0 ± 0.7 3.0 ± 0.6 LPO stimulated (µmol MDA/mg protein)
Liver 15.0 ± 1.5 13.2 ± 0.7 Soleus 7.7 ± 1.4 6.3 ± 0.7 Protein carbonyl content (nmol/mg protein)
Liver 3.7 ± 0.3 3.9 ± 0.3 Soleus 2.9 ± 0.4 2.4 ± 0.3
Male Wistar rats were fed with a control (n = 10) or a high-fat diet (HF, n = 9) during 5 weeks. After 5 weeks, catalase, glutathione reductase (GR), glutathione peroxidase (GSH-Px), Cu/Zn and Mn dependent superoxide dismutase (SOD) activities were measured as well as lipoperoxidation (LPO) and protein oxidative damage (protein carbonyl content). Mean values ± s.e. are reported.
(+19%), and glycine (+48%) in HF rats compared with control rats. Plasma concentrations of other amino acid and urea were not significantly different between the two groups of rats (Table 4).
oxidative stress
In soleus muscle, high-fat diet reduced catalase and Cu/Zn SOD activities compared with control rats, whereas MnSOD, glutathione reductase and glutathione peroxidase activities and LPO and protein carbonyl content were not changed by the high-fat diet (Table 5). In liver, only Cu/Zn SOD activity was significantly lower in HF rats compared with control rats (Table 5).
dIscussIon
The aim of the present study was to determine the impact of chronic excessive energy intake on protein synthesis rates in adult animals. It is a complex question. Indeed, it is known that for a given protein intake, when energy intake is too low, supplementation in energy allows a sparing of protein and a stimulation of protein synthesis rates. In growing animals, such an effect could be detected even when the basal diet sup-plied near adequate energy intake (7). Thus, it is questionable whether such an effect can still be observed in adult subjects who consume chronically an excessive amount of energy.
However, a chronic consumption of excessive energy leads to obesity. And, obesity leads to hypercholesterolemia, high plasma triglyceride, impaired fasting glucose, insulin resist-ance (4,30), oxidative stress (11), and increased levels of inflammatory markers (2,3). Insulin resistance and inflamma-tion (in close relainflamma-tion with oxidative stress) in particular can affect protein metabolism (8–11). Thus, to analyze the effect of chronic excessive energy intake on protein synthesis without confounding factors, it is necessary to have a model without obesity-associated metabolic alterations.
In the current study, feeding young Wistar rats with HF diet during 5 weeks led to an increase in body weight and adipos-ity. However, we observed no difference with control rats in fed-state plasma triglyceride, total cholesterol, high-density lipoprotein cholesterol, insulin, and glucose concentrations. Comparable values obtained in similar diet-induced model of obesity were often obtained in the postabsorptive state. However, an anomaly of glucose/insulin metabolism was usually detected (18,31). Such an alteration was also detected in human studies (8,12,13,32). However, there was not always an alteration of protein synthesis rates in these studies. In insu-lin clamp studies, a defect in the ability of insuinsu-lin to stimulate protein synthesis was detected in obese subjects (8), but not always (12,33). In addition, whole-body and muscle protein synthesis rates were not modified in type 2 diabetes (34). Thus, although insulin resistance for glucose disposal is frequent during obesity, it can occur independently of insulin resistance for protein synthesis. Considering this and the fact that plasma glucose and insulin concentrations were unchanged in our study, it is likely that there was no insulin resistance for protein synthesis in the present study.
It is also known that inflammation can have independ-ently a strong impact on protein turnover (9). In our study, plasma α-2-macroglobulin level, a good rat marker of inflam-mation (21) was not different between HF and control rats. Similarly, no oxidative damage was observed in HF rats. Only tissue Cu/Zn SOD and catalase activities were lower in HF rats. Thus, it seems that another major confounding factor associated with increased adiposity regarding protein metab-olism, i.e., inflammation/oxidative stress was not present in our study.
Thus, we show that in the absence of associated metabolic disorder, in adult slowly growing rats, chronic excessive energy intake does not stimulate fed-state protein synthesis rates in liver and EDL muscle. To our knowledge, there were no stud-ies using similar conditions (diet-induced obesity, fed state, healthy, adult rats). When analyzing the data obtained in obese or fat fed human/animals, conflicting results were obtained (all human data were adjusted to lean body mass):
• In the postabsorptive state: two studies obtained similar whole-body leucine flux, oxidation, and nonoxidative dis-posal comparing lean and obese human subjects (12,13), whereas in another study higher rates were obtained in obese than in lean subjects (8). In animals: (i) in young growing rats in the postabsorptive state, liver and tibialis anterior protein synthesis rates were stimulated in obese vs. control rats (17); (ii) in older overnight fasted rats, an increase in energy intake had no effect on tibialis ante-rior muscle (31) and gastrocnemius muscle (18) protein synthesis rates, but increased soleus muscle (31) protein synthesis rates; (iii) gastrocnemius protein synthesis rates were similar in lean and obese Zucker rats (33); (iv) whole body protein synthesis rates increased in obese mice compared to lean mice (35).
• In response to insulin and/or amino acid infusion: in humans, the response of protein synthesis to amino acids was maintained in obese subjects (12), but the response to insulin was found unchanged or decreased during insulin clamp (8,12). In rat muscle, there was a higher response to insulin infusion in obese than in lean Zucker rats (33).
• In the fed state: in children, there was no difference in whole body protein synthesis rates between obese and control subjects (32).
Such diversity in results obtained could be related to varia-tions in subjects (human/animal, age), sample studied (whole body, liver, muscles with different muscle types) and methods (measurement of protein synthesis), but, as already said, could also be related with variations in the apparition of metabolic alterations associated with obesity.
Analysis of plasma amino acid concentrations confirms that there were little metabolic modifications after HF feeding. A significant difference was detected for only four amino acids, with a significant increase (glycine, lysine) or a signifi-cant decrease (isoleucine, leucine) in HF rats vs. controls. These
differences are not related with differences in protein metabolism because all rats consumed the same amount of the same protein and that synthesis rates were not different between groups. An increase in plasma amino acid level (and leucine in particular) is often found when comparing obese and normal animal or human subjects in the postabsorptive state, due to a lower abil-ity to metabolize amino acid hydrocarbon skeletons (36–39). However, a specific decrease in branched-chain amino acid has already been observed in normal rats fed an excessive amount of energy (40). For an adequate energy intake, the substitution of carbohydrate by fat induced a decrease in gluconeogenic amino acids like alanine, glycine, serine, threonine, cystine, glutamate, glutamine, histidine, proline, arginine, methionine, valine, aspartate, and asparagine in piglets (41). In our case, high-fat feeding did not induce a lower ability to metabolize amino acid hydrocarbon skeletons (no increase in total amino acid plasma level) and the presence of sucrose in the diet probably prevented a decrease in gluconeogenic amino acids.
It is now recognized that obesity represents a low-grade chronic inflammatory state because adipose tissue secretes proinflammatory cytokines such as TNF-α and IL-6 (42). Obesity, as inflammation, is also associated with oxidative stress (11). But what is the initial phenomenon leading to metabolic alterations? Is it inflammation? Is it oxidative stress? In the present study, there were no metabolic alterations. No inflammation was detected. However, it is interesting to note that Cu/Zn SOD and catalase activities were reduced by high-fat feeding. Catalase is present in peroxisome, where high-fatty acids are metabolized. These lower antioxidant activities may be the initial imbalance susceptible to induce future metabolic altera-tions. However, nothing is simple with oxidative stress: it was shown that overexpression of cellular glutathione peroxidase provoked insulin resistance and obesity in mice (43). Further studies will be necessary to understand the mechanisms of installation of metabolic alterations in response to excessive energy intake.
In conclusion, HF feeding during 5 weeks in young Wistar rats increases rat adiposity without leading to alterations in lipid profile, glucose concentration, inflammation, or oxidative stress. This excessive energy intake did not lead to a stimula-tion of liver and muscle postprandial synthesis rates which were stimulated to a similar extent by feeding in control rats. acKnowledgMents
This work was supported by the Agence Nationale de la Recherche (ANR) in France. We thank the study participants for time and the success of this project.
dIsclosure
The authors declared no conflict of interest.
© 2009 The Obesity Society reFerences
1. Pischon N, Heng N, Bernimoulin JP et al. Obesity, inflammation, and periodontal disease. J Dent Res 2007;86:400–409.
2. Barter P, McPherson YR, Song K et al. Serum insulin and inflammatory markers in overweight individuals with and without dyslipidemia.
J Clin Endocrinol Metab 2007;92:2041–2045.
3. Shoelson SE, Herrero L, Naaz A. Obesity, inflammation, and insulin resistance. Gastroenterology 2007;132:2169–2180.
4. Zhao S, Chu Y, Zhang C et al. Diet-induced central obesity and insulin resistance in rabbits. J Anim Physiol Anim Nutr (Berl) 2008;92:105–111. 5. Prentice A. Are defects in energy expenditure involved in the causation of
obesity? Obes Rev 2007;8(Suppl 1):89–91.
6. Welle S, Nair KS. Relationship of resting metabolic rate to body composition and protein turnover. Am J Physiol 1990;258:E990–E998.
7. Reeds PJ, Fuller MF, Cadenhead A, Lobley GE, McDonald JD. Effects of changes in the intakes of protein and non-protein energy on whole-body protein turnover in growing pigs. Br J Nutr 1981;45:539–546.
8. Chevalier S, Burgess SC, Malloy CR et al. The greater contribution of gluconeogenesis to glucose production in obesity is related to increased whole-body protein catabolism. Diabetes 2006;55:675–681.
9. Lang CH, Frost RA, Vary TC. Regulation of muscle protein synthesis during sepsis and inflammation. Am J Physiol Endocrinol Metab 2007;293: E453–E459.
10. Steinberg GR. Inflammation in obesity is the common link between defects in fatty acid metabolism and insulin resistance. Cell Cycle 2007;6:888–894. 11. Furukawa S, Fujita T, Shimabukuro M et al. Increased oxidative
stress in obesity and its impact on metabolic syndrome. J Clin Invest 2004;114:1752–1761.
12. Luzi L, Castellino P, DeFronzo RA. Insulin and hyperaminoacidemia regulate by a different mechanism leucine turnover and oxidation in obesity.
Am J Physiol 1996;270:E273–E281.
13. Solini A, Bonora E, Bonadonna R, Castellino P, DeFronzo RA. Protein metabolism in human obesity: relationship with glucose and lipid metabolism and with visceral adipose tissue. J Clin Endocrinol Metab 1997;82:2552–2558. 14. Jensen MD, Haymond MW. Protein metabolism in obesity: effects of body
fat distribution and hyperinsulinemia on leucine turnover. Am J Clin Nutr 1991;53:172–176.
15. Welle S, Barnard RR, Statt M, Amatruda JM. Increased protein turnover in obese women. Metabolism 1992;41:1028–1034.
16. Welle S, Statt M, Barnard R, Amatruda J. Differential effect of insulin on whole-body proteolysis and glucose metabolism in normal-weight, obese, and reduced-obese women. Metabolism 1994;43:441–445.
17. Estornell E, Cabo J, Barber T. Protein synthesis is stimulated in nutritionally obese rats. J Nutr 1995;125:1309–1315.
18. Anderson SR, Gilge DA, Steiber AL, Previs SF. Diet-induced obesity alters protein synthesis: tissue-specific effects in fasted versus fed mice.
Metabolism 2008;57:347–354.
19. Mosoni L, Valluy MC, Serrurier B et al. Altered response of protein synthesis to nutritional state and endurance training in old rats. Am J Physiol 1995;268:E328–E335.
20. Smith PK, Krohn RI, Hermanson GT et al. Measurement of protein using bicinchoninic acid. Anal Biochem 1985;150:76–85.
21. Mayot G, Vidal K, Martin JF et al. Prognostic values of α2-macroglobulin, fibrinogen and albumin in regards to mortality and frailty in old rats. Exp
Gerontol 2007;42:498–505.
22. Deeg R, Ziegenhorn J. Kinetic enzymic method for automated determination of total cholesterol in serum. Clin Chem 1983;29:1798–1802.
23. Lowry OH, Rosebrough NJ, Farr AL, Randall RJ. Protein measurement with the Folin phenol reagent. J Biol Chem 1951;193:265–275.
24. Aebi H. Catalase in vitro. Methods Enzymol 1984;105:121–126. 25. Flohe L, Gunzler WA. Assays of glutathione peroxidase. Methods Enzymol
1984;105:114–121.
26. Carlberg I, Mannervik B. Glutathione reductase. Methods Enzymol 1985;113:484–490.
27. Flohe L, Otting F. Superoxide dismutase assays. Methods Enzymol 1984;105:93–104.
28. Erdelmeier I, Gerard-Monnier D, Yadan JC, Chaudiere J. Reactions of N-methyl-2-phenylindole with malondialdehyde and 4-hydroxyalkenals. Mechanistic aspects of the colorimetric assay of lipid peroxidation.
Chem Res Toxicol 1998;11:1184–1194.
29. Levine RL, Garland D, Oliver CN et al. Determination of carbonyl content in oxidatively modified proteins. Methods Enzymol 1990;186:464–478. 30. Buettner R, Parhofer KG, Woenckhaus M et al. Defining high-fat-diet
rat models: metabolic and molecular effects of different fat types. J Mol
Endocrinol 2006;36:485–501.
31. Chanseaume E, Giraudet C, Gryson C et al. Enhanced muscle mixed and mitochondrial protein synthesis rates after a high-fat or high-sucrose diet.
32. Schutz Y, Rueda-Maza CM, Zaffanello M, Maffeis C. Whole-body protein turnover and resting energy expenditure in obese, prepubertal children.
Am J Clin Nutr 1999;69:857–862.
33. Fluckey JD, Pohnert SC, Boyd SG et al. Insulin stimulation of muscle protein synthesis in obese Zucker rats is not via a rapamycin-sensitive pathway.
Am J Physiol Endocrinol Metab 2000;279:E182–E187.
34. Halvatsiotis P, Short KR, Bigelow M, Nair KS. Synthesis rate of muscle proteins, muscle functions, and amino acid kinetics in type 2 diabetes.
Diabetes 2002;51:2395–2404.
35. Muramatsu T, Nagai N, Kino K, Okumura J, Tasaki I. Whole-body protein synthesis and amino acid metabolism in genetically obese and proteinuric mice. Nutr Rep Int 1985;32:1371–1377.
36. Marchesini G, Bianchi G, Rossi B, Muggeo M, Bonora E. Effects of hyperglycaemia and hyperinsulinaemia on plasma amino acid levels in obese subjects with normal glucose tolerance. Int J Obes Relat Metab Disord 2000;24:552–558.
37. Rafecas I, Esteve M, Remesar X, Alemany M. Plasma amino acids of lean and obese Zucker rats subjected to a cafeteria diet after weaning. Biochem
Int 1991;25:797–806.
38. Vila R, Granada ML, Gutierrez RM et al. Short-term effects of a hypocaloric diet on nitrogen excretion in morbid obese women. Eur J Clin Nutr 2001;55:186–191.
39. She P, Van Horn C, Reid T et al. Obesity-related elevations in plasma leucine are associated with alterations in enzymes involved in branched-chain amino acid metabolism. Am J Physiol Endocrinol Metab 2007;293:E1552–E1563. 40. Calles-Escandon J, Cunningham J, Felig P. The plasma amino acid
response to cafeteria feeding in the rat: influence of hyperphagia, sucrose intake, and exercise. Metabolism 1984;33:364–368.
41. Ponter AA, Cortamira NO, Seve B, Salter DN, Morgan LM. The effects of energy source and tryptophan on the rate of protein synthesis and on hormones of the entero-insular axis in the piglet. Br J Nutr 1994;71:661–674. 42. Vilarrasa N, Vendrell J, Sanchez-Santos R et al. Effect of weight loss induced
by gastric bypass on proinflammatory interleukin-18, soluble tumour necrosis factor-α receptors, C-reactive protein and adiponectin in morbidly obese patients. Clin Endocrinol (Oxf) 2007;67:679–686.
43. McClung JP, Roneker CA, Mu W et al. Development of insulin resistance and obesity in mice overexpressing cellular glutathione peroxidase. Proc Natl