Bimetallic Bars with Local Control of Composition by
Three-Dimensional Printing
by
Ratchatee Techapiesancharoenkij B.S., Materials Science and Engineering
Northwestern University, June 2001
Submitted to the Department of Materials Science and Engineering in Partial Fulfillment of the Requirements for the Degree of Master of Science in Materials Science and
Engineering at the
Massachusetts Institute of Technology February 2004
© 2004 Massachusetts Institute of Technology All rights reserved
Signature of Author……… Department of Materials Science and Engineering December 17, 2003 Certified by………
Samuel M. Allen POSCO Professor of Physical Metallurgy
Thesis Supervisor Certified by………
Emanuel M. Sachs Fred Fort Flowers’ 41 and Daniel Fort Flowers’ 41 Professor of Mechanical Engineering
Thesis Supervisor Accepted by………...
Harry L. Tuller Professor of Ceramics and Electronic Materials Chairman, Department Committee on Graduate Students
Bimetallic Bars with Local Control of Composition by Three-Dimensional Printing
by
Ratchatee Techapiesancharoenkij
Submitted to the Department of Materials Science and Engineering on December 17, 2003 in partial fulfillment of the requirements for the
Degree of Master of Science in Materials Science and Engineering
Abstract
Three Dimensional Printing (3DP) is a process that enables the fabrication of geometrically complex parts directly from computer-aided design (CAD) models. The success of 3DP as an alternative manufacturing technology to bulk machining of materials for complex parts has been demonstrated. By proof of concept, 3DP has demonstrated the ability to create parts with Local Control of the Composition (LCC). LCC allows tailoring the material properties in regions of a part for functional purposes. In this work, LCC was studied and demonstrated by fabricating bimetallic bars consisting of two layers of Fe-Ni alloys with different composition and, hence, different thermal expansion properties; the coefficient of thermal expansion (CTE) of Fe-Ni system is sensitive to its composition.
Two types of the binder/dopant slurries were made for making the LCC bars. One type consisted of dispersions of Fe2O3 particles in water, and the other consisted of dispersion of NiO in water. The LCC bars were successfully made by printing the Fe2O3/NiO slurries into Fe-30Ni base powders. After heat treatment to impart strength to the printed bars, the bars were successfully retrieved from unbound powders. The bars, then, were annealed at 1400 oC for 2 hours for sintering and homogenization. The final composition of the base powders were changed accordingly. In the layers on which an Fe2O3 slurry was printed, the Fe composition of the layers increased on average to 72wt%. Similarly, the Ni composition of the Ni-enriched lyaers of the bars increased on average to 33wt%.
The densification and local homogenization resulting from reduction and sintering treatments were not satisfactory. The major problem was presumably caused by the oxide residues. The presence of the oxide powders was evident from the microprobe measurement. The oxide residues caused the local compositions to be inhomogeneous. As a result, the compositional profiles showed considerable scatter. Moreover, the residues impeded the sintering rate of the bars; the sintering densities of the bars were as small as 78% of the theoretical density.
The resulting bimetallic bars did exhibit bending deflection on uniform heating. However, the bending deflections were much smaller than expected. Evidently, the compositional profiles of the bars critically influence their thermal bending properties. The scatter in the compositional profiles resulted in local variations of CTE in the bars, which degraded the thermal bending properties. A linear elastic model that allows prediction of the deflection as a function of composition profile shows good agreement with the observed deflections in the bimetallic bars with LCC.
Thesis Supervisor: Prof. Samuel M. Allen
Title: POSCO Professor of Metallurgy Prof. Emanuel M. Sachs
TABLE OF CONTENTS ABSTRACT………...3 LIST OF FIGURES………...7 LIST OF TABLES..……….………...9 ACKNOWLEDGEMENTS..……….……….………10 CHAPTER 1: INTRODUCTION...11
1.1 Three dimensional printing: Technology background...11
1.2 Motivation ...12
1.3 Methodology...14
1.4 Thesis direction and goals...15
CHAPTER 2: DOPANT SLURRY ...16
2.1 Introduction ...16
2.2 Materials system selections ...17
2.3 Experimental Procedure...19
2.3.1 Introduction ...19
2.3.2 Oxide reduction testing: Thermal Gravimetric Analysis (TGA)...19
2.3.3 Dispersion stability test and settling experiment: ...21
2.3.4 Preliminary strength testing and determination of Tstrength...21
2.3.5 Printing ability test ...22
2.4 Oxide reduction results and interpretation...22
2.4.1 Background ...22
2.4.2 TGA results and discussion...24
2.5 Dispersion of metal oxide powders ...26
2.5.1 Background ...26
2.5.2 Nickel Oxide dispersion...28
Dispersion stability and settling tests ...28
Preliminary jetting test ...33
Preliminary Strength test ...37
CHAPTER 3: PRINTED BIMETALLIC BAR ...43
3.1 Introduction ...43
3.2 Experimental procedure ...44
3.2.1 Density measurement ...44
3.2.2 Alloy-composition measurement: Electron Microprobe ...45
3.2.3 Printing and retrieval procedures ...46
3.2.4 Bending measurement ...47
3.3 Particle size distribution and sintering profiles of the –44 micron Fe-30Ni powders...49
3.4 Preliminary printing preparation and tests...52
3.5 Printing results and discussion...54
3. 6 Part retrieval and strength results and discussion ...58
3.7 Oxide reduction results and discussion ...60
3.7.1 Background ...60
3.7.2 Results and discussion ...62
3.8 Sintering and homogenization ...64
3.8.1 Background ...64
3.8.2 Results and discussion ...69
Sintering...69
Homogenization ...73
3.9 Thermal bending...83
3.9.1 Background ...83
3.9.2 Results and Interpretation ...85
3.10 Summary...96
CHAPTER 4 DISCUSSION ...98
CHAPTER 5 CONCLUSIONS AND FUTURE WORK...103
5.1 Conclusion...103
5.2 Future work ...104
REFERENCES ...106
APPENDICES...108
A.2 Calculation of a composition change by a given amount of NiO or Fe2O3 addition ...109
A.3 Calculation of required volume fractions of Fe2O3/NiO in the slurries...110
A.4 Calculation for linear shrinkage from densification data...110
A.5 Plot of Bessel Function J0...111
LIST OF FIGURES Chapter 1
Figure 1.1 The schematic illustration of the 3DP process. ... 12
Figure 1.2 Thermal Expansion Coefficients as a function of Ni contents in an Fe-Ni alloy... 13
Figure 1.3 Schematic illustration of the fabrication of a Fe-Ni bimetallic bar with LCC. ... 14
Chapter 2 Figure 2.1 Illustration of the comparison between polymeric and reactive binders... 16
Figure 2.2 Illustration of the setup of the TGA machine... 20
Figure 2.3 Ellingham Diagram ... 23
Figure 2.4 TGA plot of the weight fraction of the NiO sample vs. temperature. ... 25
Figure 2.5 TGA plot of the weight fraction of the Fe2O3 sample vs. temperature. ... 25
Figure 2.6 Demonstration of the settling behavior of particles in a slurry under centrifuging force: (A) a poor dispersing quality results in low-density flocs, (B) an average dispersing quality, and (C) a stable dispersing quality results in a denser flocculation and high packing fraction... 27
Figure 2.7 Illustration of the setup of the recirculation system. ... 35
Chapter 3 Figure 3.1 Schematic illustration for density measurement... 45
Figure 3.2 The geometries of printed bimetallic bars... 46
Figure 3.3 Schematic illustration of the setup for the bending measurement... 48
Figure 3.4 Particles size distribution of the -44 micron Fe-30wt%Ni powders... 49
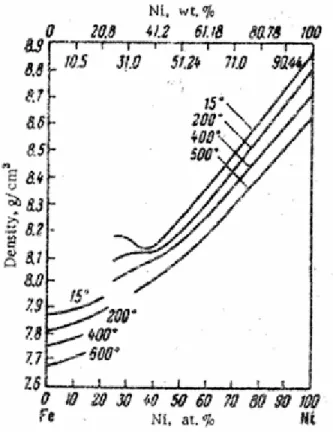
Figure 3.5 Variation of the density of Fe-Ni alloys with the composition and temperature. ... 50
Figure 3.6 Phase diagram of Fe-Ni alloys ... 51
Figure 3.7 Pictures of printing lines comparing between perfect printing lines (A) and “Balling effect” printing lines (B)... 53
Figure 3.8 The printed bars before firing and retrieval processes. ... 58
Figure 3.9 The retrieved bars (A) after firing at 400 oC for 1 hour and (B) after firing more at 800 oC for 1 hour. ... 58
Figure 3.10 Simplified illustration of the reduction process... 61
Figure 3.11 Oxygent contents in the printed bars... 63
Figure 3.12 Illustration of the simplifications for the calculations of the local homogenization. 65 Figure 3.13 Initial condition for Equation 3.3. ... 66
Figure 3.14 Evolution of a Ni concentration of every particle over time. ... 67
Figure 3.15 the compositional profile of the bimetal bars... 69
Figure 3.16 Densification of all the bars ranked from low to high... 70
Figure 3.17 Microstructures of (A) B1 and (B) B5. ... 71
Figure 3.18 An oxygen content comparison... 72
Figure 3.19 Nickel contents in the HIP and the oxidized Fe-30Ni samples. ... 73
Figure 3.20 Microprobe measurement traces... 74
Figure 3.22 The column plot of concentration differences for all the bars... 76
Figure 3.23 Comparison between the thicknesses of (A) B2 and (B) B3... 77
Figure 3.24 Comparison between the calculated final thicknesses and the measured ones. ... 78
Figure 3.25 Column plot of the calculated initial thicknesses and the measured final ones. ... 79
Figure 3.26 The illustration for the first printing path on the foundation layer... 80
Figure 3.27 Schematic illustration of the printing on every layer. ... 81
Figure 3.28 A simple bimetallic strip while uniformly heated. ... 84
Figure 3.29 Bimetallic bending measurement setup... 84
Figure 3.30 CTE vs. compositions at different temperatures. ... 85
Figure 3.31 Measured bending deflections for all bars... 86
Figure 3.32 The picture of B2 while bending as heated ... 86
Figure 3.33 Comparison between the measured bending and calculated bending deflections from the 1st model. ... 88
Figure 3.34 An example of the compositional profile of the 2nd model... 89
Figure 3.35 Linear regression analysis example... 91
Figure 3.36 The CTE differences between the two sheets and the CTE gradients at 200 oC... 92
Figure 3.37 The comparision plot of the experimental, 1st model and 2nd model results... 93
Figure 3.38 The illustration of the composition profile for the 3rd model ... 94
Figure 3.39 The comparison of all the results from all models and the experiment... 96
Appendices Figure A1 TGA plot of the weight fraction of Fe3O4 vs. temperature ... 108
Figure A2 TGA plot of the weight fraction of Fe3O4 vs. time ... 109
LIST OF TABLES Chapter 2
Table 2.1: Experimental data of the dispersions with the dispersants from Duramax ... 29
Table 2.2: Experimental data of the D3005 dispersions ... 29
Table 2.3: Experimental data of the 5 vol% NiO dispersions... 31
Table 2.4: Experimental data of the D3005 dispersions milled by zirconia media for different times. ... 33
Table 2.5: Terminal velocity and settling time for different particle sizes... 34
Table 2.6: Experimental data of the gamma-Fe2O3 dispersions ... 39
Table 2.7: Experimental Data of the alpha-Fe2O3 dispersions ... 40
Chapter 3 Table 3.1: Density and densification data of the Fe-30Ni samples with different sintering temperature and time. ... 52
Table 3.2: Printing and Heating profiles for the bimetallic bars... 57
Table 3.3: Sintering profiles of the oxidized Fe-30Ni powders... 69
Table 3.4: Thickness profiles for all the bars: thickness, thickness fraction. ... 76
Table 3.5: Densification and linear shrinkage data for all the bars. ... 78
Table 3.6: The actual initial thicknesses and measured final thicknesses. ... 79
Table 3.7: The calculated values of the curvature and deflection of the LCC bimetals by the 1st model (Equation 3.10 and 3.11). ... 88
Table 3.8: Calculated curvatures and deflection from the 2nd model (Figure 3.34). ... 91
Table 3.9: The calculated results of the curvature and deflection from the 3rd model (Figure 3.38)... 94
Table 3.10: The data of the CTE differences for the 3rd model. ... 94
Appendices Table A1 Manufacturers’ contact info... 112
ACKNOWLEDGEMENTS
First, I would like to extend my thanks to Prof. Allen for your guidance and support. You always kept me to see a big picture of the project, helped me clarify my work reports in the group meeting, and dedicated your valuable times to revise my thesis.
I would like to thank to Prof. Sachs for providing me many insightful and practical advices to solve several problems and challenges from the project.
Jim Serdy (my 3DP expertise): I am very grateful for all the times you spent on my
project and your two working shirts upon which the green NiO and red Fe2O3 slurries spilled.
Without your helps, I would not be able to make LCC bimetallic bars. Thank you for everything. 3DP members: Alberto, Adam, Brian, Calvin, Chris, Christoph, Laura, Liz, Lukas, Nathan, Vinay. Thanks for being great and supportive and for many useful ideas and help on my project.
MIT staffs: Xin-lin, Neel, John, and Lenny. Without your help, my data would not exist. I would like to acknowledge the cooperation from all the manufacturers for providing powder samples, dispersions, milling media, bimetallic sheets, etc., and for being enthusiastic to answer my inquiries. They are Hood&Co Inc., PA., FerroTech, NH., Novamet, NJ., Bodycote IMT, Inc., MA., Norstone, Inc., PA., Ultrafine Powder Technology Inc., RI., Atlantic Equipment Engineers, NJ., MMR Inc., MA., Ciba, NC., Exxon, TX., and also all the other companies providing help that I did not mention in here.
All of my friends in DMSE: P’Kob, P’Jess, P’Naan, Nok, Lek, P’Oy, P’Ya, Vee, P’Yot, Preston, Albert, and Mark. Thanks for being such great and supportive friends. I am very grateful to have you guys in the same department.
Thanks to my family: Papa, Mama, A, Ple, Ly, and Meaw for your supporting roles from very far away in Thailand. Your blessings always make me confident. Without your support, I wouldn’t be where I am today.
Tip…Thanks for everything: taking care of me while I was writing this thesis, cheering me up, understanding and willing to listen to my problems, making wonderful and delicious dinners for me, being there when I have no one… You fulfill my life.
CHAPTER 1: INTRODUCTION
1.1 Three dimensional printing: Technology background
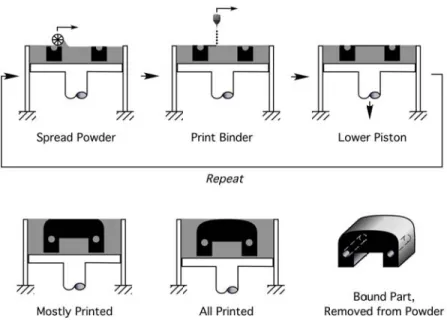
Three Dimensional Printing (3DP), a Solid Freeform Fabrication (SFF) technology invented by MIT, is a process that enables the fabrication of geometrically complex parts directly from computer-aided design (CAD) models.[1-2] The schematic process of 3DP is illustrated in Figure 1.1.[3]
The 3DP process is similar to the mechanism of an ink-jet printer. Instead of ink, a liquid binder, e.g. a polymer adhesive, is printed onto a layer of powder, analogous to a piece of paper. A 3DP machine spreads the first powder layer on a powder bed. Then, a liquid binder is printed onto the first powder layer following a computer-defined pattern. A print head is driven by a computer file containing a three-dimensional (3-D) representation of the part instead of 2-D file as used in an ink-jet printer. When the first powder layer is completely printed, the printed layer is lowered with the powder bed. Next, an additional two-dimensional layer of powder is spread and selectively joined with the binder on the previous powder layer. The process is repeated until the end of the 3-D file. After the process finishes, the unbound powders are removed, for example by a vacuum cleaner and a brush. The remaining glued powders form a 3-D skeleton in the shape of the designed model. Finally, the 3-D skeleton undergoes a strengthening process to ensure that the final 3-D part is strong and durable.
Figure 1.1 The schematic illustration of the 3DP process (Courtesy of Prof. Allen).
1.2 Motivation
The success of 3DP as an alternative manufacturing technology to bulk machining of materials for complex parts has been demonstrated. By using the capability of 3DP technology, one might be able to create parts with Local Control of the Composition (LCC) by selectively printing materials that remain in the part permanently. LCC allows tailoring the material properties in regions of a part corresponding to the designated local composition.[3] For example, one might be able to increase the wear resistance of machining tools by printing carbides at the tool surfaces. As a result, the tools become ultra wear-resistant at the surfaces where most wear occurs, while remaining ductile in the interior.
Two types of applications potentially suitable with LCC are
(1) Gradient Index lenses (GRIN) and (2) metallic components with LCC. GRIN lenses, which refract light by a local variation in composition and, hence, an index of refraction, have been successfully fabricated using the Slurry-based Three-Dimensional Printing (S-3DP) process.[4,5] In the S-3DP process, parts are created in a layer-by-layer build sequence in which a powder bed is created by jetting a ceramic slurry onto a substrate. The as-cast layer is then dried and a binder, which glues the ceramic particles, is selectively deposited in the desired pattern. The S-3DP process is modified to make GRIN lenses by depositing different amounts of
alumina dopant, instead of a binder, into a silica base material. The modified S-3DP offers advantages over conventional GRIN lens processing methods, which include a reduced processing time, improved compositional flexibility, and increased index profile dimensionality.
The fabrication of metallic components with LCC by 3DP is the subject of this thesis. A demonstration of fabrication of geometrically simple metallic parts with LCC was studied first. Specifically, we demonstrated the application of LCC and 3DP by fabrication of bimetallic bars consisting of two mechanically-bonded layers of two different materials with different thermal expansion properties. When the bars are subject to a temperature change, they bend due to the different coefficients of thermal expansion (CTE).[6]
Generally, a bimetallic strip consists of a low CTE alloy bonded to a high CTE alloy. As a result, to make a bimetallic strip with LCC, a material system whose CTE is sensitive to its composition is desired. Such behavior is found in the Fe-Ni alloy system.
The anomalous characteristic of the thermal expansion property of an Iron-Nickel alloy was first discovered by Guillaume in 1897 [7, 8]. He found that the Fe-Ni alloy with 35 at% Ni had a very small thermal expansion coefficient of less than 1.2 x 10⁻⁶ C-1 at a room temperature. Figure 1.2 shows the thermal expansion coefficient curve as a function of composition in an Fe-Ni system [8]. The name Invar (a contraction of “INVARiable”) has been given to the alloys with expansion coefficients in a vicinity of the minimum value.
0 5 10 15 20 25 0 20 40 60 80 100 wt% Ni The rm al Ex pa ns ion C o ef fi ci en t( x10e-6)
Spreading Fe-30Ni powder layer
Differential printing of Fe slurry and Ni slurry
Sintering and local
homogenization
1.3 Methodology
A procedure of the fabrication of an LCC bimetallic bar is schematically shown in Figure 1.3. First, a powder bed of Fe-30wt%Ni powders is spread. Then, an Fe-dopant slurry is printed onto the powder so that the final Fe content increases. By successive printing of such layers, an iron-enriched volume of arbitrary thickness can be produced. Then, by repeating the process with a nickel-dopant slurry, a nickel-enriched volume can be printed resulting in a bimetallic part with regions locally enriched in iron adjacent to regions enriched in nickel. After completion of
printing, the printed bar can be heated at a low temperature (~400 oC) so that the any undesired
materials in both Fe and Ni slurries are eliminated, leaving only small Fe and Ni particles in the bar. The small Fe and Ni particles should sinter faster and at a lower temperature than the larger base Fe-30Ni powders. As a result, these small powders sinter and form interparticle bonds that give the printed part strength. So, one can remove unprinted and excess powders and retrieve the printed bar. After the printed bar is successfully retrieved, it can be heated and annealed at a
high temperature (~1400 oC). At this high temperature, the bar locally homogenizes; the Fe/Ni
elements inter-diffuse from the Fe/Ni dopants to the base powders. At the same time, the bar sinters and densifies. Heated for a suitable time, each region of the bar would be homogenized to different composition and have a final density close to the theoretical densities of the corresponding homogeneous Fe-Ni alloys.
1.4 Thesis direction and goals
The objective of this project was to demonstrate the promise of 3DP to create parts with local control of the composition (LCC) in 3-D. Precisely, we wanted to learn of the capability of 3DP for implementation of LCC. Consequently, using procedures described in the previous section, bimetallic bars from an Fe-Ni system were fabricated by 3DP to demonstrate such capability of 3DP. Therefore, the feasibility of LCC by 3DP could be evaluated through the fabrication of LCC bimetallic bars. The goals of this project, hence, were the following:
1. To find the best approach to fabricate Fe-Ni bimetallic bars by 3DP.
2. To obtain suitable slurries that would perform well as both binders and dopants. 3. To vary the alloy composition and the thermal expansion property across the bars. 4. To be able to locally homogenize the bars and also obtain high densification. 5. To test the thermal bending characteristics of the bars.
6. To be able to understand and explain any unexpected outcomes from the experiments. 7. To overcome any upcoming challenges from the chosen approach. These challenges
will be explained extensively in the later chapters.
8. To evaluate the degree of success of the exploitation of 3DP and LCC to fabricate bimetallic materials.
9. To identify any possible challenges of LCC by 3DP for any other possible applications or future LCC projects.
From the goals stated above, the majority of the work could be categorized into two areas. The first involved the work of making a dopant slurry that could be jetted into the base powders successfully. The second involved the study of the printing process and the characteristics of the printed bimetallic bars. Therefore, this thesis is organized in the following manner. The two areas of the work will be discussed separately in Chapters 2 and 3. In these chapters, I will discuss backgrounds, experimental procedures, data and interpretation. Then, in Chapter 4: Discussion, the results and discussion from Chapter 2 and 3 will be synthesized to evaluate the degree of success and promise of the project. Finally, Chapter 5: Conclusions will show the list of important conclusions of the project and suggestions for future work.
CHAPTER 2: DOPANT SLURRY
2.1 Introduction
In this chapter, we discuss the process of making dopant slurries for printing bimetallic bars. As mentioned in Chapter 1, solutions containing Fe/Ni elements would be used as media to transport and deposit Fe/Ni elements into base Fe-30Ni powders, so that the composition of the base powders could be locally tailored by selective printing.
The dopant slurries would also act as a permanent binder. The concept of a permanent binder is that the binder will react when fired to form interparticle bonds between two base powders and impart strength to the part, as illustrated in Figure 2.1[9]. For this binder system, the entire powder bed, after printing, is fired at a sufficiently high temperature to cause the binder to react and form interparticle bonds while leaving the unprinted regions unaffected. After heating, the part is retrieved from the excess part of the powder bed. As a result, the slurry provides the printed part strength as well as depositing dopant in the part.
Figure 2.1 Illustration of the comparison between polymeric and reactive binders.
Permanent Binder of Metal Oxide Slurry or Metal Salt Solution
Initial Loose Powders
Polymer Binder
Firing
Reduced Metals forming interparticle bonding Firing
Printing
Printing
The first task was to find materials candidates as dopant/binder solutions. The key characteristics of the solutions are that they should:
1. Transport sufficient quantities of Fe/Ni elements into printed parts after removal of unwanted elements/substances by firing; this required that the solutions could easily penetrate the powder bed carrying along Fe/Ni and depositing them in the base powders,
2. Give sufficient differential strength between the parts and unprinted powders after firing and decomposition, so the parts could be retrieved from excess powders by low air flows or brushes,
3. Be printed by a 3DP machine, e.g. they could be jetted through a nozzle without sedimentation or clogging.
In this chapter, the work on making suitable solutions that met all of the above specifications will be presented and discussed.
2.2 Materials system selections
Before finding materials systems for dopant/binder solutions, proper methods to make such solutions must be chosen. There were two types of potentially applicable metal-containing solutions. The first type was a concentrated Fe/Ni salt solution, e.g. nickel nitrate, nickel sulfate, iron sulfate, or iron chloride. Fe/Ni salt solutions can be decomposed to pure iron or nickel elements easily at low temperature. And, there is no “filtering effect” with them, because metal salts completely dissolve in aqueous solvents; the filtering effect occurs when the liquid carrier of the solutions is absorbed into the powder bed but leaves some of the dopant particles filtered out by the top layers of the powder bed.
However, metal salt solutions were not suitable for binder/dopant solutions because of (1) the low residual Fe/Ni amounts from the solutions after decomposition and (2) the poor wetting ability between the salt solutions and Fe-30Ni powders. First, the Fe/Ni amounts from the salt solutions after decomposition were too small to change the Fe/Ni contents of Fe-Ni alloy powders significantly. For example, 0.6 ml of nickel nitrate, whose solubility is 1.23 g/ml at 20
oC, can dissolve in 0.4 ml of water to form 1 ml of a nickel nitrate solution; therefore, the volume
volume percentage of the solution is only 2.74 vol%. Moreover, the metal salt solutions were not absorbed into an Fe-30wt%Ni powder bed easily. This was tested by eye-dropping a drop of a nickel nitrate solution onto a tapped bed of Fe-30Ni powder. The drop formed a stable hemispherical ball on the surface of the powder bed without any sign of being absorbed into the powders. This was because the solution did not wet the powders well due to the high interfacial energy between the solution and the powders. Isopropyl alcohol (IPA) was added to reduce the surface tension of the solution; the surface tension values of IPA and water are 21.79 and 72.8 dyn/cm respectively [10]. Still, the salt solution with the addition of IPA could not be adsorbed into the powder bed. As a result, metal salts were not used in this work.
The other type of dopant/binder solutions considered was a dispersion of Fe/Ni powders, such as carbonyl iron, carbonyl nickel, iron oxide, and nickel oxide, in liquid media. An Fe/Ni dispersion allowed us to print small Fe/Ni particles directly into a powder bed via a liquid carrier. This idea of direct printing of small particles came from the strong dependence on particle size of the sintering driving force. The driving force of sintering is a reduction in surface
energy. Smaller particles have higher surface area per unit volume (Sv). Therefore, the surface
energy per unit volume increases as the diameter of the particles decreases. As a result, the sintering rate of finer particles is faster than that of coarser particles. [11-12] Therefore, when printed directly into a powder bed, sub-micron particles would sinter to one another and to larger -44-micron Fe-30Ni powders at a low temperature to form the interparticle bonds in a printed part. At that low temperature, the large Fe-30Ni powders should not start sintering considerably and should be easily removed if unprinted with the dispersion.
In order to successfully print fine particles by a 3DP machine without clogging a 50-micron nozzle, a stable dispersion of the particles must be made. We decided not to work with carbonyl iron and carbonyl nickel because of their metallic natures. From the past work, metallic powders were poor for making slurries [9]. First, they are ductile, thus, they only deform rather than break into smaller pieces during milling process. Second, they are easily oxidized in water and, hence, are likely contaminated by oxide formation. Finally, the densities of metallic powders are higher than those of oxide powders, hence, metallic powders are harder to disperse in a slurry than oxide powders. Therefore, we chose to work with nickel oxide and iron oxide powders to make dopant/binder slurries instead of iron or nickel powders.
2.3 Experimental Procedure
2.3.1 Introduction
As aforementioned, three key characteristics were desired for good dopant/binder slurries. The first one involved the capability of the slurries that could transport a considerable
amount of Fe/Ni elements into a powder bed. Therefore, the oxide powders (Fe2O3, NiO) must
be able to be decomposed to Fe/Ni elements under reduction atmosphere, e.g. H2 gas,
successfully at a low temperature and in a reasonably short time. Thermal Gravity Analysis
(TGA) was used to test the kinetics of the reduction of Fe2O3 and NiO powders. For the second
characteristic, the slurries should create differential strength between printed parts and excess/unprinted powders after preliminary heat treatment. The slurries must provide sufficient strength to the printed parts at a temperature below the normal sintering temperature of the base powders. The small oxide particles should form bonding necks between large particles at a low enough temperature that the excess/unprinted powders do not sinter and thus allow removal of the printed part from the surrounding loose powder. Therefore, we needed to determine the
maximum temperature, noted as Tmax, that would give sufficient differential strength between the
printed parts and the other unprinted/excess powders, so we could successfully retrieve the parts. The final characteristic of the slurries was their dispersing stability. The slurries should be stable enough that the dispersed oxide powders did not settle too fast. The powders must remain stably dispersed longer than one-half hour before any significant settling. If the slurries were unstable and were poorly dispersed, the powders in the slurries would settle quickly and start to agglomerate into large aggregates, which could clog a print nozzle.
2.3.2 Oxide reduction testing: Thermal Gravimetric Analysis (TGA)
Thermal Gravimetirc Analysis was used to test the reduction of Fe2O3 and NiO to Fe and
Ni respectively. TGA is a method to measure weight loss during a heating process. This technique provides information about the temperature-dependent weight loss of an oxide. In this
oC/min) and its weight is measured using a balance.[13] The machine setup is shown in Figure
2.2. The procedure of TGA analysis included:
1. The weight of an empty Pt dish in a closed furnace was measured for record.
2. The furnace was opened. An oxide sample was placed on the Pt dish suspended with the balance on the top.
3. The furnace was lifted up to cover the Pt dish. 5%H2-Ar gas then flowed through the
furnace after it had been tightly closed.
4. The weight of the Pt dish with the sample was measured.
5. A heating profile was input. The ramping rate was 10 oC/min. Then, the furnace
started to heat up accordingly.
6. The weights of the Pt plate with the sample as temperature increased were measured and recorded.
7. After the heating process was completed, the records of weights, temperatures, and time were used for analysis.
Furnace
Oxide samples on platinum plate
Weight balance
Gas flow out
2.3.3 Dispersion stability test and settling experiment:
The quality of the slurries was verified. If slurries sit undisturbed for a long time, dispersed solid particles will gradually settle out. Stable slurries with sub-micron particles can last long before any significant settling. Therefore, in this work, the stability of the slurries was checked by observing their settling behavior.
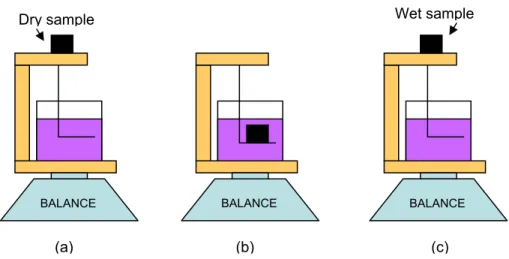
The packing fraction of settled solids in slurries can also be used to check the quality of the slurries. The packing fraction was measured by the following procedure:
1. Fill a centrifuge tube with an oxide slurry with a known volume percentage of the oxide particles, VPoxide.
2. Measure the volume of the filled slurry in the tube, Vs. Calculate the total volume of
the oxide particles, Voxide, in the tube using Vs and VPoxide.
3. Centrifuge the tube at 400*g (g = 9.8 m/s2) for 6 hours.
4. Measure the volume of the particles packing at the bottom of the tube, Vpacking.
5. The packing fraction is equal to the ratio of Voxide to Vpacking.
Theoretically, slurries with higher packing fractions have a better dispersing quality; this correlation will be explained more in the next section.
2.3.4 Preliminary strength testing and determination of Tstrength
In order to determine whether slurries would provide sufficient differential strength, we performed the following test:
1. Use an eyedropper to manually place one drop of the slurry in three separate locations in an alumina boat filled with –44 micron Fe-30Ni powders.
2. Fire the boat in a tube furnace to Tstrength (to be determined, ranging from 300-800 oC)
for 1 hour at a ramping rate of 8 oC/min under H2 atmosphere.
3. Manually and gently remove the eye-dropped samples from the alumina boat. If
Tstrength is right, the excess powders in the boat should still be loose without any
sintering strength, and the printed samples should be strong enough that they were not affected or damaged during the removal process.
By the process above, we should be able to check the differential strength between the printed and unprinted regions, and also determine the Tstrength.
2.3.5 Printing ability test
We jetted slurries through a 50-micron diameter nozzle for suitably long test periods (~1.5 hours). If the slurries could be jetted without any clogging for that long time, they should be suitable for printing by a 3DP machine.
2.4 Oxide reduction results and interpretation
2.4.1 Background
First, we used the Ellingham diagram, shown in Figure 2.3, as a useful reference for the reduction of metal oxides. The Ellingham diagram is a plot of the standard free energy of formation of several oxides versus temperature. The unit of the free energy is in free energy per mole of oxygen rather than free energy per mole of oxide, so that one can compare different oxidation reactions directly. A simple rule for the Ellingham diagram is that an element located lower in the diagram can reduce an oxide located higher in the diagram. However, this simple rule can be misleading. The diagram shows the possibility of chemical reactions based on thermodynamics. It does not indicate how quickly the reactions proceed. Therefore, even though some reactions might be possible thermodynamically, it might take a long time before the reactions reach equilibrium. Moreover, the rule is valid under an equilibrium condition. As a result, if a system is prevented from reaching equilibrium, the rule is not applicable to the system. For example, if a closed system initially contains Cr2O3 and H2, the rule predicts that
only very small amount of Cr and H2O will be produced before the system reaches equilibrium
because Cr/Cr2O3 lies below H2/H2O in the diagram. However, if the gas (H2 and H2O) in the
system is replaced by fresh and pure H2, additional amounts of Cr will be produced. And, if this
replacement is repeated for numerous times, we can finally reduce Cr2O3 to Cr successfully.[14]
Figure 2.3 Ellingham Diagram (Courtesy of J.W. Evans, L.C. De Jonghe, [14])
Since we used H2 gas as a reducing agent in this experiment, any oxide system located
above the H2/H2O line should be reducible under hydrogen atmosphere. From the diagram, the
Ni/NiO line is located above the H2/H2O line at all temperatures; therefore, it is
thermodynamically possible to reduce NiO by H2. However, the kinetics of this reaction would
be tested by TGA.
For Fe2O3, the reaction Fe2O3/Fe3O4 is well above the H2/H2O reaction in the diagram at
all temperatures. However, the reaction Fe3O4/Fe line is below the H2/H2O line at temperatures
below 1100 oC. Therefore, below 1100 oC and under equilibrium, Fe3O4 cannot be fully reduced
equilibrium might not be obtained; as a result, Fe3O4 was gradually reduced to Fe by fresh
hydrogen. This would be tested by TGA also. 2.4.2 TGA results and discussion
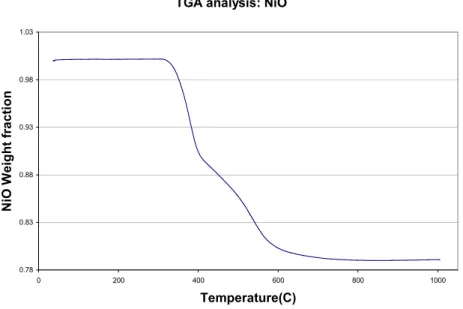
From the TGA analysis, NiO was successfully reduced to Ni. Figure 2.4 shows the plot of the weight fraction of the tested sample of NiO powders vs. temperature from TGA. From the
figure, the weight started to drop sharply at approximately 350 oC. After 400 oC, the sample
continued to lose weight gradually. The NiO powders were fully reduced to Ni at around 700
oC. As evident on the plot, at temperatures above 700 oC, the weight fraction remained steady at
0.78, which is roughly the theoretical weight fraction of Ni in NiO. The total heating time from
350 to 700 oC was about 35 minutes. The result shows that NiO could be reduced to Ni at
temperatures above 350 C within a reasonable short time.
Figure 2.5 shows a similar plot for Fe2O3. The Fe2O3 powders started to reduce at around
350 oC similar to the NiO powders. However, after the weight of the powders was reduced to
96% when the temperature reached 400 oC, the sample weight remained constant until the
temperature reached 550 oC. From then on, the sample weight kept reducing as the temperature
increased until the weight fraction was approximately 0.70, which is about the theoretical weight
fraction of Fe in Fe2O3. The Fe2O3 sample was also fully reduced at around 700 oC. The
reduction behavior at the temperatures between 400-550 oC can be explained with the Ellingham
diagram (Figure 2.3). From the Ellingham diagram, Fe2O3 can be reduced to FeO by hydrogen
gas. However, FeO is thermodynamically unfavorable to be reduced further to Fe under the same atmosphere. It requires higher activation energy, hence higher temperature, in order to stimulate the reaction, FeO + H2 Æ Fe + H2O, to proceed. Therefore, the weight of the Fe2O3
sample at the temperatures between 400-550 oC, which was actually reduced to FeO, stopped
decreasing until the temperature was high enough for the complete reduction reaction to proceed.
Correspondingly, the TGA result shows that Fe2O3 can be fully reduced to Fe at a minimum
TGA analysis: NiO 0.78 0.83 0.88 0.93 0.98 1.03 0 200 400 600 800 1000 Temperature(C) NiO W eig ht fr a cti on
Figure 2.4 TGA plot of the weight fraction of the NiO sample vs. temperature.
TGA analysis: Fe2O3
0.67 0.72 0.77 0.82 0.87 0.92 0.97 1.02 0 200 400 600 800 1000 Temperature (celsius) F e2O 3 w ei g h t f ract io n
2.5 Dispersion of metal oxide powders
2.5.1 Background
Colloidal slurries consist of stable suspensions of very fine particles in liquid. They are useful means to handle fine particles, which usually cause many processing difficulties, such as becoming airborne, posing significant health hazards, and forming fluffy aggregates that make processing difficult. Colloidal slurries can successfully help reduce these tendencies of dry particulates. Very fine particles can be stably suspended in slurries by manipulation of their surface interactions, e.g. a change of the surface charge by changing the pH of slurries, or by
addition of polymers to slurries.[14] In this work, we stabilized the suspension of Fe2O3/NiO
particles in a slurry by using a polymeric dispersant. Therefore, in this thesis, we will limit the focus to polymeric dispersants.
Colloidal stabilization by addition of polymeric dispersants to slurries is the oldest and most common method. The use of polymeric dispersants in slurries helps prevent particles coming together and sticking to one another to form agglomerates, which increase the settling rate of slurries due to the larger size and weight of aggregated particles. A stable dispersion can be made with a high solid content while retaining relatively low viscosity. The polymeric dispersants act as stabilizing agents due to the interactions of the polymer chains themselves, when they have reacted and been attached to the particles’ surfaces. The entanglement of polymers attached to the particles’ surfaces, as particles approach each other, contributes to the repulsive interaction between the particles, hence, helps stabilize the suspension of particles in a slurry.
In this research, we studied the settling characteristic of particles in a slurry to test the quality of a slurry. Even for a stable slurry, after sitting for a long time without any agitation, particles will finally settle to the bottom of the slurry due to the gravity force. The settling of a colloidal suspension by itself without any other external force causes flocculation at the bottom. And the floc structure depends how the surface interactions are manipulated. The floc structure can be understood by considering two steps: (1) sticking an arriving particle on another particle or a cluster of particles, and (2) rearrangement of the stuck particle or particle cluster into a
step rearrangement will not occur much and a low-density floc with many pores between clusters will result. Conversely, for the weaker attractive interaction between particles, the arriving particle will not stick with the cluster too tightly and thus permit some rearrangements. More opportunity for rearrangement results in denser flocculation.[14]
Settling without any other external force usually results in too low a density of flocculation. Therefore, forcing particles to settle by centrifuging or filtration is preferred because it results in a much higher density. For example, centrifuging makes the particles come together by increasing the gravity force on the particles. Therefore, even if the particles have repulsive interactions among one another due to polymeric dispersants, the force can still dominate and force particles together.
For a stable suspension with repulsive force from polymeric dispersants attached to the particles surfaces, the particles will stick less tightly together and hence more rearrangements can occur. As a result, denser flocculation will occur. Figure 2.6 below demonstrates the settling behavior under centrifuging force for different dispersant effectiveness.
Figure 2.6 Demonstration of the settling behavior of particles in a slurry under centrifuging force: (A) a poor dispersing quality results in low-density flocs, (B) an average dispersing quality, and (C) a stable dispersing quality results in a denser flocculation and high packing
fraction. (Courtesy of J.W. Evans, L.C. De Jonghe, [14])
In this experiment, we used the settling behavior of slurries subjected to centrifugal force to determine their quality. Good and stable slurries should result in centrifuged packing fractions higher than 50%. A high packing fraction indicates dense flocculation and, thus, strong repulsive interactions from polymeric dispersants.
Slurries were mixed by ball milling. A ball mill is a hollow rotating cylinder partially filled with hard, wear-resistant media.[15] Milling is widely used to provide an effective
dispersion and mixing, and to reduce the average particle size of powders. In this experiment, a plastic bottle was used as a mill, and short zirconia cylinders and alumina balls were used as milling media.
2.5.2 Nickel Oxide dispersion
Dispersion stability and settling tests
Green NiO powders used in this work were Novamet green nickel oxide: type F provided by Novamet, NJ. They were high pure grade with approximately 78 wt% of Ni. The powder size was between 1-5 microns. The slurries of the NiO powders were made by mixing the NiO powders with either water or isopropyl alcohol (IPA) and dispersants. Then, the slurries were milled with either zirconia milling media or alumina milling balls for 3-16 hours. Then, the milled slurries were stored in centrifuge test tubes. Some of the tubes were centrifuged at 400*g (g = 9.8 m/s2) for about 4 hours for external-forced settling. The others were left sitting to settle under the normal gravity (1 g) for stability observation.
A slurry with 15vol% NiO should give a substantial amount of Ni dopant deposition after decomposition. The volume percentage of Ni in NiO is approximately 59 vol%; thus, a 15 vol%NiO slurry contains approximately 8.85 vol% of Ni. By printing an 8.85 vol%-Ni slurry in an Fe-30wt%Ni powder bed with a packing fraction of 50%, the composition of the powder bed could be changed to 36.2wt% of Ni. This composition change of the base powders should change the thermal expansion coefficient of Fe-Ni alloys considerably.
Polyacrylic acid (PAA) was the first dispersant tested. The suggested proportion was 1 part of solids per 2 parts of PAA in water [16]. The slurry with 1 vol% NiO was milled with alumina milling media for 16 hours. The slurry was stable for a day. The settling flocculation could not be observed visibly in the first four days. Yet, the measured packing fraction was only 41%. Next, a slurry with 15vol% NiO, was made and tested. The slurry was very viscous due to a high solid content and PAA did not help reduce the viscosity as we would expect for an effective dispersant. Moreover, the slurry was very foaming because of its high PAA content. As a result, PAA is not a good dispersant for NiO powders.
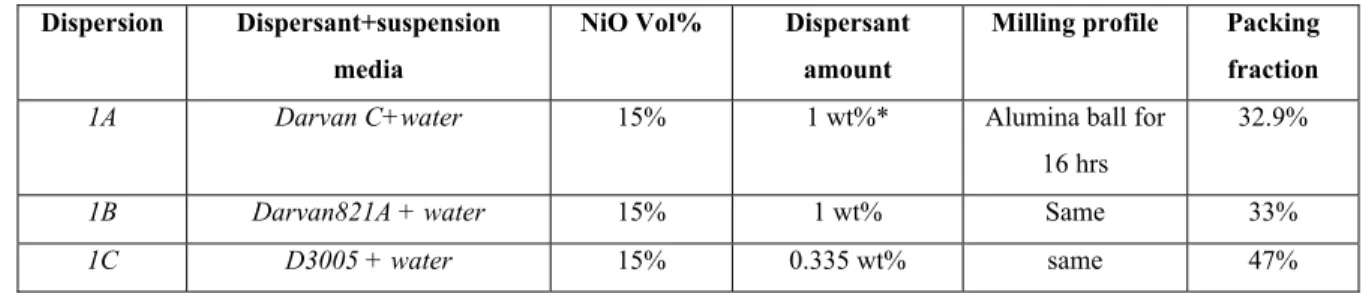
Next, dispersant products from Duramex, including Darvan C, Darvan 821A, and D3005, were tried. The amount of each dispersant was chosen based on recommendation from Duramex product literature. The mixtures and results of the slurries from Darvan C, Darvan821A and D3005 are shown in Table 2.1 below:
Table 2.1: Experimental data of the dispersions with the dispersants from Duramax
Dispersion Dispersant+suspension media
NiO Vol% Dispersant amount
Milling profile Packing fraction
1A Darvan C+water 15% 1 wt%* Alumina ball for
16 hrs
32.9%
1B Darvan821A + water 15% 1 wt% Same 33%
1C D3005 + water 15% 0.335 wt% same 47%
* wt% is the percentage ratio of dispersant’s weight to solid particles’ weight.
From the results, D3005 was the best candidate as a dispersant for NiO slurry. The packing fraction of the D3005 slurry was much higher than those of the other two slurries. All three slurries had a similar settling behavior; the settling could be visibly observed after 3 hours. Consequently, D3005 slurries were made more with different D3005 proportions. The D3005 dispersion profile is shown in Table 2.2 below:
Table 2.2: Experimental data of the D3005 dispersions Dispersion Dispersant+suspension media Dispersant Amount NiO volume percent Milling profile Packing fraction
2A D3005+water 0.168 wt% 15% Alumina ball for 16 hrs
Poor result
2B Same 0.335 wt% Same Same 43.5%
2C Same 0.503 wt% Same Same 47%
2D Same 0.737 wt% same Same 42%
From the results in Table 2.2 above, the amount of D3005 affected the resulting packing fraction slightly. Moreover, the settling behaviors were similar among all the D3005 dispersions except the dispersion 2A; they were stable without visible settling for longer than 2 hours. The dispersion 2A, which had the lowest amount of D3005, started settling within 10 minutes. Still, the packing fractions of all the D3005 dispersions were below 50%, but their stability was acceptable for printing.
Next, polyvinyl pyrorydone (PVP) was tried as a dispersant. PVP cannot dissolve in water but it dissolves in IPA. Therefore, an IPA-based slurry of NiO was made using PVP as a dispersant. The slurries consisted of 0.5wt% of PVP, 15 vol% of NiO and IPA. The measured packing fraction of the slurry was 41%. The suspension was stable for days before settling could be visibly observed. The slurry showed promising stability.
Even though the measured packing fractions of both the PVP IPA-based slurry and the D3005 aqueous slurries were below 50%, their dispersing stability was promising. Therefore, we decided to check the other qualities of these dispersions. Subsequently, both types of the slurries were eye-dropped onto a boat filled with Fe-30Ni powders (-44 micron). Both of the D3005 and the PVP slurries had difficulties going into the powders. The NiO particles were filtered by the top layers of Fe-30Ni powders such that they blocked most of the absorbing paths. As a result, most of the fine particles were left on the surface of the powder bed. This is a common problem for a slurry with such a high volume content of fine particles. This would certainly cause problems when printing them with a 3DP machine. A 50-micron nozzle would be clogged easily by clusters of fine particles. From the past experiences and work of the slurry-base printing, for slurries whose packing fractions were less than 0.5, the solid volume percentage of the slurries should be less than 5 vol% so that the slurries could be jetted successfully. Therefore, we decided to work with 5 vol% NiO slurries instead of 15 vol% NiO slurries.
As mentioned above, a 15 vol% NiO slurry provided a substantial amount of dopant into the base powders. A 5 vol% NiO slurry would definitely deposit much less amount of dopant into the base powders. Therefore, we would need to print a 5 vol% NiO slurry multiple times to achieve the same deposition amount as one-time printing of a 15 vol% NiO slurry.
As a result, 5 vol% NiO slurries with D3005 and PVP as dispersants were made and tested. Surprisingly, the packing fractions of these 5 vol% NiO slurries were much lower than those of the 15 vol% NiO slurries. The results are shown in Table 2.3 below:
Table 2.3: Experimental data of the 5 vol% NiO dispersions Dispersion Dispersant+suspension media NiO vol% Dispersant amount Milling profile Packing fraction
3A D3005+water 5% 0.28 wt% Alumina ball for 16 hrs 22% 3B D3005+water 5% 0.35 wt% Same 22% 3C D3005+water 5% 0.83 wt% Same 25% 3D D3005+water 5% 1.23 wt% Same 26% 3E PVP+IPA 5% 0.25 wt% Same 28.8% 3F PVP+IPA 5% 0.5 wt% Same 25.9% 3G PVP+IPA 5% 1 wt% Same 29%
The packing fractions of these dispersions were well below the results from the dispersion set 1 and 2, even though the processing methods and dispersants’ amounts were the same. The only difference was the amount of NiO. Another 15 vol% NiO slurries with D3005 and PVP as dispersants were made again. And, the measured packing fractions of these 15vol% slurries were in the range of 38-42%, which were approximately the same as the results obtained from the dispersion set 1 and 2.
We suspected that there might be contamination in the 5 vol% slurries that deteriorated the quality of the slurries. As a result, we measured the total amounts of solid particles in the slurries after milling; the solid particles included both NiO and contamination if any. The procedure to measure the solid amount included:
1. A few drops of a slurry were filled on an aluminum boat. 2. The boat with the slurry was weighed, Wpre-heat.
3. The aluminum boat was heated at 50 oC for 4 hours to evaporate liquid and leave only
solid particles on the boat.
4. The boats with only solid particles were weighed, Wpost-heat.
5. With these measured data along with the known densities of both liquid carrier, ρliquid,
and NiO powders, ρNiO, we could calculate the amount of volume percentage of solid
100 × − + = − − − − liquid heat post heat pre solid heat post solid heat post solid W W W W V ρ ρ ρ Equation 2.1.
From the calculation, the average value of solid particles volume fraction in the 5 vol% NiO slurries after milling was 6 vol%, while that of the 15 vol%NiO slurries was about 15.5%. A significant amount of additional unknown solid particles was present in the 5 vol% NiO slurries. The unknown solid particles were suspected to be residue from degradation of the alumina milling balls. During milling, the NiO powders were expected to surround the alumina milling balls. So, when the balls collide each other, NiO particles covering the surfaces of the ball would collide with each other instead and break apart. For the 15 vol% NiO slurries, a plenty of NiO powders covered the alumina balls’ surfaces as the balls were colliding. However, for the 5 vol% NiO slurries, the amount of NiO powders was not enough to cover all the surfaces. As a result, some of the alumina ball surfaces hit each other and could possibly fall apart producing alumina residues. As a result, the measured volume fraction of solid particles in the 5 vol% NiO slurries after milling was higher than the actual amount (5 vol%) of solid NiO initially added in the slurries before milled.
Hence, short zirconia cylinders were used as milling media instead of alumina balls. Zirconia has higher wear resistance and is harder than alumina. Thus, zirconia milling media should have superior performance.
In addition, use of zirconia allows the milling time to be reduced. The shorter milling time might reduce the chance of wear of milling balls. This concept was then proved by making slurries milled with zirconia for different milling times. Two NiO volume fractions were made including 5vol% NiO and 1 vol% NiO slurries. The results are shown in Table 2.4 below:
Table 2.4: Experimental data of the D3005 dispersions milled by zirconia media for different times. Dispersion Dispersant+liquid suspension NiO vol% Measured solid vol% Dispersant amount Milling profile Packing fraction 4A D3005+water 5% 4.95% 1.23 wt% Zirconia,18 hr 46%
4B Same 1% 1.05% Same Zirconia,18 hr 50%
4C Same 5% 5.05% Same Zirconia, 6 hr 48%
4D Same 1% 0.98% Same Zirconia, 6 hr 52%
4E Same 5% 5.01% Same Zirconia, 3 hr 47%
4F Same 1% 1.02% Same Zirconia, 3 hr 52%
From these results above, the dispersions were milled effectively even when they were milled for a short time. The contamination levels of both 5 vol% and 1 vol% slurries were small. Therefore, using zirconia as a milling media allowed us to work with dispersions containing as low as 1 vol% NiO without contamination from milling. The results of the D3005 NiO dispersions were satisfactory; hence, they were suitable to be tested for jetting performance.
Preliminary jetting test
The D3005 and PVP dispersions of 5 vol% NiO were made for a jetting test. The dispersions were filtered through 5 micron nylon mesh to ensure that the diameters of all the particles in the dispersions were less than 5 micron. As a result, the diameters of the NiO particles in the dispersions were in the range of 1-5 microns. The small particles would not stay dispersed indefinitely. They would finally settle at the bottom of the slurries if the slurries sat without any agitation for a long time. As described by Stokes’ law, the terminal velocity of the spherical particles falling through fluid media is:
(
)
η ρ ρs l t gr V = 2 − 9 2 Equation 2.2,where Vt is the terminal velocity of the particle, g = 9.8 m/s2, r is the radius of the particle, η is
the viscosity of the liquid, ρs is the density of the solid, and ρl is the density of the liquid.
As a result, larger particles would start to fall quickly and settle out of the slurries on the bottom of the container forming large aggregations. The calculated settling times of NiO
particles with different diameters in water, with a settling distance of 5 cm and under 1*g, are given in Table 2.5 below:
Table 2.5: Terminal velocity and settling time for different particle sizes.
Diameter (microns) Terminal velocity (cm/s) Settling time
5 7.66e-3 11 min
3 2.76e-3 30 min
1 3.07e-4 4.5 hours
0.5 7.66e-5 18 hours
Therefore, for the NiO dispersion, the 5-micron diameter particles could take only as short as 11 minutes to settle. This was undesirable for printing since the dispersion must contain NiO particles homogeneously throughout a container the whole time during printing. Moreover, the settled flocculation was large and could impede penetration of the slurry into the powder bed. Therefore, a recirculation system was introduced to prevent particles from settling. The setup of the recirculation system is shown in Figure 2.7 below.
From Figure 2.7, a peristaltic pump was used to cycle the material faster than it could settle [9]. A dispersion was contained in a centrifuge tube. The peristaltic pump suctioned the dispersion from the bottom of the tube. An inline filter of 10-micron nylon mesh was placed on the suction side of the pump to catch any large agglomerates or contamination. The pump returned the dispersion back to the top of the tube after filtering. The nozzle line and applied pressure line were connected at the top of the tube. Therefore, with applied pressure on, the dispersion flowed out of the high-pressure tube to the low-pressure nozzle. Finally, the jetted dispersion was replenished back to the tube at the T junction between the pump and the filter. Another filter of 10-micron nylon mesh was placed between the tube and the nozzle in order to ensure that the dispersion going through the nozzle was clean. With this recirculation setup, the settling of particles could be avoided.
Figure 2.7 Illustration of the setup of the recirculation system.
Next, the slurries were jetted through a 50 micron nozzle to check their printing stability. For an IPA-based slurry, it was almost impossible to jet the slurry. With pressure on, high-viscosity IPA flowed very fast leaving most NiO particles in the 10-micron filters. A substantial amount of NiO accumulated in the 10-micron filters. In addition, the slurry clogged the nozzle after less than 5 minutes of jetting. As a result, based on the poor jetting performance of the IPA-base slurry, testing on the IPA-base slurry was discontinued.
For an aqueous-base dispersion, the dispersion could be jetted through the nozzle stably for as long as 30 minutes before it started to clog the nozzle. Both of the 10-micron filters had no accumulation of NiO powders; the dispersion could flow through the filters smoothly.
Jet line Pressurize gas 50-mic nozzle 10-mic filter Peristaltic pump T junction Replenishing line 10-mic filter
Therefore, the problem experienced was the clogging. The large particles might have gradually formed aggregates in the nozzle. And, as the aggregates became large enough, they could clog the nozzle. This clogging problem could be expected since the quality of the dispersion was not perfectly stable and the average particle size was larger than one micron.
As a result, we developed a new technique to make a dispersion with sub-micron NiO particles. The technique exploited Stokes’ Law, Equation 2.2. We used Stokes’ Law to calculate the terminal velocity of NiO particles falling through aqueous media under normal gravity (9.8 m/s2). Different particle sizes take different times for settling. The larger particles settle and fall through faster. So, in this case, we wanted to have only particles smaller than 1 micron in a slurry. We had a tube filled with the slurry that the length from the bottom of the tube to the filled line was 10 cm. The slurry contained 1 vol% of NiO. The NiO amount was sparing so that each powder particle could fall freely with few interactions with the other particles. Then, the time that a 1-micron particle would take to fall down 5 cm under normal gravity was calculated; this time was noted as the settling time. So, the tube filled with the slurry was agitated and then kept still for the settling time at 1 g. Then, the top 5-cm portion of the liquid in the tube was suctioned off. As a result, the suctioned-off liquid would contain only particles smaller than 1 micron in diameter. All other larger particles were left in the tube. Finally, we measured how much the NiO particles remained in this sub-micron slurry, which should be less than 1 vol%.
Subsequently, we could increase the volume percent of NiO in the sub-micron slurry by centrifuging the slurry at high gravity so that all particles settled out. Then, we could suction off and discard the top portion, which were only water and dispersants, from the tube. As a result, with less amount of water but the same amount of NiO, the slurry was concentrated to 5 vol% NiO.
As a result, several slurries of 1 vol% NiO were made and settled for 4.5 hours in the 10 cm tall tube. Then, the top 5cm portions of the slurries were suctioned off. The measured solid contents of these suctioned-off slurries were in the range of 0.65-0.68 vol%, which showed that this technique was reproducible. Next, the sub-micron slurries were concentrated to 5 vol%. First, they were stored in centrifuge tubes and centrifuged at 800 g for 8 hours. Consequently, all solid particles settled at the bottom of the tube; only almost pure water remained in the top
remaining in the tube contained 5 vol% NiO. Next, these slurries were milled for 1.5 hours to ensure their homogeneity and that all large aggregates or particulates were crushed into small sub-micron pieces. Then, the milled slurries were filtered through 5 micron nylon mesh to remove any contamination.
A preliminary jetting test was then tried with the sub-micron slurries, with promising results. They could be jetted stably and steadily for longer than one hour without any clogging. As a result, these sub-micron NiO dispersions were suitable for the actual printing with a 3DP machine.
Preliminary Strength test
The preliminary strength test was done for the sub-micron NiO slurries. When fired to
600 oC for 1 hour, the unprinted regions of the powder boat started sintering and became hard to
remove. Therefore, the eye-dropped sample could not be retrieved from the excess powders. A
similar result was obtained by firing a powder boat to 500 oC for 1 hour. Even though the
eye-dropped region seemed to be stronger than the other regions, it was still impossible to retrieve the eye-dropped region without any damage.
An acceptable result was obtained by firing a powder boat sample at 400 oC for 1 hour.
The eye-dropped sample could be removed from the excess powder bed by softly brushing. The eye-dropped part had some strength (much more strength than loose powders) but was still weak and fragile. Finally, the eye-dropped sample fired at 350 C for 1 hour was too weak and fragile to handle.
As a result, heating a sample at 400 oC for 1 hour was the optimal heat treatment to
provide sufficient differential strength. At a lower temperature, the part possessed such small strength that it could easily fall apart with normal handling.
2.5.3 Iron Oxide dispersion
Our next task was to make a suspension of iron oxide. There are sixteen iron oxides, which are either oxides, hydroxides, or oxide hydroxides.[13] In this project, we considered only
three of them: 1. Haematite, alpha-Fe2O3; 2. Magnetite, Fe3O4; and 3. Maghemite,
gamma-Fe2O3.
Magnetite, Fe3O4, was the first type of iron oxide we worked with because there were
already suspensions of nanometer-sized particles of Fe3O4 available commercially. These
suspensions are known as ferrofluids. Ferrofluids are magnetic fluids containing nanometer-sized magnetic iron oxide particles in aqueous or organic media. These fluids are very stable as colloids of iron oxides. We ordered a sample of ferrofluids from FerroTec, NH. For the ferrofluids provided by FerroTec, the maximum iron oxide content in aqueous media is 3.6 vol% and the maximum one for organic media is as high as 16 vol%.
The ferrofluids were very stable. Settling could not be visibly observed even if the fluids sat still for longer than a week. Then, we did preliminary printing and strength tests with these fluids.
The oil-based fluids were absorbed into a powder bed within a short time. They provided high strength for the eye-dropped parts even firing at a low temperature (as low as 300 oC). This
was because of high contents, 16 vol%, of Fe3O4 powders in the fluids. Moreover, the particles
were nanometer scale, so the sintering rates of these oxide particles were much higher than the sub-micron particles. However, we could still observe oxidation and contamination around the eye-dropped areas. Presumably, the oil-based fluids contained some organic compounds that might not be able to be decomposed at low temperature. And, these might significantly contaminate the printed samples, e.g. resulting in an observable purple area of oxidation. Moreover, the fluids were so thick and viscous that they could not be jetted successfully even at high applied pressure. As a result, the oil-based ferrofluids were unsuitable for our application.
For the aqueous fluids, the first problem encountered was that the fluids could not be absorbed into the powder bed. Eye-dropped onto a boat of Fe-30Ni powders, the fluids formed a hemispherical shaped droplet lying on the bed. After 10 minutes, we could observe that the hemispherical shape was still evident on the powder bed but the binder droplet lost some
could be removed from the bed easily by a spoon. Presumably, the solid particles in the ferrofluids could not penetrate the powder bed while the aqueous media of the ferrofluids could. This poor performance of the aqueous ferrofluid came as surprise since the fluids were very stable and the particle sizes were as small as nanometer scale. So, they were expected to be adsorbed into the porous channels of the powder bed easily along with the fluid without any filtering problems. The poor performance might have arisen from the surface tension of the fluids, which might be so high that they did not wet the Fe-30Ni powders. The high surface tension might come from the high surface area per volume of the nanometer-size iron oxides in the fluids. Nanometer-size powders have much more surface area per volume than sub-micron particles and, hence, a higher degree of surface energy. Consequently, the higher surface area caused more chances of frictional interactions between particle surfaces and contributed to a high degree of surface energy of the fluids. For the jetting test, these fluids were stable and could be jetted perfectly without any clogging. However, since they could not be readily absorbed into the powder beds, they were not qualified as dopant slurries.
Next, we worked with Maghemite, gamma-Fe2O3. Maghemite is a red-brown,
ferromagnetic material that is an important magnetic pigment.[13] Nanometer-size powders of
gamma-Fe2O3 are available commercially. Gamma-Fe2O3 powders were ordered from Alfa
Aesar, MA. The average particle size was in the range of 20-30 nm. The dispersions of
gamma-Fe2O3 were made with different dispersants including D3005, D3021, D821A, and 600MW PEI.
The results are shown in Table 2.6 below:
Table 2.6: Experimental data of the gamma-Fe2O3 dispersions
Dispersion Dispersant Dispersant amount Fe2O3 amount Milling profile Packing fraction
5A None 0 wt% 1vol% Zirconia, 3hr 25%
5B D3005 1wt% same Same 19% 5C D3005 5wt% Same Same 25.45% 5D D3005 10wt% Same Same 27.78% 5E D3021 5wt% Same Same 25% 5F D821A 5wt% Same Same 25%
5G 600MW PEI 5wt% Same Same 14%

![Figure 2.3 Ellingham Diagram (Courtesy of J.W. Evans, L.C. De Jonghe, [14])](https://thumb-eu.123doks.com/thumbv2/123doknet/14159356.473029/23.918.225.737.111.688/figure-ellingham-diagram-courtesy-j-w-evans-jonghe.webp)


![Figure 3.6 Phase diagram of Fe-Ni alloys ([8])](https://thumb-eu.123doks.com/thumbv2/123doknet/14159356.473029/51.918.269.704.103.786/figure-phase-diagram-fe-ni-alloys.webp)
