Publisher’s version / Version de l'éditeur:
Vous avez des questions? Nous pouvons vous aider. Pour communiquer directement avec un auteur, consultez la première page de la revue dans laquelle son article a été publié afin de trouver ses coordonnées. Si vous n’arrivez pas à les repérer, communiquez avec nous à PublicationsArchive-ArchivesPublications@nrc-cnrc.gc.ca.
Questions? Contact the NRC Publications Archive team at
PublicationsArchive-ArchivesPublications@nrc-cnrc.gc.ca. If you wish to email the authors directly, please see the first page of the publication for their contact information.
https://publications-cnrc.canada.ca/fra/droits
L’accès à ce site Web et l’utilisation de son contenu sont assujettis aux conditions présentées dans le site LISEZ CES CONDITIONS ATTENTIVEMENT AVANT D’UTILISER CE SITE WEB.
Atmospheric Chemistry and Physics, 16, 7, pp. 4423-4438, 2016-04-11
READ THESE TERMS AND CONDITIONS CAREFULLY BEFORE USING THIS WEBSITE. https://nrc-publications.canada.ca/eng/copyright
NRC Publications Archive Record / Notice des Archives des publications du CNRC :
https://nrc-publications.canada.ca/eng/view/object/?id=404d576b-fe8d-4628-9921-00e16771b847
https://publications-cnrc.canada.ca/fra/voir/objet/?id=404d576b-fe8d-4628-9921-00e16771b847
NRC Publications Archive
Archives des publications du CNRC
This publication could be one of several versions: author’s original, accepted manuscript or the publisher’s version. / La version de cette publication peut être l’une des suivantes : la version prépublication de l’auteur, la version acceptée du manuscrit ou la version de l’éditeur.
For the publisher’s version, please access the DOI link below./ Pour consulter la version de l’éditeur, utilisez le lien DOI ci-dessous.
https://doi.org/10.5194/acp-16-4423-2016
Access and use of this website and the material on it are subject to the Terms and Conditions set forth at
Observation of viscosity transition in α-pinene secondary organic aerosol
Järvinen, Emma; Ignatius, Karoliina; Nichman, Leonid; Kristensen, Thomas B.; Fuchs, Claudia;
Hoyle, Christopher R.; Höppel, Niko; Corbin, Joel C.; Craven, Jill; Duplissy, Jonathan; Ehrhart,
Sebastian; El Haddad, Imad; Frege, Carla; Gordon, Hamish; Jokinen, Tuija; Kallinger, Peter;
Kirkby, Jasper; Kiselev, Alexei; Naumann, Karl-Heinz; Petäjä, Tuukka; Pinterich, Tamara;
Prevot, Andre S. H.; Saathoff, Harald; Schiebel, Thea; Sengupta, Kamalika; Simon, Mario;
Slowik, Jay G.; Tröstl, Jasmin; Virtanen, Annele; Vochezer, Paul; Vogt, Steffen; Wagner, Andrea
C.; Wagner, Robert; Williamson, Christina; Winkler, Paul M.; Yan, Chao; Baltensperger, Urs;
Donahue, Neil M.; Flagan, Rick C.; Gallagher, Martin; Hansel, Armin; Kulmala, Markku;
Stratmann, Frank; Worsnop, Douglas R.; Möhler, Ottmar; Leisner, Thomas; Schnaiter, Martin
www.atmos-chem-phys.net/16/4423/2016/ doi:10.5194/acp-16-4423-2016
© Author(s) 2016. CC Attribution 3.0 License.
Observation of viscosity transition in α-pinene
secondary organic aerosol
Emma Järvinen1, Karoliina Ignatius2, Leonid Nichman3, Thomas B. Kristensen2, Claudia Fuchs4,
Christopher R. Hoyle4,8, Niko Höppel1, Joel C. Corbin4, Jill Craven5, Jonathan Duplissy6, Sebastian Ehrhart7, Imad El Haddad4, Carla Frege4, Hamish Gordon7, Tuija Jokinen6, Peter Kallinger9, Jasper Kirkby7,10,
Alexei Kiselev1, Karl-Heinz Naumann1, Tuukka Petäjä6, Tamara Pinterich9, Andre S. H. Prevot4, Harald Saathoff1, Thea Schiebel1, Kamalika Sengupta11, Mario Simon10, Jay G. Slowik4, Jasmin Tröstl4, Annele Virtanen12,
Paul Vochezer1, Steffen Vogt1, Andrea C. Wagner10, Robert Wagner1, Christina Williamson10,13,14, Paul M. Winkler9, Chao Yan6, Urs Baltensperger4, Neil M. Donahue15, Rick C. Flagan16, Martin Gallagher3, Armin Hansel17,
Markku Kulmala6, Frank Stratmann2, Douglas R. Worsnop18, Ottmar Möhler1, Thomas Leisner1, and Martin Schnaiter1
1Karlsruhe Institute of Technology, Institute for Meteorology and Climate Research, P.O. Box 3640,
76021 Karlsruhe, Germany
2Institute for Tropospheric Research (TROPOS), 04318 Leipzig, Germany
3School of Earth, Atmospheric and Environmental Sciences, University of Manchester, Manchester, M13 9PL, UK 4Laboratory of Atmospheric Chemistry, Paul Scherrer Institute, Villigen, Switzerland
5California institute of technology, department of chemical engineering, Pasadena, CA 91125, USA 6Helsinki Institute of Physics and University of Helsinki, Department of Physics, Helsinki, Finland 7CERN, 1211, Geneva, Switzerland
8WSL Institute for Snow and Avalanche Research SLF, Davos, Switzerland 9Faculty of Physics, University of Vienna, Vienna, Austria
10Institute for Atmospheric and Environmental Sciences, Goethe-University Frankfurt am Main,
Campus Riedberg Altenhöferallee 1, 60438 Frankfurt am Main, Germany
11University of Leeds, School of Earth and Environment, LS2-9JT Leeds, UK 12Department of Applied Physics, University of Eastern Finland, Kuopio, Finland
13NOAA Earth Systems Research Laboratory (ESRL), Chemical Sciences Division, 325 Broadway, Boulder,
Colorado 80305, USA
14Cooperative Institute for Research in Environmental Sciences (CIRES), University of Colorado Boulder, UCB 216,
Boulder, Colorado 80309, USA
15Center for Atmospheric Particle Studies, Carnegie Mellon University, 5000 Forbes Ave., Pittsburgh, PA 15213, USA 16California Institute of Technology, Division of Chemistry and Chemical Engineering, Pasadena, California 91125, USA 17Institute for Ion and Applied Physics, 6020 Innsbruck and Ionicon Analytik GmbH, 6020 Innsbruck, Austria
18Aerodyne Research, Inc., Billerica, MA 08121, USA
Correspondence to:Emma Järvinen (emma.jaervinen@kit.edu)
Received: 4 September 2015 – Published in Atmos. Chem. Phys. Discuss.: 22 October 2015 Revised: 8 March 2016 – Accepted: 29 March 2016 – Published: 11 April 2016
Abstract. Under certain conditions, secondary organic
aerosol (SOA) particles can exist in the atmosphere in an amorphous solid or semi-solid state. To determine their rele-vance to processes such as ice nucleation or chemistry occur-ring within particles requires knowledge of the temperature and relative humidity (RH) range for SOA to exist in these states. In the Cosmics Leaving Outdoor Droplets (CLOUD) experiment at The European Organisation for Nuclear Re-search (CERN), we deployed a new in situ optical method to detect the viscous state of α-pinene SOA particles and measured their transition from the amorphous highly viscous state to states of lower viscosity. The method is based on the depolarising properties of laboratory-produced non-spherical SOA particles and their transformation to non-depolarising spherical particles at relative humidities near the deliques-cence point. We found that particles formed and grown in the chamber developed an asymmetric shape through coagu-lation. A transition to a spherical shape was observed as the RH was increased to between 35 % at −10◦C and 80 % at
−38◦C, confirming previous calculations of the
viscosity-transition conditions. Consequently, α-pinene SOA particles exist in a viscous state over a wide range of ambient con-ditions, including the cirrus region of the free troposphere. This has implications for the physical, chemical, and ice-nucleation properties of SOA and SOA-coated particles in the atmosphere.
1 Introduction
Organic particulate material is abundant in Earth’s atmo-sphere. Biogenic and anthropogenic sources emit volatile organic compounds (VOCs), which are oxidized through a cascade of chemical reactions into extremely low volatil-ity vapours that condense into the particle phase to form sec-ondary organic aerosol (SOA) (Hallquist et al., 2009). Bio-genic VOCs are much more abundant than anthropoBio-genic VOCs (Guenther et al., 1995; Jimenez et al., 2009) and monoterpenes such as α-pinene are found throughout the continental boundary layer, particularly in boreal forest re-gions (e.g., Tunved et al., 2006; Laaksonen et al., 2008). Af-ter formation, SOA influences climate on a global scale di-rectly by scattering and absorbing solar radiation and indi-rectly through aerosol–cloud interactions. Locally, SOA can affect air quality and human health (e.g., Nel, 2005; Huang et al., 2014). However, the chemical and physical processes that determine the properties of SOA particles are complex, and our understanding of these processes is limited (Hallquist et al., 2009; Hoyle et al., 2011).
Recently, considerable attention has been given to water uptake and viscous properties of SOA. It has been found that SOA particles can exist in the atmosphere in an amorphous semi-solid or solid state (Virtanen et al., 2010; Koop et al., 2011; Renbaum-Wolff et al., 2013; Pajunoja et al., 2014).
The existence of these states has several atmospheric im-plications. Molecular diffusion in the condensed phase af-fects the gas uptake by viscous SOA particles and can, there-fore, alter the SOA particle lifetime in the atmosphere (Shi-raiwa et al., 2011). In addition, water uptake is inhibited in the viscous particles (Riipinen et al., 2012), limiting the SOA growth under conditions in which SOA would typically grow hygroscopically (Swietlicki et al., 2008; Pajunoja et al., 2015). This, in turn, influences the aerosol direct effect on radiative forcing. More recent studies have shown that the viscous SOA particles or their proxies can act as ice nuclei (IN) (Murray et al., 2010; Wagner et al., 2012; Wang et al., 2012; Wilson et al., 2012; Schill et al., 2014), thus influenc-ing cloud cover, cloud optical properties, and precipitation.
In order to understand the climatological influence of the viscous state of SOA particles, detailed knowledge of the temperature and relative humidity (RH) ranges in which SOA can persist in a solid or semi-solid state is needed. Several experimental methods have been developed to measure the transition temperature or RH between different SOA phase states. A direct way to measure the glass-transition tem-perature, Tg, of SOA substances is to use differential
scan-ning calorimetry (DSC; Zobrist et al., 2008). However, this method requires the removal of the semi-volatile aerosol par-ticles from the surrounding gas, which can change the state, shape, or composition of the SOA particles (Zhang et al., 2015). In contrast, indirect methods allow for the sampling of the SOA particles with their surrounding gas. As indirect methods, they do not directly measure Tg, but rather probe
the change in the SOA particle mechanical or aerodynam-ical properties with temperature or RH. These methods in-clude the bounce method that exploits the fact that solid or semi-solid particles rebound in an impactor plate, whereas liquid particles adhere. A low pressure impactor (ELPI; Vir-tanen et al., 2010; Saukko et al., 2012) has been used for this purpose and, recently, the method is extended to work at atmospheric pressures (Bateman et al., 2014). Moreover, the so-called poke-flow method (Renbaum-Wolff et al., 2013) and the shatter technique (Schill et al., 2014) use mechanical forces to disturb single particles and the response to the me-chanical stress can be linked with a phase state. Finally, the particle phase state can be determined with measurement of their aerodynamic shape factor (Zhang et al., 2015).
Although these methods provide useful insights into the nature of the SOA particles, the SOA aerosol has been sam-pled and passed through an instrument, in which their envi-ronment is altered. This may result in a change in the material properties. In an effort to minimize biases due to these per-turbations, we have employed a new optical method that pro-vides a non-invasive probe of shape or structural anisotropy that may be present in solid or highly viscous semi-solid SOA particles (Virtanen et al., 2010; Adler et al., 2013; Pa-junoja et al., 2014; Schill et al., 2014; Zhang et al., 2015), but that is quickly erased in low viscosity droplets as they relax
toward the most energetically favourable state, i.e., spherical droplets that are homogeneous throughout their volumes.
For a perfectly isotropic, spherical particle, light that is scattered directly back toward its source, i.e., in a direction of 180◦from that of the incident light, retains its initial
polar-ization state. Whether it results from deviations from spheri-cal symmetry, or from structural inhomogeneities, anisotropy in the optical properties leads to depolarization. A measure-ment of the extent of depolarization in the backscattered light probes the magnitude of the anisotropy and, hence, the abil-ity of the particle to relax to its low-energy state. This signal thus reflects the viscosity of the material that comprises the particle, provided that some mechanism has previously intro-duced anisotropy.
Here, we present a new approach based on in situ mea-surement of depolarization, and use it to study the effect of temperature and RH on the viscosity transitions that SOA particles may undergo as they become solvated with water at high humidity. This paper is organized as follows. The new method depends on how different types of anisotropy af-fect depolarization of light scatted by the small (sub-micron) SOA particles that are found in the atmosphere. We begin, therefore, with theoretical and modelling studies of the ef-fects of size, shape, and internal structure on the depolar-ization signals that we may expect. The modelling studies allow us to constrain the range of particle sizes and concen-trations for which the method is useful, and proved central to the design and optimization of an instrument capable of mea-suring the viscous transition under atmospheric conditions. Moreover, they aid in understanding the relative importance of shape and structural anisotropy in the measurements.
We then describe the experimental method, the instru-ment that has been developed, and instruinstru-ment characteriza-tion experiments that assess the limits to the sensitivity of the depolarization measurements. We define an instrumental-based viscosity-/shape-transition RH that describes the RH value, where the particles were observed to be spherical or isotropic according to our method. The viscosity/shape transitions are measured for a model SOA system, i.e. the SOA produced by oxidation of α-pinene. The experiments were conducted in the The European Organization for Nu-clear Research (CERN) Cosmics Leaving Outdoor Droplets (CLOUD) chamber, an environmental chamber that has unique capabilities to simulate conditions throughout the tro-posphere while maintaining the cleanliness required for new particle formation studies (Schnitzhofer et al., 2014). We de-scribe the experimental facility, key measurement methods that were employed, and experimental procedures.
Experimental results are described, beginning with those from the instrument characterization studies, but then focus-ing on the dynamics of the SOA particles, the evolution of their properties, and the viscosity/shape transition of the α-pinene SOA. We continue the paper with a discussion of the atmospheric implications of our findings, and finish with conclusions.
2 Theoretical considerations
The depolarization ratio is a measure of how strongly the po-larization state of incident light is altered during scattering by particles. Isotropic spherical particles do not induce lin-ear or circular depolarization in the exact backward direction, whereas non-spherical particles alter the depolarization state of incident light depending on their size, shape, and refrac-tive index. Therefore, depolarization measurements can be used to determine the particle asphericity. The magnitude of the depolarization ratio can, in the case of aerosol particles, vary from only a few per cent (in the case of sea salt) to up to 0.4 (in the case of dust aerosol) (Sakai et al., 2010). Solid or semi-solid amorphous particles may also induce depolariza-tion due to internal structures or inhomogeneous refractive index. In this case the depolarization will depend on the gra-dient and/or variation of the refractive index as well as the size of the particle. In the case of sub-micron particles, the scale of the variation in particle properties is restricted by the size, and hence we can expect a maximum depolariza-tion ratio of 0.01 due to particle inhomogenities, whereas the probable depolarization ratios are well below that (Li et al., 2005; Dlugach and Mishchenko, 2015).
To quantify the extent of depolarization, we define the de-polarization ratio, δL,C (indices L, C denoting the liner or
circular incident depolarization state) as the ratio of the in-tensity of the parallel polarized light, Ik, to the perpendicular
polarized light, I⊥, in the backscatter direction when the
par-ticle is illuminated with perpendicularly polarized light. For a perfect measurement, we could take the ratio directly. In any real measurement there will be some background contri-bution to these two signals in the form of molecular scatter-ing and scatterscatter-ing from chamber walls. Therefore, we sub-tract the background intensities Ikbgand I⊥bgmeasured in the absence of scattering particles from the measured scattered light intensities during particle measurements, defining δL,C
as δL,C=
Ik−Ikbg
I⊥−I⊥bg
. (1)
We modelled the depolarization ratio to assess the sen-sitivity of this method to the small particles that are pro-duced in the environmental chamber and that will be used for studies of the viscosity transition. We ignore the effect of anisotropy and consider only the influence of the parti-cle asphericity on the depolarization ratio. This can be esti-mated using a T -matrix approach in a regime that is appro-priate for particles, whose size is of the order of the wave-length of the incident light (Mishchenko et al., 1996). We performed T -matrix computations using the aforementioned constraints to model the expected depolarization properties of growing SOA particles in our experiments. The simula-tions were done for a particle size distribusimula-tions with geomet-ric mean diameters (GMD) ranging from 100 to 1400 nm and
with a narrow geometric standard deviation (GSD) of 1.1, as would be expected when the primary growth mechanism is condenzation. The refractive index of α-pinene SOA a near-room temperatures has been shown to vary between 1.4 and 1.6 (Schnaiter et al., 2005; Kim et al., 2010; Redmond and Thompson, 2011). As we do not have the information on the refractive index of viscous α-pinene SOA particles, we as-sumed in the modelling study a refractive index of 1.5 + 0i after Schnaiter et al. (2005). Further details on the computa-tional procedures used to model particle depolarization ratios can be found in Schnaiter et al. (2012).
2.1 Simulation results
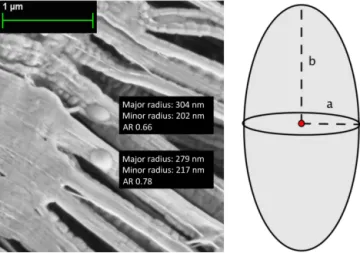
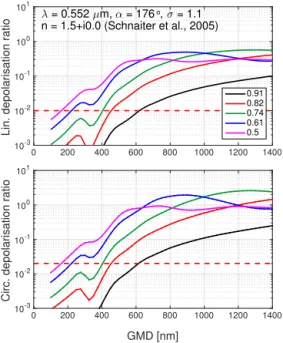
The SOA particles were modelled with prolate spheroids. Prolate spheroids have a greater polar radius than equatorial radius, having the form of a symmetrical egg. In the T -matrix formalism the aspect ratio of these particles describes the re-lationship of the equatorial radius to the polar radius and is therefore always smaller than 1 (Fig. 1). Since the aspect ra-tio of the SOA particles is unknown, we performed the cal-culations with aspect ratios ranging from 0.91 to 0.5 (Fig. 2), where the largest aspect ratio of 0.91 represents the smallest deviation from a spherical shape and the smallest aspect ratio of 0.5 the largest deviation. Figure 2 shows that both the lin-ear and circular depolarization ratios increase with increas-ing GMD of the particles. The increase in the depolarization ratio is significant up to 800 nm, whereafter the influence of the size of the particles decreases. Moreover, the higher the aspect ratio (the closer the particles are to being spherical), the lower is the expected depolarization ratio. In the least as-pherical case (aspect ratio 0.91), we estimate that the SOA particles have close to zero depolarization ratios at GMD be-low 400 nm and a maximum depolarization ratio that is close to 0.1 (linear depolarization) or to 0.25 (circular depolariza-tion) at GMD of 1400 nm.
As a result of these modelling studies, we can estimate that the internal inhomogeneity of SOA particles will most likely have only small, almost negligible effect on the depolariza-tion ratio and that the depolarizadepolariza-tion ratio is mainly deter-mined by the degree of particle asphericity. The T -matrix results showed that the particles with a GMD from 50 to 800 nm will only produce extremely small depolarization ra-tios, which will be challenging for the depolarization mea-surements. A high degree of sensitivity is required for the depolarization instrument; otherwise, the particles would re-quire growth to sizes larger than 1 µm.
Figure 1.The SOA particles were modelled as prolate spheroids. An Environmental scanning electron microscope (ESEM) image of the SOA particles sampled from the CLOUD chamber show a spheroidal “egg-like” shape. The shape of the SOA particles in the ESEM images does not necessary resemble the real shape of the particles in the chamber, due to sampling conditions. In the T -matrix notation the aspect ratio (AR) is determined as the relation between the equatorial radius and the polar radius (a / b) and is thus <1 for prolate spheroids.
3 Experimental methods
3.1 Depolarization measurements
We developed a new in situ depolarization instrument, SI-MONE1-Junior, with the necessary sensitivity to detect
very low depolarization ratios. SIMONE-Junior is based on the design of the first SIMONE instrument (Schnaiter et al., 2012), which is installed at the cloud chamber facil-ity Aerosol Interactions and Dynamics in the Atmosphere (AIDA) of the Karlsruhe Institute of Technology, with few improvements that have been implemented to attain the sen-sitivity and stability requirements that were identified in the simulations. SIMONE-Junior uses a continuous wave (cw) laser (Coherent 552 nm OBIS laser, 20 mW) to create a po-larized and collimated light beam that is directed horizon-tally across the chamber (Fig. 3). The incident linear polar-ization state of the laser beam can be aligned either parallel or perpendicular to the scattering plane by a liquid crystal polarization rotator. Moreover, in contrast to the AIDA SI-MONE, a liquid crystal variable retarder, able to be operated as a quarter-wave plate, was introduced to the system to allow generation of circularly polarized light. The orientation of the circular depolarization can be changed from right handed to left handed, although in this study we used only right-handed circular incident polarization.
1SIMONE is the acronym for the German project title Streulicht
intensitätsmessungen zum optischen Nachweis von Eispartikeln, which means scattering intensity measurements for the optical de-tection of ice particles.
0 200 400 600 800 1000 1200 1400
Lin. depolarisation ratio
10-3 10-2 10-1 100 101 0.91 0.82 0.74 0.61 0.5 GMD [nm] 0 200 400 600 800 1000 1200 1400
Circ. depolarisation ratio
10-3 10-2 10-1 100 101 λ = 0.552 µm, α = 176°, σ = 1.1 n = 1.5+i0.0 (Schnaiter et al., 2005)
Figure 2.To plan the experiment, the expected linear and circular depolarization ratios were modelled with the T -matrix model as-suming a spheroidal shape. A narrow particle size distribution with a constant GSD of 1.1 was used in the model and the GMD of the particles was varied from 0 to 1400 nm (x axis). The calculation was made for five spheroidal shapes with aspect ratios ranging from 0.91 to 0.5. The detection thresholds of the SIMONE-Junior instrument (1 % for linear depolarization and 2 % for circular) are indicated as dashed red horizontal lines. The modelling study indicates that the SOA particles need to be grown past 600 nm to produce a detectable depolarization ratio at aspect ratios up to 0.91.
Two telescopes collect the laser light scattered from the centre of the aerosol chamber at an angle of 4◦in the forward
direction and 176◦in the backward direction. While the
in-tensity in the forward scattering angle is directly measured with a photonmultiplier tube, the intensity in the backward scattering angle is decomposed into its polarization compo-nents by a Wollaston prism. In the case of circular polariza-tion, the scattered light is first retarded to linear polarization with a second liquid crystal variable retarder before the Wol-laston prism.
3.2 Experimental set-up
The experiments presented here were conducted at the CERN CLOUD chamber (Kirkby et al., 2011; Duplissy et al., 2015; Hoyle et al., 2016) during the CLOUD8 (November– December 2013) and CLOUD9 campaigns (September– November 2014). The chamber consists of a 26 m3 stain-less steel cylinder that is located inside a thermally insulated housing. The temperature of the chamber can vary from −60 to 100◦C and is controlled by regulating the temperature of
air flowing around the chamber and inside the thermal hous-ing. During the CLOUD8 and CLOUD9 campaigns, the
tem-Figure 3.The SIMONE set-up at the CERN CLOUD chamber. The instrument consists of two boxes facing each other. One box houses the laser production and the backward scattered light detector and the other box houses the forward scattered light detector and a beam dump. The green line illustrates the path of the laser beam, which crosses the field of view (purple line) of the detection optics. The overlap region defines a detection volume of a few cubic centimetres volume in the centre of the chamber.
perature inside the chamber was measured with a string of six thermocouples positioned horizontally at different distances between the wall and the chamber centre. We used the mean of the thermocouples as a representative measure of the tem-perature in the chamber volume.
In the course of the experiments, air from the chamber was constantly sampled; and this sampled air was replaced with humidified artificial air to maintain a constant pressure inside the chamber. The artificial air was created by evaporating liq-uid nitrogen and oxygen, and humidified by passing part of the flow through a Nafion humidifier to achieve a chosen con-stant RH. Alternatively, the air was passed through a heated line to the chamber, allowing the dew point of the incom-ing air to be higher than that in the chamber. The heated line was used at temperatures of −30◦C or lower, to enable rapid
RH increase. The water vapour was mixed with the main air stream before entering the chamber, which allowed a homo-geneous RH throughout the chamber volume after a mixing time of few minutes (Voigtländer et al., 2012). The RH inside the chamber was measured with a chilled mirror dew point hygrometer (MBW; model 973). During CLOUD9 a tune-able diode laser (TDL system) was used to measure water vapour, in addition to the MBW. The newly installed tune-able diode laser system will be described in more detail in the following section.
SOA particles were produced within the CLOUD chamber by ozonolysis of gaseous α-pinene; the two reactant gases were separately fed into the chamber through mass flow con-trollers. The ozone was monitored with a trace gas moni-tor (O3 analyser, Thermo Environmental Instruments, Inc.,
Model 49C); α-pinene was measured by a Proton Trans-fer Reaction Time of Flight Mass Spectrometer (PTR-TOF; Ionicon Analytic). The ozone concentration was
continu-ously measured, but, due to high concentrations of α-pinene (over 600 ppbv), the PTR-TOF signal saturated, so it could not be measure continuously. The production of SOA was enhanced by ultraviolet (UV) photolysis of ozone to form OH (hydroxyl) radicals. A 50 W UV source (Philips TUV 130 W XPT lamp) was installed in a quartz tube inserted into the chamber. The formed OH oxidized α-pinene to produce lower volatility organic vapours that nucleated and grew the aerosol particles.
Supporting measurements were provided by a range of in-struments that were used to measure the physical and chem-ical composition of the aerosol particles inside the cham-ber. The chemical composition of the sub-micron aerosol particles was measured with an Aerodyne high-resolution time-of-flight aerosol mass spectrometer (HR-ToF-AMS). From these measurements the atomic oxygen to carbon ra-tio (O / C) was determined. The size distribura-tion of the aerosol particles was measured with an Ultra-High Sensi-tivity Aerosol Spectrometer (UHSAS; DMT), which mea-sures the optical sphere equivalent diameter of the particles in a size range from approximately 60 to 1000 nm and with a Scattering Mobility Particle Sizer (SMPS), which measures the mobility diameter between 30 and 500 nm. The total con-centration of aerosol particles was measured with a Conden-zation Particle Counter (CPC; TSI 3010) with a 10 nm cut-off and with a maximum detectable particle concentration of 10 000 cm−3without coincidence corrections.
3.2.1 Relative humidity measurements
During the CLOUD9 campaign a tuneable diode laser (TDL) hygrometer, comparable to the APicT (AIDA PCI (Physical Chemistry Institute) in-cloud TDL) instrument as described by Fahey et al. (2014), was used to measure the water vapour content in situ. The TDL has 1 Hz time resolution and em-ploys a single optical path of 314 cm once across the mid-plane of the CERN CLOUD chamber. Its main component is a temperature controlled, 10 mW distributed feedback diode laser (NTT Electronics) at a wavelength of (1370 ± 1) nm. The water absorption line was fitted online to determine wa-ter concentrations based on well-known spectroscopic con-stants. The windows mounted on the chamber limited the measurement range to between 30 and 1300 Pa water vapour pressure (300 and 13 000 ppm mixing ratio); the measure-ment uncertainty was ±7 % above 100 Pa and ±10 % be-tween 30 and 100 Pa. The relative humidity in the CLOUD chamber was calculated using these humidity data together with the average temperatures measured with a horizontal string of four calibrated thermocouples at the mid-plane of the chamber. The TDL hygrometer data enabled determina-tion of the relative humidity even in the presence of clouds in the chamber, with an uncertainty of ±10 % above 100 Pa and ±13 % between 30 and 100 Pa water vapour pressure. The total humidity in the CLOUD chamber was also derived from the measurements from dew point hygrometer (model
MBW973, MBW calibration Ltd.) attached to a heated sam-pling line.
3.2.2 Experimental procedure
The aim of the experiments was to determine if a slightly as-pherical particle shape or internal inhomogeneity of the vis-cous amorphous SOA could be detected by sensitive, near-backscatter depolarization measurements and, if so, to ob-serve the transition from irregular to a spherical shape during RH change. The range of experiments required was deter-mined using the T -matrix modelling together with the lowest detection limit of the SIMONE-Junior instrument as guide-lines. Figure 2 demonstrates that, in order to measure a sig-nificant depolarization signal with the highest aspect ratio (0.91), particles with a GMD of at least 600 nm must be gen-erated. Furthermore, in contrast to atmospheric lidar applica-tions (e.g., Sassen, 1991; Hirsikko et al., 2014), the detection volume of the SIMONE-Junior instrument is small, around a few tens of cubic centimetres. This means that we would need a high concentration to have enough particles inside this small detection volume to produce measurable signals. We estimated that an initial concentration of 10 000 cm−3newly formed SOA particles would produce adequate signals once the particles reached the size of 600 nm.
Each experiment commenced with clean, aerosol-free air (background concentration well below 1 cm−3 and low RH
(ranging from 5 to 15 %). The chamber was kept at 5 mbar overpressure to avoid underpressure in the sampling instru-ments. The SOA particles were generated and grown in the chamber by continuous oxidation of α-pinene (max-imum concentration ∼ 600 ppbv) with ozone (max(max-imum concentration ∼ 700 ppbv), and OH radicals to form low volatility oxidized organic compounds. SOA nucleation was initiated by injecting α-pinene (10 mL min−1) and ozone (1000 mL min−1) into the chamber simultaneously for 1 to 7 min, depending on the chamber temperature, and then turn-ing on the UV light. After 1 min the α-pinene flow was turned off until the freshly nucleated particles had grown to a mean diameter of approximately 100 nm. This produced a near-monodisperse particle population. At this point the α-pinene flow was turned back on and continuously injected into the chamber in order to grow the existing particles without in-ducing further new particle formation. The initial particle burst typically comprised around 50 000–100 000 cm−3
α-pinene SOA particles, which rapidly grew to about 20 nm di-ameter. After the particles had grown to diameters of approx-imately 600 nm, losses due to dilution, coagulation, and the chamber walls had reduced the particle number concentra-tion to 5000–10 000 cm−3. After a significant depolarization signal had been detected, we increased the RH in the cham-ber to search for a transition to the liquid phase. The RH was gradually increased by injecting humidified air (RH 100 %) into the chamber while simultaneously mixing the air inside the chamber with fans. This was continued until the
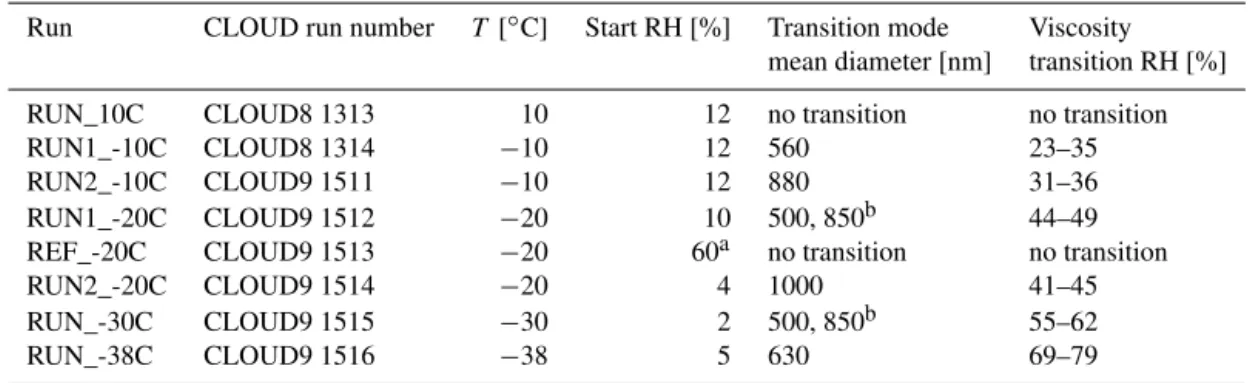
depolar-Table 1.Experiment list with experiment run number, starting temperature, relative humidity at the beginning, particle size before transition started, and measured relative humidity range for the viscosity transition.
Run CLOUD run number T [◦C] Start RH [%] Transition mode Viscosity mean diameter [nm] transition RH [%]
RUN_10C CLOUD8 1313 10 12 no transition no transition
RUN1_-10C CLOUD8 1314 −10 12 560 23–35
RUN2_-10C CLOUD9 1511 −10 12 880 31–36
RUN1_-20C CLOUD9 1512 −20 10 500, 850b 44–49
REF_-20C CLOUD9 1513 −20 60a no transition no transition
RUN2_-20C CLOUD9 1514 −20 4 1000 41–45
RUN_-30C CLOUD9 1515 −30 2 500, 850b 55–62
RUN_-38C CLOUD9 1516 −38 5 630 69–79
aRH varied between 60 and 70 %.bMore than one mode present.
ization signal had decreased to a constant zero-level. These experiments were performed at four different temperatures: −10, −20, −30, and −38◦C.
In addition to these transition experiments, we performed one reference run with a higher starting RH (60–70 %) at −20◦C. The nucleation and growth of the α-pinene SOA
particles was conducted in the same way as the other exper-iments but the high RH was kept constant throughout. The purpose of this reference run was to produce a similar size distribution of α-pinene SOA particles as in the viscosity-transition runs, while ensuring that the state of the particles did not change, i.e., remained liquid, so they could not induce depolarization. This run was used to verify the depolarization method for a SOA system and to exclude the possibility of artefacts. The operating conditions for the reference run and all the viscosity-transition runs are listed in Table 1.
4 Results and discussion
4.1 Sensitivity of the depolarization measurements
Imperfect alignment and non-ideal behaviour of the optical components can induce crosstalk between the parallel and perpendicular channels in the backward scattering direction; i.e., in the perpendicular channel a percentage of the paral-lel intensity is measured and vice versa. This crosstalk ulti-mately determines the limit of detection (LOD) for the de-polarization ratio. The LOD can also be defined as the depo-larization crosstalk that is measured in the case of spherical particles.
To determine the LOD, we measured the depolariza-tion ratio of laboratory-generated sulfuric acid (SA) solu-tion droplets. SA droplets are known to be spherical (e.g., Schnaiter et al., 2012), and since in the calibration we re-strict to sub-micrometre sizes, the SA particles should not in-troduce linear or circular depolarization at the measurement angle of SIMONE-Junior. Nevertheless, we measured a finite depolarization in the calibration experiments; this signal
rep-resents the crosstalk from the parallel channel to the perpen-dicular channel. To minimize this depolarization crosstalk, we optimized the alignment of the optical components by separately rotating the optical planes of each component un-til a minimum depolarization signal was measured. The mini-mum crosstalk depolarization signal in the case of linear (par-allel) incident polarization was 0.002, and, in the case of cir-cular (right-handed) incident polarization, 0.015. Moreover, it has to be kept in mind that the alignment of the instru-ment may change over time, as the instruinstru-ment is mounted on a chamber (Sect. 3.2, Fig. 3), whose walls move during the 200 mbar pressure expansions used for other experiments (a maximum displacement of 0.5◦was observed), and may
not return to the exact original position. This also means that the LOD will increase from the calibration value. To be ab-solutely confident that a measured depolarization signal is significant, we specified the LOD for linear depolarization to be 0.01 and for circular depolarization to be 0.02. If the de-polarization ratio is below these thresholds, we consider the particles indistinguishable from spherical according to our method.
4.2 Growth and coagulation of the α-pinene SOA particles
We performed eight SOA nucleation and growth experiments in the CLOUD chamber using identical initial conditions de-scribed in Sect. 3.2.2. Each experiment resulted in a nucle-ation event that was followed by rapid growth of the α-pinene SOA particles, producing a narrow particle size mode. Two examples of the growth of a single narrow mode are shown in Figs. 4 and 5. We fitted a log-normal distribution to the particle size distribution data to retrieve GMD and GSD. The GMD are shown in the first panels, and the GSD together with number concentration in the second panels. From the log-normal fit results, we see that the two runs presented in Figs. 4 and 5 are almost identical with respect to the par-ticle size distribution, even though they were conducted at different temperature and humidity conditions. Both size
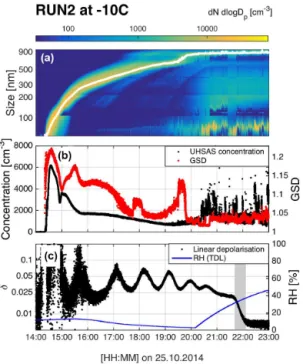
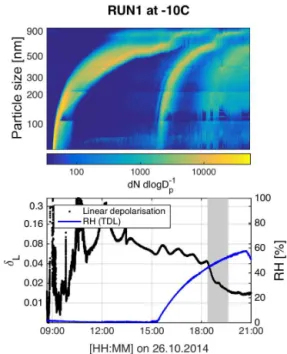
dis-Figure 4.Overview of RUN2 at −10◦C. The particle size
distri-bution and the GMD from a log-normal fit are shown in panel (a). Panel (b) shows the total concentration measured with the UHSAS (with 56 nm cut-off) and the GSD determined from a log-normal fit. Panel (c) shows the linear depolarization ratio and RH. The RH was kept low during the growth of the SOA particles, allowing them to remain in a viscous state. The RH was raised after about 20:15 UTC in order to measure its value at the particle phase transition from highly viscous to low viscosity state. The gradual phase transition began at 21:41 UTC and is indicated by the grey area in panel (c). The top and middle panels show further particle nucleation starting around 19:00 UTC; these particles remained relatively small and did not affect the measurement.
tributions are narrow with GSD variations between 1.05 and 1.2, and show similar total number concentrations. In each case, particles grew beyond 700 nm. The similarities between these two runs is important for interpreting the depolarization signals, as will be shown later.
Continuous addition of trace gases during RUN1_-20C, RUN_-30C, and RUN_-38C led to undesired nucleation events leading to a bimodal distribution of large (main mode with highest concentration) and small particles (secondary nucleation). The additional nucleation event always occurred before the viscosity-transition RH was reached, so we can as-sume that the state of the newly formed α-pinene SOA par-ticles was highly viscous. This assumption will be verified later with the depolarization data.
The high SOA particle concentration led to the formation of aggregates by coagulation inside the chamber. The coag-ulation process becomes an important determinant for the shape of the particles at sizes larger than 30 nm; it has been suggested that sub-30 nm SOA particles are sufficiently liq-uid (Virtanen et al., 2011) that they coalescence upon
coagu-Figure 5.Overview of the reference run at −20◦C. As for Fig. 4,
panel (a) shows the particle size distribution and the GMD from a log-normal fit. Panel (b) shows the total concentration measured with the UHSAS (with 56 nm cut-off) and the GSD determined from a log-normal fit. Panel (c) shows the time development of the linear depolarization ratio and the RH. During the reference run the RH was kept over 60 % during the growth of the SOA particles to ensure that they remained in low viscous state during growth. At the begin-ning of the growth (06:00–07:00), the SOA particles were too small to efficiently scatter light and the signal shown in panel (c) at that time is mostly noise. After the particles were larger than 100 nm, the linear depolarization ratio stayed below the detection threshold, indicating a low viscous state of the particles and verifying the ab-sence of measurement artefacts.
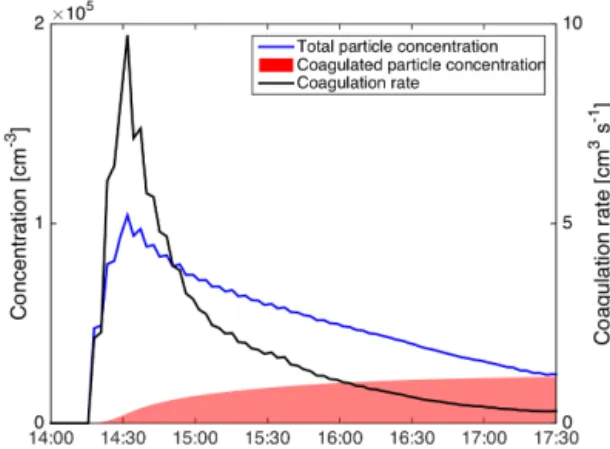
lation and, therefore, remain spherical. We estimated the co-agulation rate using the COmputer SIMulation of Aerosols (COSIMA) model of Naumann (2003), which was initial-ized with the size distribution measurements from the SPMS and with an estimated particle density of 1.25 g cm−3. The sticking probability was set to 1 in the model. Figure 6 shows the calculated coagulation rate together with the to-tal concentration from SMPS for the experiment RUN2_-10C (Fig. 4). A maximum concentration of 100 000 cm−3
was reached, which led to a coagulation rate of 10 cm−3s−1.
At 17:30 UTC the time integral of the coagulation rate was 23 000 cm−3, which gives an estimate of the number of
particles involved in the coagulation process. This num-ber is of the same order as the total numnum-ber concentration (25 000 cm−3) measured at the same time, indicating that the majority of the SOA particles were involved in coagulation processes and can be expected to have formed aggregates. As the particle number concentration decreases, the aggregation rate decreases to well below 1 cm−3s−1, making coagulation
Figure 6.COSIMA model results for the coagulation rate of the SOA particles during experiment RUN2 at −10◦C. The particle
number concentration was integrated from the SMPS measurements between 20 and 500 nm.
unimportant in the later phase. We can therefore expect that the SOA particles become aspherical aggregates at the be-ginning of the run and these aggregates subsequently grow by condenzation, forming quasi-spheroidal particles (Fig. 7), if the growth takes place when the particles are in a viscous phase.
The nucleation and growth conditions for the SOA par-ticles in these experiments at the CLOUD chamber are un-likely to be fully representative of the conditions where SOA is formed in the atmosphere (e.g., Dal Maso et al., 2005; Kul-mala et al., 2007, 2013; Kirkby et al., 2011; Riccobono et al., 2014). Viscous biogenic SOA particles have been observed to form in nucleation events in the boreal forest (Virtanen et al., 2010), where the concentrations of particles larger than 25 nm are typically below 100 000 cm−3 (Dal Maso et al., 2005). Lower natural particle concentration may not promote the formation of aggregates, and therefore it is uncertain if natural SOA particles can be expected to be aspherical.
4.3 Depolarization properties of the α-pinene SOA particles
We conducted a set of experiments with two different ini-tial conditions. The primary experiments were started at low RH, so that the nucleated SOA particles grew in an amor-phous solid or semi-solid state. In contrast to these runs, one reference run was made at −20◦C with a high initial
RH (60–70 %), so that the SOA particles started out in the aqueous phase state. The purpose of this reference run was to validate the depolarization method on a SOA system that would produce optically isotropic particles, and to exclude possible window artefacts. The SIMONE-Junior instrument is isolated from the chamber with two coated windows that do not change the depolarization ratio itself, but if material condenses to form a film on the windows, this might affect the measurements.
Figure 7.The SOA particles form aggregates at the early stage of their growth. After the coagulation rate has slowed, the aggregates grow by vapour condenzation to form non-spherical particles. The number of the single SOA particles in the aggregate is illustrative and does not necessary describe the real aggregates in the CLOUD chamber.
Figures 4 and 5 show the measured depolarization ratios of the α-pinene SOA particles during the reference run and dur-ing RUN2_-10C. Durdur-ing all the low-RH experimental runs below 0◦C, a depolarization ratio above LOD was measured,
whereas during the reference run, the depolarization signal stayed below the depolarization threshold of 0.01 throughout the growth of the SOA particles. Based on this comparison, we can conclude that at low RH the measured depolarization ratio was due to the physical properties of the α-pinene SOA particles and not a result of window artefacts.
The measured linear depolarization ratio averaged be-tween 0.01 and 0.1, and the circular depolarization ratio var-ied between 0.05 and 0.3 (Figs. 4 and 8). The circular de-polarization ratio was always higher than linear depolariza-tion ratio and both showed the same trend, i.e. both sig-nals showed the oscillation maxima and minima at same locations. This is a common feature in depolarization mea-surements, and has been discussed in previous work by Mishchenko and Hovenier (1995). In theory, the circular de-polarization ratio is more sensitive to small changes; this sen-sitivity should provide advantages over linear depolarization. However, in our case the LOD for the circular depolarization ratio was a factor of 2 higher than that for linear depolariza-tion ratio. Thus, for this instrument, circular depolarizadepolariza-tion offered no clear advantage in our measurements.
A depolarization ratio that is above the LOD and above the background noise in these experiments suggests the presence of aspherical particles. In this case the magnitude of the de-polarization signal depends on the size and shape of the par-ticles. The increase in the depolarization at the beginning of the runs can be linked with the growth in the particle size, as can be expected from the T -matrix model (Fig. 2). A median particle diameter of 100 nm was sufficient to produce a noise-free depolarization ratio above the detection threshold; the
Figure 8.An example of alternating measurements of the linear and the circular depolarization ratios during RUN_-30C. Both depolar-ization ratios show oscillations with consistent minima and maxima. The shape transition is indicated by the grey area.
highest depolarization ratio was measured for 600 nm parti-cles (Fig. 4). The maximum linear depolarization ratio varied between 0.05 and 0.1, which corresponds to an aspect ratio of 0.8 to 0.74 according to the T -matrix model for spheroidal particles. The good agreement of the spheroidal model with our measurements support the hypothesized presence of SOA aggregates that grow quasi-spheroidal. Later in the experi-ments, condenzational growth drives the particles to become increasingly spherical, which is also indicated by our mea-surements, as a slight decrease in the depolarization ratio as the particle median diameter grew beyond 600 nm.
In the early stages of experiment RUN2_-10C, we ob-served a single mode of growing α-pinene SOA particles (Fig. 4) suggesting that the depolarization properties of the particles were produced by a single particle population. The narrowness of the size distribution could explain the oscilla-tions that we frequently observed in the depolarization sig-nal. It should be possible to confirm this conclusion by sim-ulating the scattering properties of the evolving spheroidal particles, but that is beyond the scope of this work and will be addressed in a future study.
As described in Sect. 3.1, secondary nucleation occurred in some of our experiments, resulting in a bimodal size distri-bution. Figure 9 shows such a run with two growing modes. The main mode was somewhat wider than in the single-mode experiments, so we do not see clear oscillations in the de-polarization signal. A new narrow mode was nucleated af-ter 15:00 UTC, causing oscillations in the depolarization sig-nal, as the new mode grew. The measured depolarization is, therefore, likely due to the net scattering and depolarization contributions from both of these modes, making the interpre-tation of the depolarization properties more challenging. Al-though the size distribution is not confined to a single size in the bimodal runs, the phase of the new particles was viscous, since the mode was formed before a significant increase in RH. The asphericity of the new mode is also observed in the oscillations that are caused by the newly nucleated narrow mode.
Figure 9. An example of a run with two growing SOA parti-cle modes. The primary mode nuparti-cleated around 09:00 UTC and reached a median size of 600 nm around 15:00 UTC, when a sec-ond nucleation burst occurred. The new narrow mode produced the oscillations seen in the depolarization ratio after 15:00 UTC. The main mode was too wide and did not cause oscillations. These par-ticles exhibited a phase transition starting around 18:25 UTC. The noise in the depolarization signal at the start of the experiment is caused by low signal in the backward detectors.
4.4 The atomic oxygen to carbon ratio of the
α-pinene SOA
The atomic O / C ratio of SOA particles increases with ticle ageing and is related to the hygroscopicity of the par-ticles (Massoli et al., 2010; Duplissy et al., 2011; Lambe et al., 2011). The O / C ratio affects the particle deliques-cence point; in the case of α-pinene SOA particles, we can expect the deliquescence point to be at higher temperatures with increasing O / C ratio (Berkemeier et al., 2014). This might affect the particle shape and refractive index variation inside the particle, as higher hardness increases the possi-bility that the particles remain aspherical and thus induce a higher depolarization signal.
We measured the O / C ratio using the HR-ToF-AMS (Aiken et al., 2007, 2008). The measured O / C ratios varied from 0.23 to 0.29 with an average value of 0.25 ± 0.04 (av-erage ± standard deviation). Overall, the O / C stays pretty constant throughout the experiment (Fig. 10). The average O / C ratio (below 0.3) is similar to that reported by Pajunoja et al. (2014) of laboratory-produced α-pinene SOA particles. The SOA mass concentration shows a steep increase at the beginning of RUN2_-10C due to the continuous addi-tion of ozone and α-pinene to the chamber. At 15:35 UTC the
Figure 10.SOA mass concentration (green trace) and O / C ratio of the SOA particles (blue points) measured with the HR-ToF-AMS for RUN1_-10C. The grey highlighted area represents the phase transition. The mass concentration represents SOA formed via α-pinene ozonolysis; ozone was first added to the chamber during the period of steep growth at the beginning of the experiment. The de-crease in SOA concentration towards the end of the experiment was due to dilution. The O / C ratio stayed almost constant throughout the experiment.
SOA production rate decreased slightly as the fresh supply of ozone was reduced. After switching off the ozone supply at 20:20 UTC the formation of SOA was stopped and as a result the SOA concentration decreased due to dilution.
4.5 Measured viscosity-/shape-transition RH as a function of temperature
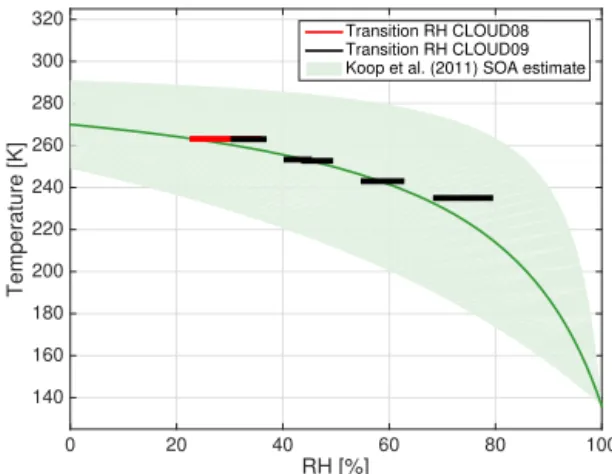
The depolarization signal in our experiments showed that the viscous α-pinene SOA particles were non-spherical when the nucleation and growth of the particles occurred at low RH. As the RH increases, the viscous SOA particles start to take up water. The water uptake is slow, and proceeds gradually with increasing RH (Mikhailov et al., 2009; Zobrist et al., 2011). This is seen by the relatively slow shape transitions observed as the RH increases (Figs. 4, 8, and 9). In the aque-ous phase, the surface area is minimized to reach an energet-ically favourable state. The minimization of the surface area results in shape change from aspherical to spherical. This change was observed in the depolarization ratio at the end of the low-RH runs, as the depolarization ratio decreased to-wards the instrument LOD. We determined the transition RH range from the measurements; the start of the transition was detected when the depolarization ratio started to decrease sig-nificantly. The end of the transition was detected when the depolarization ratio reached a constant level below the de-tection threshold (highlighted with grey in Figs. 4, 8, and 9). The RH value at the time the depolarization had decreased to a constant, zero level, describes the transition to an optically spherical shape. We label this RH value the viscosity-/shape-transition RH. RH [%] 0 20 40 60 80 100 Temperature [K] 140 160 180 200 220 240 260 280 300 320 Transition RH CLOUD08 Transition RH CLOUD09 Koop et al. (2011) SOA estimate
Figure 11.Transition RH at different temperatures. The horizontal lines show the RH range for the transition and the width of the lines represent the temperature uncertainty of 2 K. The green curve is the generic SOA estimate from Koop et al. (2011) and the shaded area represents the upper and lower boundary for the estimate.
Figure 11 summarizes the complete RH range, where the viscosity/shape transition were observed for sub-zero tem-peratures. At 10◦C a depolarization signal over LOD was not
observed, suggesting that the particles were already in a liq-uid or low-viscous state at a RH of 12 %. Figure 11 shows that the measured viscosity-/shape-transition RH increases with decreasing temperature and has near-linear dependency on the temperature. At −10◦C the viscosity/shape transition
occurred at RH around 35 % and at −38◦C the transition was
observed at around 80 % RH.
As explained above, our method does not directly mea-sure the change in the viscosity but provides the critical RH, where the water uptake is significantly enhanced and the par-ticles start to relax rapidly due to the change in their viscos-ity. During this process the viscosity changes of the α-pinene SOA particles are not limited by diffusion on water into the particles as the assumed water diffusion timescales can be expected to be of the order of seconds (Price et al., 2015; Lienhard et al., 2015). We can now use the observed relax-ation time (of the order of 10 min) to provide a rough esti-mate of the viscosity of the α-pinene SOA particles during their viscosity/shape transition. However, it has to be kept in mind that the particle viscosity and the relaxation timescale are affected by the constant increase in the chamber RH by about 0.5 % min−1, which increases the uncertainty of our
estimate.
For the estimation of the particle viscosity, we used the method described in Pajunoja et al. (2014). We can assume a primary particle size of 400 nm in an SOA aggregate and a surface tension of 35 mN m−1(Pajunoja et al., 2014). With these numbers we get an estimated viscosity of 107Pa s. This value describes the viscosity during the viscosity-/shape-transition period. Previous studies (e.g. Renbaum-Wolff et al., 2013; Bateman et al., 2014; Kidd et al., 2014;
Pajunoja et al., 2014) have consider the viscosity of α-pinene SOA particles at room temperatures. The studies have found that α-pinene SOA particles are generally in liquid state al-ready at RH > 70 % (Song et al., 2015). At colder temper-atures we can expect the transition from viscous to liquid state is shifted to higher RH (Wang et al., 2014). As the measured viscosity/shape transitions generally took place at RH < 70 % the comparison with literature would suggest that albeit our SOA particles were spherical, they probably were not in liquid state after the transition. Therefore, our mea-sured viscosity/shape transition would describe the change in the viscosity within a semi-solid material.
The viscosity of α-pinene SOA and their glass-transition as a function of temperature and RH was estimated in the modelling study of Wang et al. (2014). Although the authors reported an increase in the glass-transition RH with decreas-ing temperature similar to what we observed in our exper-iments, the glass-transition RH that they report was always higher than our measured viscosity-/shape-transition RH; i.e. we found higher viscosities for the α-pinene SOA parti-cles. Furthermore, we compared our results with the Koop et al. (2011) generic SOA estimate that predicts the glass-transition temperature as a function of RH for a broad va-riety of SOA (Fig. 11). Overall the results agree well with the generic SOA estimate, and significantly reduce the un-certainty in that estimate in the specific case of α-pinene SOA. Moreover, our results suggest the relationship between the transition RH and the temperature is more linear than predicted by Koop et al. (2011), although measurements at colder temperatures are missing.
Our method to detect the viscosity/shape transition of α-pinene SOA is likely limited to laboratory experiments with high number concentrations promoting the formation of non-spherical SOA particle aggregates. Although our exper-imental data are not comprehensive enough to support the hypothesis that SOA particles in the troposphere might be non-spherical, we have demonstrated the first non-invasive method to study the viscosity of SOA particles formed by ozonolysis of gaseous α-pinene. Moreover, the transition timescales that we observed, tens of minutes, are relevant to those that we can expect in the atmosphere. Therefore, the viscosity-/shape-transition RH that we report is relevant for the atmospheric processes. The present study focused on understanding the humidity effect on the viscosity-transition temperature of a single SOA component. The method could also be used in future studies to study SOA shape transitions of other SOA precursors.
4.6 Atmospheric implications
Atmospheric conditions where SOA is found cover the full range of RH (e.g. Hamed et al., 2011). The observed near-linear dependence of the viscosity-/shape-transition temper-ature on RH is important for the low tempertemper-atures; our results imply that α-pinene derived SOA particles may remain
vis-cous in the upper troposphere up to an RH of almost 80 %. Moreover, the long time required for the transition from as-pherical to sas-pherical suggest that, even though the particles may temporarily be exposed to high RH, they could remain in a viscous state. Hence, this kind of SOA particles may be able to act as IN, especially in the cirrus regime. The IN ac-tivity of the same α-pinene SOA particles produced for the present study has been investigated in a parallel study (Ig-natius et al., 2015) using a portable IN counter. They found that, at temperatures below or at the homogeneous freezing limit, the same particles acted as heterogeneous IN in the deposition and immersion modes. However, it is difficult to quantify the effect of the highly viscous SOA on climate; this should be addressed in future studies. Our results were restricted to temperatures above the homogeneous freezing threshold, but, to better understand the phase state of SOA in the cirrus regime, future studies at lower temperatures are needed.
5 Conclusions
The influence of temperature and relative humidity on the viscosity-transition of SOA particles is a subject of con-siderable uncertainty (Koop et al., 2011). Here, we esti-mated the viscosity of α-pinene SOA at different atmospher-ically relevant temperatures and relative humidities using a new optical and non-invasive in situ method. We used near-backscattering depolarization to measure the aspheric-ity of the SOA particles and their shape change to spheri-cal that took place at viscosity of around 107Pa s. The re-laxation timescales were observed to be 10 s of minutes – timescales relevant for atmospheric processes. Thus, we con-clude that the viscosity-/shape-transition RH defined by our method provides a quantity that is directly relevant for glassy transitions of SOA particles in the atmosphere, although the viscosity of the SOA particles cannot be directly determined from our measurements.
We showed that α-pinene SOA particles acquire a non-spherical shape due to coagulation in our chamber experi-ments. The non-spherical shape persists when the particles are nucleated and grown under low RH. This non-spherical shape is a result of the viscosity of the particles and this vis-cous state can be detected with depolarization measurements for SOA particles larger than 100 nm.
We observed viscosity/shape transition in six experiments conducted at four temperatures. We found that this viscosity-/shape-transition temperature depends linearly on RH; this increases the likelihood that α-pinene SOA particles persist in a viscous state at low temperatures, making them potential ice nuclei (IN) in the cirrus cloud regime. Generally, our re-sults improve the understanding of the viscosity of α-pinene SOA at temperatures above the homogeneous freezing point. The influence of highly viscous SOA on climate should be further assessed in future modelling studies.
Acknowledgements. We would like to thank the two anonymous referees for their valuable comments. We thank CERN for sup-porting CLOUD with important technical and financial resources. We thank the CLOUD-TRAIN community and specially all the ITN students for their help and support. This research has received funding from the Seventh Framework Programme of the European Union (Marie Curie-Networks for Initial Training MC-ITN CLOUD-TRAIN no. 316 662), from Swiss National Science Foun-dation (SNSF) grant number 200021_140663, from US National Science Foundation grants AGS-1447056 and AGS-1439551, from Dreyfus Award EP-11-117, from German Federal Ministry of Education and Research BMBF (project no. 01LK1222A and B), from the Davidow Foundation, and from the funding of the German Federal Ministry of Education and Research (BMBF) through the CLOUD12 project.
The article processing charges for this open-access publication were covered by a Research
Centre of the Helmholtz Association. Edited by: T. Koop
References
Adler, G., Koop, T., Haspel, C., Taraniuk, I., Moise, T., Ko-ren, I., Heiblum, R. H., and Rudich, Y.: Formation of highly porous aerosol particles by atmospheric freeze-drying in ice clouds, P. Natl. Acad. Sci. USA, 110, 20414–20419, doi:10.1073/pnas.1317209110, 2013.
Aiken, A. C., DeCarlo, P. F., and Jimenez, J. L.: Elemental analysis of organic species with electron ionization high-resolution mass spectrometry, Anal. Chem., 79, 8350–8358, 2007.
Aiken, A. C., Decarlo, P. F., Kroll, J. H., Worsnop, D. R., Huff-man, J. A., Docherty, K. S., Ulbrich, I. M., Mohr, C., Kim-mel, J. R., Sueper, D., Sun, Y., Zhang, Q., Trimborn, A., North-way, M., Ziemann, P. J., Canagaratna, M. R., Onasch, T. B., Al-farra, M. R., Prevot, A. S. H., Dommen, J., Duplissy, J., Metzger, A., Baltensperger, U., and Jimenez, J. L.: O / C and OM / OC ratios of primary, secondary, and ambient organic aerosols with high-resolution time-of-flight aerosol mass spectrometry, Envi-ron. Sci. Technol., 42, 4478–4485, 2008.
Bateman, A. P., Belassein, H., and Martin, S. T.: Impactor apparatus for the study of particle rebound: Relative humidity and capillary forces, Aerosol Sci. Tech., 48, 42–52, 2014.
Berkemeier, T., Shiraiwa, M., Pöschl, U., and Koop, T.: Compe-tition between water uptake and ice nucleation by glassy or-ganic aerosol particles, Atmos. Chem. Phys., 14, 12513–12531, doi:10.5194/acp-14-12513-2014, 2014.
Dal Maso, M., Kulmala, M., Riipinen, I., Wagner, R., Hussein, T., Aalto, P. P., and Lehtinen, K. E.: Formation and growth of fresh atmospheric aerosols: eight years of aerosol size distribution data from SMEAR II, Hyytiala, Finland, Boreal Environ. Res., 10, 323–336, 2005.
Dlugach, J. M. and Mishchenko, M. I.: Scattering properties of het-erogeneous mineral particles with absorbing inclusions, J. Quant. Spectrosc. Ra., 162, 89–94, 2015.
Duplissy, J., DeCarlo, P. F., Dommen, J., Alfarra, M. R., Met-zger, A., Barmpadimos, I., Prevot, A. S. H., Weingartner, E.,
Tritscher, T., Gysel, M., Aiken, A. C., Jimenez, J. L., Cana-garatna, M. R., Worsnop, D. R., Collins, D. R., Tomlinson, J., and Baltensperger, U.: Relating hygroscopicity and composition of organic aerosol particulate matter, Atmos. Chem. Phys., 11, 1155–1165, doi:10.5194/acp-11-1155-2011, 2011.
Duplissy, J., Merikanto, J., Franchin, A., Tsagkogeorgas, G., Kan-gasluoma, J., Wimmer, D., Vuollekoski, H., Schobesberger, S., Lehtipalo, K., Flagan, R., Brus, D., Donahue, N. M., Vehkämäki, H., Almeida, J., Amorim, A., Barmet, P., Bianchi, F., Breiten-lechner, M., Dunne, E. M., Guida, R., Henschel, H., Junninen, H., Kirkby, J., Kürten, A., Kupc, A., Määttänen, A., Makhmutov, V., Mathot, S., Nieminen, T., Onnela, A., Praplan, A. P., Riccobono, F., Rondo, L., Steiner, G., Tome, A., Walther, H., Baltensperger, U., Carslaw, K. S., Dommen, J., Hansel, A., Petäjä, T., Sipilä, M., Stratmann, F., Vrtala, A., Wagner, P. E., Worsnop, D. R., Curtius, J., and Kulmala, M.: Effect of ions on sulfuric acid-water binary particle formation II: Experimental data and comparison with QC-normalized classical nucleation theory, J. Geophys. Res.-Atmos., 120, 1752–1775, doi:10.1002/2015JD023539, 2015. Fahey, D. W., Gao, R.-S., Möhler, O., Saathoff, H., Schiller, C.,
Ebert, V., Krämer, M., Peter, T., Amarouche, N., Avallone, L. M., Bauer, R., Bozóki, Z., Christensen, L. E., Davis, S. M., Durry, G., Dyroff, C., Herman, R. L., Hunsmann, S., Khaykin, S. M., Mack-rodt, P., Meyer, J., Smith, J. B., Spelten, N., Troy, R. F., Vömel, H., Wagner, S., and Wienhold, F. G.: The AquaVIT-1 intercom-parison of atmospheric water vapor measurement techniques, At-mos. Meas. Tech., 7, 3177–3213, doi:10.5194/amt-7-3177-2014, 2014.
Guenther, A., Hewitt, C. N., Erickson, D., Fall, R., Geron, C., Graedel, T., Harley, P., Klinger, L., Lerdau, M., McKay, W., Pierce, T., Scholes, B., Steinbrecher, R., Tallamraju, R., Taylor, J., and Zimmerman, P.: A global model of natural volatile organic compound emissions, J. Geophys. Res.-Atmos., 100, 8873–8892, 1995.
Hallquist, M., Wenger, J. C., Baltensperger, U., Rudich, Y., Simp-son, D., Claeys, M., Dommen, J., Donahue, N. M., George, C., Goldstein, A. H., Hamilton, J. F., Herrmann, H., Hoff-mann, T., Iinuma, Y., Jang, M., Jenkin, M. E., Jimenez, J. L., Kiendler-Scharr, A., Maenhaut, W., McFiggans, G., Mentel, Th. F., Monod, A., Prévôt, A. S. H., Seinfeld, J. H., Surratt, J. D., Szmigielski, R., and Wildt, J.: The formation, properties and im-pact of secondary organic aerosol: current and emerging issues, Atmos. Chem. Phys., 9, 5155–5236, doi:10.5194/acp-9-5155-2009, 2009.
Hamed, A., Korhonen, H., Sihto, S.-L., Joutsensaari, J., Järvi-nen, H., Petäjä, T., Arnold, F., NiemiJärvi-nen, T., Kulmala, M., Smith, J. N., Lehtinen, K. E. J., and Laaksonen, A.: The role of relative humidity in continental new particle formation, J. Geo-phys. Res.-Atmos., 116, D03202, doi:10.1029/2010JD014186, 2011.
Hirsikko, A., O’Connor, E. J., Komppula, M., Korhonen, K., Pfüller, A., Giannakaki, E., Wood, C. R., Bauer-Pfundstein, M., Poikonen, A., Karppinen, T., Lonka, H., Kurri, M., Heinonen, J., Moisseev, D., Asmi, E., Aaltonen, V., Nordbo, A., Rodriguez, E., Lihavainen, H., Laaksonen, A., Lehtinen, K. E. J., Laurila, T., Petäjä, T., Kulmala, M., and Viisanen, Y.: Observing wind, aerosol particles, cloud and precipitation: Finland’s new ground-based remote-sensing network, Atmos. Meas. Tech., 7, 1351– 1375, doi:10.5194/amt-7-1351-2014, 2014.