by
KAMAL MOUSSA MLEK
S.B., MASSACHUSETTS INSTITUTE OF TECHNOLOGY (1982)
SUBMITTED IN PARTIAL FULFILLMENT OF THE REQUIREMENTS OF THE
DEGREE OF MASTER OF SCIENCE
IN
MECHANICAL ENGINEERING
at the
MASSACHUSETTS INSTITUTE OF TECHNOLOGY
May 1985
1 Kamal Moussa Malek 1985
Signature redacted
Signature oCertified b
Accepted by
f Author
Department of Mechanical Engineering May 24, 1985
Signature redacted
J. Karl Hedrick Thesis SupervisorSignature redacted
Ain Sonin Chairman, Departmental Graduate CommitteeArchives
MASSACHUSETTS INSTITUTE OF TECHNOLOGYAPR 28 1986
LIBRARIES I - --- A - - I - - --by
Kamal Moussa Malek
Submitted to the Department of Mechanical Engineering
on May 24, 1985 in partial fulfillment of the
requirements for the Degree of Master of Science in
Mechanical Engineering
ABSTRACT
In this study, a 7 degree-of-freedom vehicle model is
used to analyze how the coupling, which is present between
the various vehicle modes, affects the ride quality and
roadholding performance when sprung mass absolute body
velocity feedback is used in the control strategy. This
full-vehicle model makes it possible to study the response
in one mode when the vehicle is subjected to an input in
another mode.
It also allows the study of the tire normal
load distribution between the four corners.
Beside providing absolute body velocity feedback, the
active system is also used to make the suspension fully
interconnected.
This allows the independent specification
of all the suspension rates (stiffnesses, absolute and
relative damping rates), as well as the coupling rates.
Frequency response results obtained using existing
vehicle data show that when absolute damping is used,
decoupling the heave and pitch sprung mass modes both
improves body isolation, and reduces fore-aft tire load
transfer as the vehicle traverses an uneven road.
This
indicates that "flat-ride" turning may not be desirable when
absolute body damping is used.
Absolute body roll damping,
while improving body isolation, increases the effect of road
disturbances on lateral load transfer distribution.
It is
also found that for a road warp input, increased relative
damping is superior to absolute body damping.
Thesis Supervisor:
Dr. J. Karl Hedrick
I would like to dedicate this modest work to my
parents, M. and M. Their love and unfailing support over the years, and the sense of purpose which they have
instilled in me ultimately remain the driving force behind any endeavour.
My deepest gratitude goes to Big Brother Aziz who can be always counted on for his willingness to listen and for his good advice, as well as his boundless help. I cannot thank him enough.
I also want to thank my sister Ilham and brother Adel for their support and help.
I am indebted to Professor J. Karl Hedrick for being interested in supervising this thesis.
Many thanks to Terri Demeris for the excellent job she did in typing this manuscript with minimal turnover time. Her ability to dispose in an nour of what took days to generate was sobering, to say the least.
I would also like to thank all my friends at the
Vehicle Dynamics Lab, in particular Ademola, Dan, Eduardo, Pat, and Sean.
Finally, this page would not be complete without a
posthumus mention of the late "lemon" (yellow) 914 which got me interested in vehicle dynamics in the first place. It lived by Trailing-Throttle Oversteer, and died by it.
MTITLE PAGE - - - -- - - - - -- - - - -ABSTR ACKNO TABLE LIST LIST CHAPT 1.1 1.2
1.3
1 A I... ACT ... ... WLEDGEMENTS ... . OF CONTENTS... .... OF TABLES... OF FIGURES ... ... . ER 1 - INTRODUCTION ... Background... The Automobile Suspension ... 1.2.1 Ride Quality ... 1.2.2 Handling ...The Passive Suspension... The Active Suspension ...
Objectives of the Study ... Scope of the Study ...
'ER 2 - VEHICLE MODEL... Introduction ...
Overview of Vehicle Models Model Development ...
2.3.1 Model Description ... 2.3.2 Coordinate Transformation 2.3.3 Equation Derivation
'ER 3 - VEHICLE CONFIGURATIONS Symmetry and Coupling ... 3.1.1 Symmetry ... 3.1.2 Heave-Pitch Coupling 3.1.3 Roll-Warp Coupling... .L o 4
1.5
1.6
CHA2.1
2.2
2.3
PT CHAPT3.1
Pag ei
ii
iii
iv
vi
vii2
3
6
10
13
18
21
32
32
33
36
37
39
45
59
59
59
62
64
3.2 Control Strategy ... 3.3 Implementation ...
3.4 Vehicle Configurations
...
CHAPTER 4 - RESULTS .96*0090096666*9*... 4.1 Eigenvalues, Eigenvectors ... 4.2 Frequency Response ...4.2.1 Ride Quality Performance ... 4.2.2 Roadholding Performance ... CHAPTER 5 - CONCLUSION ...
5.1 Conclusions ...
5.2 Recommendations for Further Investigation
REFERENCES ... ... APPENDIX A ... Pac e
66
70
72
76
76
79
80
87
111
111
113
115
118
Table
No. Title Paqe
4.1 Vehicle Parameters 93
4.2 Damped Natural Frequencies (Hz) and Damping
Ratios of the Various Vehicle Modes 94 4.3 Damped Natural Frequencies, Damping Ratios, 95
and Eigenvector Amplitudes for the Heave-Pitch Subsystem
Figure
No. Title Paqe
1.1 A Typical Vehicle Suspension Model 22
1.2 Limits of Vertical Vibration, as 23 Recommended by Janeway
1.3 Fatigue or Decreased Proficiency Limits 24 Due to Whole-Body Vibration in the
Vertical Direction, as Recommended by the ISO
1.4 The Effect of Normal Tire Load (Fz) on 24 the Available Tractive Effort (Fx) and
Lateral Force at Various Slip Angles
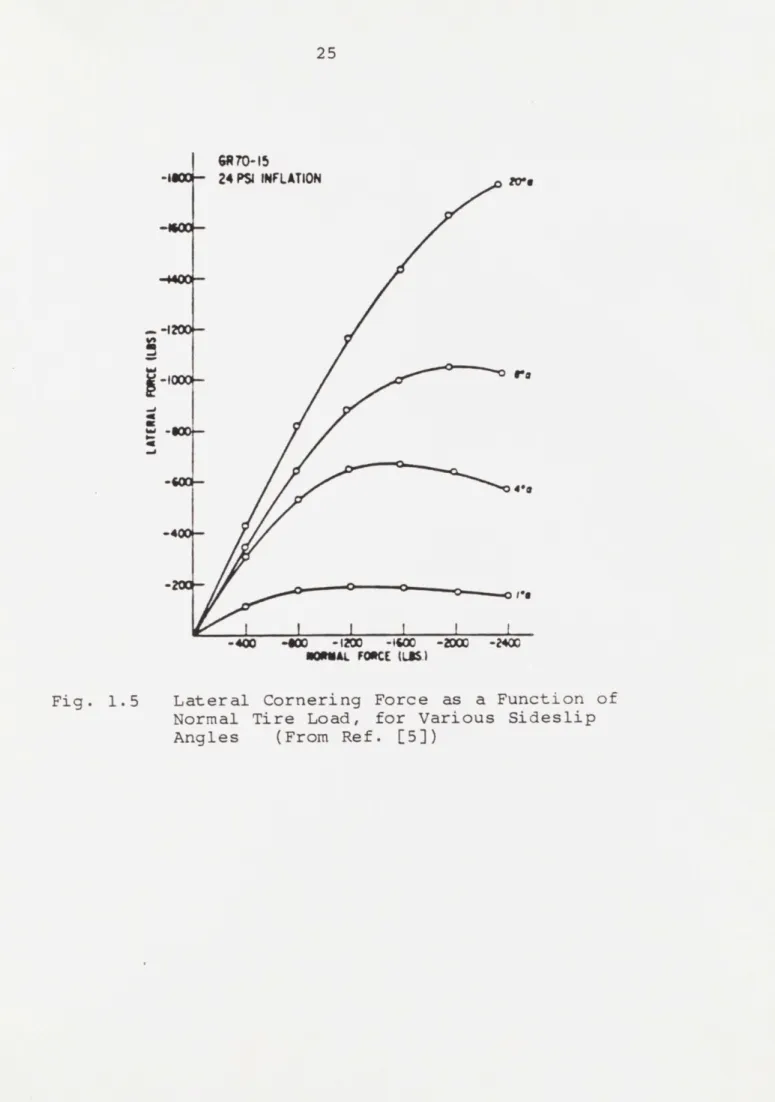
1.5 Lateral Cornering Force as a Function of 25 Normal Tire Load, for Various Sideslip
Angles
1.6 Simple Suspension Model (De Carbon), With 26 Typical Values Shown on the Side
1.7 Transmissibility of Road Input to the 27 Sprung Mass, for the System Shown in
Fig. 1.6
1.8 Variation in Tire Normal Load, Due to 28 Road Input, for the System Shown in
Fig. 1.6
1.9 Simple Active Suspension Model 29
1.10 Schematic Diagram of One of Four 30 Controllers Used in the Westinghouse
Inertially Stabilized Automobile
1.11 Simple Active Suspension Model, With 31 Absolute Body Velocity Feedback
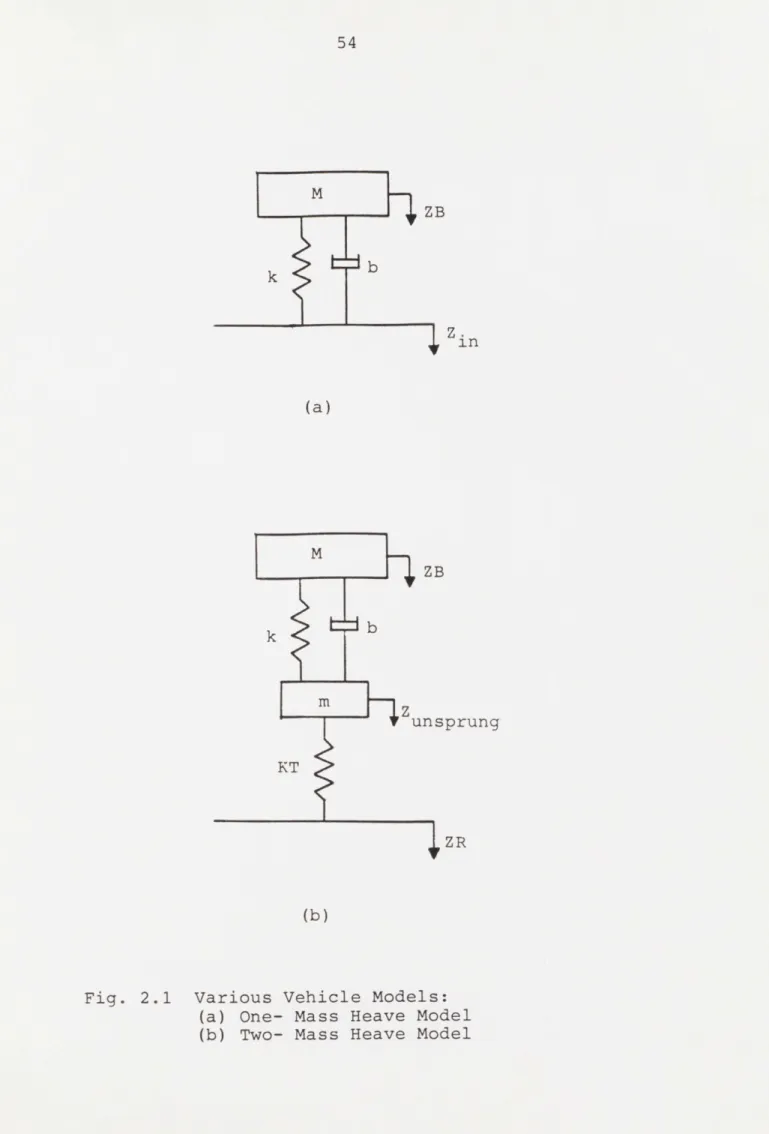
2.1 Various Vehicle Models 54
2.2 Seven d.o.f. Vehicle Model Used in 57 Present Study
Coordinate Transformation
Title
Vertical Acceleration at Driver's Location, Under Heave Input
Sprung Mass Heave Response to Heave Sprung Mass Pitch Response to Heave Figure No. 4.1 4.2 4.3 4.4 4.5 4.6 4.7 4.8 4.9 4.10 4.11 4.12 4.13 4.14 4.15 Heave Due Pitch Due Paa e 96
Input
Input
to
to
to Roll Input Roll Due to RollWarp Due to
to Warp Input Warp Due to
Roll Due to
Fore/Aft Tire Load Transfer Due to Heave Input
Fore/Aft Tire Load Transfer Due to Pitch Input
Tire Lateral Load Transfer Difference (LLTD) Between Front and Rear Axles, Due to Roll Input
Tire Lateral Load Transfer Difference (LLTD) Between Front and Rear Axles, Due to Warp Input
97 98 99 100 101 102
103
104105
106
107
108109
110
Suspension Compression in Heave Input Suspension Compression in Heave InputSprung Mass Roll Response Suspension Compression in Input
Suspension Compression in Warp Input
Sprung Mass Roll Response Suspension Compression in Warp Input
Suspension Compression in Warp Input
INTRODUCTION
1.1 BACKGROUND
Of all the numerous inventions since the industrial
revolution, the automobile or motor vehicle has undoubtedly
had one of the greater impacts on society in general.
Recent studies have indicated that despite the energy
shortages of the last decade and the accelerating reduction
in the world oil reserves, and despite the ever-tightening
emission regulations against both noise and atmospheric
pollution, the automobile is not likely to be replaced soon
by alternate modes of transportation.
In fact, it is
expected that the automobile, in one form or another, will
remain the main mode of personal transportation well into
the next century.
Over the one hundred years of its existence, the motor
vehicle, as an engineering system, has been gaining in
sophistication and complexity at an exponential pace.
This
has been due to various reasons, including advances in
technical knowledge and analytical capability on the part of
the designer, an increased demand from the consumer for a
better product, and fierce competition among the
manufac-turers to satisfy (or create) that demand.
Needless to say,
the microprocessor has been playing a major role in making
the car a more sophisticated system.
This trend is expected
seen today in the automobile market, and the resulting
need to provide a constantly improved product. Because the suspension, as a major subsystem of the automobile, directly influences many of its qualities and performance aspects, both subjective and objective, (ride quality, noise and vibration, handling, cornering, active safety, etc...), it has received increasing attention from the automotive engineer, and will continue to do so.
1.2 THE AUTOMOBILE SUSPENSION
The suspension is "the system of devices (such as springs) supporting the upper part of a vehicle on the
axles" (Webster's Seventh New Collegiate Dictionary). From that definition it is clear that the term "suspension" is a misnomer, and that "support" would be a better one. The term has been carried over from the days of the horse-drawn carriage, when the body was actually suspended from flexible
leaf springs which rose over their attachment points to be body.
The "upper part of a vehicle" in the above definition refers to the body or sprung mass; this consists of the structure housing the passenger and cargo compartments, as well as their contents, the engine and gearbox, and other mechanical parts. The "axles" refer to the unsprung masses of the vehicle; these consist of the tires and wheels, the
outboard brakes, and part of the driveshafts and of the
suspension and steering linkages.
Depending on the
parti-cular suspension design, there may be a solid axle, or there
may only be an imaginary line as in the case of an
inde-pendent suspension system.
In the case of a live rear axle,
the rear unsprung mass includes the differential unit and
its housing.
Strictly speaking, the unsprung masses are not
unsprung since the tires have finite stiffnesses.
Figure
1.1 schematically shows a vehicle and its suspension
system.
The suspension system has to perform two distinct
functions.
The first is to support and isolate the sprung
mass (mainly the occupants and the cargo) from any external
disturbances, such as road irregularities and wind gusts.
The second is to control the motion of the unsprung masses
so as to keep the tires in firm contact with the road
despite any disturbing inputs.
1.2.1
Ride Quality
The effectiveness of the suspension system in
perform-ing the first
function, namely isolating the body,
deter-mines the ride quality and comfort of the vehicle.
Although
vibrations in the vehicle can be caused by the various
sub-systems of the vehicle, for instance the drivetrain, or by
aerodynamic disturbances, those induced by road surface
by the vehicle occupants.
As with anything that depends
on
human perception, it
is impossible to objectively determine
precise measures for ride quality and comfort limits.
This
is caused by the variations in sensitivity from one
individ-ual.to another, and by the different methods used by the
various investigators who have undertaken such studies.
Nevertheless, there exists a large body of knowledge dealing
with the response of humans to vibration.
Of the many ride comfort criteria which have been
pro-posed, the best known are the Janeway comfort criteria
pub-lished by the Society of Automotive Engineers [1], and the
International Standard ISO 2631, 1974 [2], which deals with
whole body vibration.
Janeway divided the sinusoidal
fre-quency range from 1 to 60 Hz into three ranges, and
suggest-ed acceptable vertical vibration amplitude limits for each
range.
From 1 to 6 Hz, maximum values for the jerk (or rate
of change of acceleration) amplitude are given; from 6 to 20
Hz, peak values of vertical velocity amplitude are given;
and from 20 to 60 Hz, limits are given for the peak vertical
velocity amplitude.
These limits are shown in Figure 1.2.
The ISO standards deal only with
RMS
acceleration
resulting from sinusoidal vibration over the 1 to 80 Hz
frequency range; however, they not only consider vertical
vibration, but also longitudinal and
lateral ones.
They
and acceleration amplitude. These guidelines are the
"exposure limits" beyond which safety would be impaired, the "fatigue or decreased proficiency boundaries", and the
"reduced confort" boundaries. Figure 1.3 shows the limits for whole-body vibration for fatigue or decreased profi-ciency in the vertical direction.
Although the ISO standards are stricter for lateral and longitudinal accelerations, experiments conducted by the Motor Industry Research Association (MIRA) of England in
1960 and 1964 found very good correlation between ride comfort as perceived by the occupants, and vertical accel-eration. More specifically, in the 7-50 Hz range, the vertical acceleration of the floor correlated with the comfort ratings given by the test subject, whereas in the
0.75 - 6 Hz the vertical acceleration of the seat showed better correlation. Pitch and roll were not found to play any significant role in the ride quality. For these
reasons, vertical acceleration of the passenger is generally considered to be a good measure of ride comfort.
It should be noted that although the Janeway criteria and the ISO standards only consider vibrations above 1 Hz, the range from 0.5 to 1 Hz is also important, as it covers the frequencies at which motion sickness is felt when large amplitudes are present.
the fact that even if two persons are equally sensitive to
vibrations, the two might have different notions of what
constitutes good ride.
Where one might prefer a softly
sprung well-isolated luxury car, the other might find a
harder ride, which allows more road inputs to filter
through, more desirable, as it provides a greater feeling
of control.
1.2.2 Handling
Vehicle handling is an all-encompassing term which
reflects objective measures of the vehicle performance, as
well as the subjective "feel" it conveys to the driver
during maneuvers.
The maneuvers in question may involve
acceleration or braking, turning, or any combination
there-of.
The cornering ability of the vehicle is one aspect of
handling which can be measured objectively, using a circular
skidpad.
There are other tests used to measure the
road-holding capacity
and steering response of the vehicle, for
instance the slalom course, the J-turn, and others, but
these rely more on the skill and sensitivity of the driver.
Other more subjective aspects of handling include the
feed-back received by the driver through the steering wheel
(on-center feel, cornering force feedback), the brake pedal
feel, and more.
Because of all these parameters, it is not
possible to trace the handling qualities of a vehicle to one
handling.
For the purpose of this study, the aspect of handling
that is of interest is roadholding, which can be considered
the ability of the suspension system to successfully
maintain the tires in firm contact with the road.
The need to maintain the contact force at the tire/road
interface stems from the fact that the forces needed to
guide and control the vehicle are generated at that
inter-face.
These forces include the tractive effort needed for
braking and accelerating, and the lateral tire forces needed
for maintaining a given course despite external
disturb-ances, or for changing direction.
The capacity of a
pneumatic tire to generate a longitudinal, lateral, or
combined force is a nonlinear function of the normal load
acting on it.
Figure 1.4 presents data corresponding to a
typical pneumatic tire.
It shows families of curves, each
family corresponding to a different tire normal load FZe
In
each family, the x-axis corresponds to the longitudinal
force or tractive effort FX, while the y-axis corresponds to
the lateral or cornering force Fy.
Each curve, which is a
quarter of what is known as the tire ellipse, corresponds to
a constant angle of sideslip.
The angle of sideslip is
defined as that between the wheel plance and the actual
direction of travel of the wheel.
For a given slip angle,
of generating.
It should be noted that as the normal load
increases, both forces increase for a given slip angle.
This trend levels off beyond a certain point.
All the above
applies when there is no gross relative motion between the
tire and the road.
At higher levels of slip, either
longi-tudinal or lateral (sideslip), for instance when the tire is
locked, its force-generating potential is considerably
reduced.
From the above, it is clear that a good suspension
system should attempt to reduce as much as possible any
variation in the tire contact-force that results from road
irregularities.
That would make the vehicle handle better
over rough roads, other things (such as the amount of toe
and camber variation with suspension compression) being
invariant.
However, it
is not enough for the suspension to
main-tain the total tire contact-force at the four corners of the
vehicle constant.
It is more important to maintain the
desired distribution of the contact-forces between the 4
tires,
despite any disturbing input.
It is this
distribu-tion that will determine the basic handling characteristics
of a vehicle, other parameters being equal (weight
distri-bution, relative tire sizes, inflation pressures, suspension
geometry, wheel alignment, and many others)and that will
vehicle.
Before further explanation, a few terms will be
defined. The terms understeer and oversteer have been the subject of several definitions but a simple one will be used here. Understeer refers to the condition during
steady-state cornering where the front tires are experienc-ing larger sideslip angles than the rear ones. Oversteer refers to the opposite situation [2]. In general, oversteer is considered undesirable, as it makes the vehicle unstable above a certain critical speed, when subjected to lateral
disturbances [2,4].
Whether a vehicle will understeer or oversteer during steady-state cornering is mainly determined by the relation-ship between the lateral transfer of tire normal load at the
front axle and that at the rear axle. This is due to the fact that for a given angle of sideslip, the lateral force generated by the tire is a highly nonlinear function of the
tire normal load, as shown in Figure 1.5. The total
lateral force generated by the axle is the sum of the two forces generated by each tire, but because of the decreasing slope of the curves in Figure 1.5, two equally loaded
tires will generate more lateral force than two tires with the same total load divided unequally between them.
There-fore, if the tire load transfer is greater at the front than at the rear in an otherwise symmetric (front to rear)
front to generate the same lateral force as the rear, and
the vehicle will understeer.
The vehicle will oversteer if
the opposite is true.
This is explained in more details in
reference [5], from which Figure 1.5 is taken.
During a combined turning and braking, or turning and
accelerating maneuver, the understeer or oversteer
charac-teristics of the vehicle are affected by the relative
dis-tribution of braking forces between the front and rear
axles, as well as by the front-to-rear tire load transfer.
Generally, the suspension, steering, and braking
systems are designed to provide specific handling
character-istics when traversing smooth roads.
Ideally, these
charac-teristics should be maintained over rough roads.
The level
to which the handling characteristics are unaffected by road
roughness is a measure of the success of a given suspension
design.
For instance a very stiffly sprung sports car that
handles well over smooth roads, but is so unsettled by
bumps as to become difficult to manage cannot be considered
successful.
1.3
THE PASSIVE SUSPENSION
One of the simpler models used to study automotive
sus-pensions, known as the De Carbon model, is shown in Figure
1.6.
It is a linear, two degree-of-freedom
(d.o.f.),
lumped
element model, with motion in the vertical or heave
direc-first
representing the sprung mass or body, and the second
representing the unsprung or axle masses (the nomenclature
used follows standard SAE nomeclature [6] whenever
possi-ble).
The tire is modeled as a simple spring with constant
KT equal to the tire rate.
Tire damping, due to hysteresis
effects in the tire itself, is neglected.
The supporting
media are the spring K and the damper D.
The road
distur-bances are modeled as a displacement input to the tire.
This simple ride model can be used to gain some qualitative
feel as to how a suspension works, and what the compromises
involved are.
The data given in Figure 1.6 are typical of a
high-performance luxury GT car.
It can be seen that the sprung
mass is an order of magnitude larger than the unsprung one,
whereas the suspension spring rate is smaller than the tire
rate by more than an order of magnitude.
Because of that,
the frequency of the mode of vibration associated with
motion of the sprung mass is separated by more than a decade
from the frequency of the mode consisting mainly of unsprung
mass vibration.
The first
is about 1 Hz whereas the second
is above 20 Hz.
The suspension system thus acts as a
low-pass filter, as far as the sprung mass is concerned.
Figure
1.7 is a frequency response plot of the sprung mass motion
amplitude per unit input amplitude, over the frequency range
from 0.1 Hz to 100 Hz, for the system shown in Figure 1.6.
ratios of 0.25 and 0.5 respectively.
It can be seen that
for input frequencies below that of the body resonance, the
body follows the input.
The response peaks at the body
resonant frequency, after which it decreases steadily,
except for another local peak at the frequency corresponding
to the unsprung mass resonance.
The body is effectively
isolated from high frequency inputs.
One of the compromises facing the suspension designer
is selecting the optimum damping.
From Figure 1.7 it
can be
seen that using the higher damping ratio reduces the motion
transmissibility at the low frequency unsprung mass
reson-ance, and would thus provide better passenger isolation
around that frequency.
The trade-off however occurs at
higher frequencies, where the increased damping results in
worsening isolation up to the high frequency resonant peak
which is not affected much.
Beyond that peak, the roll-off
rate is decreased also.
This is due to the fact that the
higher frequencies result in an ever-increasing relative
velocity across the damper which consequently "hardens".
As
mentioned above, the second peak is not reduced by the
increased damping, some tire damping would be needed to
achieve such an improvement.
The increased damping is also beneficial as far as tire
normal load is concerned.
Figure 1.8 shows the variation in
that load from the static equilibrium value, as a function
results in smaller variation at the two resonant peaks, as
well as more uniform variation between these two
frequen-cies.
In order to circumvent the low-frequency versus
high-frequency isolation, as well as other compromises of
the passive suspension, the active suspension system was
proposed.
1.4 THE ACTIVE SUSPENSION
In the previous section, we saw one aspect of the
limitations of passive suspensions in isolating the body
from road disturbances.
That limitation was due to the
reliance on a simple damper in parallel with the spring as
supporting media.
Since the 1930's, suspension systems
which would eliminate the shortcomings of that arrangement
have been considered.
Significant work on these active
suspension systems has been carried out since the 1950's,
following advances in the development of high-performance
servo-mechanisms using feedback control.
In their 1975
review of the
state-of-the-art of active
suspensions for ground vehicles
[7],
Hedrick and Wormley
define an active suspension as one that may rely on
externally-supplied power for its operation.
In a typical
hydraulic, pneumatic, electric, or any combination.
Unlike the passive suspension which, by virtue of its
spring and dampers can only temporarily store, return, or
dissipate the energy input due to road disturbances, the
actuator force (FA) in the active suspension does not depend
upon the input time-history.
The energy input to the active
suspension can be modulated according to any arbitrary
control law.
This frees the suspension from the limitations
imposed by the constitutive relations of the
spring and the
damper.
The suspension force is no longer function of the
relative displacement and the relative velocity only, but it
can be function of any variable, either local or remotely
measured.
Also, these measured variables can be arbitrarily
processed before being used to generate the suspension
force.
The active suspension can thus be made to adapt to
varying inputs, road conditions, or just driver taste.
Because of its need for an external power source, the
active suspension suffers from disadvantages relating to
cost, complexity, and safety in the case of a power failure.
Moreover, as with any complex
system, maintenance becomes an
important requirement, especially in view of the rough
operating environment involved.
The heart of an active suspension system is the control
strategy used to generate the suspension force.
Many
reflect factors such as body isolation, suspension stroke requirement (rattlespace), actuator force or power require-ments. Again, the state-of-the-art review by Hedrick and Wormley [7], or a later one by Goodall and Kortum [8], cover the various developments of active suspension systems.
One of the first applications of active suspension in the automotive field is the system designed and built by the Westinghouse Research Laboratories in the lates 1950's [9].
The control strategy used is based on the sprung mass accel-eration, mostly in the vertical direction, but also in the horizontal plane. The system relied on acceleration feed-back to increase the effective sprung-mass inertia several-fold, thus reducing the sprung-mass resonance frequency and improving ride quality. Additional passive damping is used to control the increased displacement at the reduced fre-quency. The controllers, installed at each corner of the sprung-mass, consist of a spring-damper mounted masses with feedback compensation, and rather complicated fluidic
circuits (Fig. 1.10). These controllers can be tilted in the longitudinal or frontal plane to provide inertial stabi-lization against pitch and roll, or they can be turned
around to cause banking of the sprung mass during corner-ing.
design an active suspension system, and considers two
different arrangements, both based on a
2 d.o.f.,
heave-only model.
One arrangement consists of the actuator
mounted parallel to the spring, whereas in the other both
are mounted in series.
A sensor arrangement which allows
banking control of the body is also presented.
A system which may appear similar to the
above-mentioned Westinghouse design, but which is actually quite
different, is that developed by Automotive Products of
England, and tested in a Rover automobile [11].
This system
is a high-gain self-levelling system which counteracts body
motions due to dynamic body forces generated during
cornering, and acceleration or braking.
It does not respond
to road disturbance inputs, which are left for the passive
component of the suspension to deal with.
Another control strategy often used is full state
variable feedback.
It has been used both in the context of
pole placement techniques [12,13,14], as well as optimal
control [15,16].
Hullender et al. [15]
show that for a one
d.o.f. suspension system subjected to a random input, the
optimal suspension consists of a spring supporting a mass,
and of an absolute damper, i.e. an active force actuator
responding to absolute body velocity feedback (Fig. 1.11).
That suspension is optimal with respect to a quadratic
performance index penalizing suspension stroke as well as
combined with body acceleration feedback, to improve the vertical and lateral ride quality, as well as the lateral stability of railway cars.
Absolute body velocity feedback, or absolute damping has received increased attention lately [14,17,18], and is the control strategy of interest in the present work. One of the attractions of absolute damping is its relative ease of implementation, as only one sensor is needed to measure body acceleration, and a single integration of that
signal yields the absolute body velocity. Another advantage lies in the possibility of extending the results obtained with an active absolute damper to a semi-active one, with
little loss of system performance, using a modulable passive damper [14]. A semi-active system is one which does not
require external power input, but in which the passive forces are modulated according to some control strategy.
In Ref. [17], the concept of absolute velocity feedback is extended to the unsprung mass in a 2 d.o.f. heave-only model in an attempt to control wheel hop. It is shown that even an active suspension system still presents a trade-off as far as providing body isolation while at the same time controlling the motion of the unsprung masses. This
conclusion, similar to the one Thompson reaches in [10], is caused by a limitation due to the structural layout of the
and opposite forces to the sprung and unsprung masses.
Karnopp [18]
reaches similar conclusions, but also
develops a simple criterion to help determine whether active
damping will bring any significant performance improvements
in a given application.
1.5 OBJECTIVES OF THE STUDY
Most studies reviewed in the previous section utilize
Heave-only,
1
or 2 d.o.f. models to design or to analyze the
performance of active suspensions. Because of their rela-tive simplicity, these models are very useful for under-standing active suspensions and for designing control strategies, as demonstrated by the vast body of knowledge that has been built around them. In designing a full
suspension system, one could use a one-dimensional two-mass model for each of the vehicle modes, namely heave, pitch, roll and warp. Such an approach however would not reflect the fact that there is coupling between those modes. Static coupling between heave and pitch is usually unavoidable
because it may be necessary to fit springs of unequal stiffness at the front and at the rear, even in a vehicle with equal front-to-rear weight distribution. This may be done for various reasons:
9 vehicles without load-levelling devices may require stiffer springs under the cargo compartment, in
under full load;
* the designer may choose specific locations for the
pitch and bounce centers of the sprung mass, in
order to obtain a given ride characteristic, a "flat
ride" at a given speed for instance [2,19];
* the choice may be made in order to obtain
the desired handling characteristics.
Stiffer
springs at the rear could be used to alter the
front-to-rear suspension roll couple distribution
and cause more tire load transfer at the rear,
resulting in less understeer (or more oversteer)
[5,20].
The suspension roll and warp modes are usually coupled
because of the desirability of having unequal roll couples
at the front and at the rear.
As the above indicates, coupling between the various
modes is a very important tool used by the designer to
confer on the vehicle specific handling and ride
characteristics, and therefore cannot be neglected.
Although both Thompson [10], and Hanna and Osbon [9]
consider a full
vehicle with banking control, they only
provide an analysis of the steady-state banking moment
needed.
The effect that active suspension control has on
the handling characteristics as the vehicle traverses an
uneven road is not discussed.
heave and pitch motions, but the model he uses does not include unsprung masses, and therefore cannot predict the effect of the control strategy on tire normal loads, and thus on handling.
From the point of view of ride comfort, Margolis found that active damping results in decreased body isolation in certain cases. Specifically, the body pitch response to a heave input, and vice versa, increased compared to the
passive system. This effect was more marked in the case of full state variable feedback.
The objective of the present study is to analyze active suspension systems using a model which reflects the coupling present between the various degrees of freedom in a real vehicle. Such a model should also allow the effect of active control on vehicle handling to be assessed.
In a first step, a model including 7 d.o.f. is
developed. In that model the remote sensing capability of the active suspension is used to provide full interconnec-tion between the four corners of the vehicle, and thus to develop the most general suspension system, while maintain-ing the symmetry requirement. An example of suspension
interconnection are the anti-roll bars, or stabilizers which are common in today's cars. Another is the Moulton
front-to-rear interconnected suspension [21].
effect of coupling on vehicle ride quality and handling,
when body absolute velocity feedback is used.
That control
strategy was chosen for the advantages which have been
described previously.
A partially decoupled suspension configuration is used
to eliminate the disadvantages found by Margolis [14], while
at the same time leaving the handling characteristics
unaffected.
1.6
SCOPE OF THE STUDY
This first
chapter has presented some necessary
back-ground material concerning suspension systems in general, as
well as some ride confort and handling considerations.
Active suspensions were presented, along with a review
of previous work of particular interest to the present
study.
The vehicle model used, along with the corresponding
equations of motion, are presented in Chapter 2.
Chapter 3 discusses the various suspension
configura-tions, including coupling and absolute damping.
Results corresponding to the various configurations,
and based on parameters from a current production
automo-bile, are presented in Chapter 4.
Finally, the conclusions of the study and
recommenda-tions for future work are summarized in Chapter 5.
OPITCH SPRUNG BOUNCE MASS z SUSPENSION SPRING SHOCK ABSORBER UNSPRUNG MASS
TIRE SPRING TIRE DAMPING
Fig. 1.1 A Typical Vehicle Suspension Model (From Ref. [2])
mm in 10 8 6 RECOMMENDED LIMITS 100 - 4 -2 f=1TO6Hz MAX 10 JERK 8 CONSTANT 6 10 - 4 f =6 TO 20Hz 2 MAX ACCELERATION 0.10 CONSTANT 8 6 4-f =20 TO 60 Hz MAX 2 ~VELOCITY CONSTANT 0.01 -< 6 01 4 2 0.001 8 6 0.01 - 4 2 0.0001 1 2 4 6 8 10 20 40 60 Hz VIBRATION FREOUENCY f
Fig. 1.2 Limits of Vertical Vibration, as Recommended by Janeway
10.0 Er1.0 x 9
50-z
1.0= 0 cc 0.5-w -< -0.5 110dB-005
Smin 16ml 25 min 1 hr 2.5 h r 4 hr 8 hr I I I I I I I 0.5 10 20 50 100 200 FREQUENCY fFig. 1.3 Fatigue or Decreased Proficiency Limits Due To Whole-Body Vibration in the Vertical Direction, as Recommended by the ISO (From Ref. [2])
F
z-
1200 lb F7 . , Fz
-*-2' 800 6001 200 J =0-8 10 2* 6* 4. S 400 800F
100 60 0 400 X(lb)8*
100 20 0 400Fig. 1.4 The Effect of Normal Tire Load (Fz) on the Available Tractive Effort (Fx) and Lateral Force at Various Slip Angles
(From Ref. [3])
G670-15 - 24 PSI INFLATION 2'r
r-.
-IM -400 -M -12W -% -2= -24 OMMAL FORCE (LS.)Fig. 1.5 Lateral Cornering Force as a Function of Normal Tire Load, for Various Sideslip Angles (From Ref. [5])
F
M
k b - Zbody m k zaxle T 1Iz M = 1400 Kg k = 80 KN/m m = 140 Kgk
= 3,200 KN/mbody=
0.25 - 0.40Fig. 1.6 Simple Suspension Model (De Carbon), With Typical Values Shown on the Side
SIMPLE
SUSPENSION
-- 25% CRITICAL BODY DAMPING --- 50% CRITICAL BODY DAMPING
>-U
0
10
FREQUENCY
(HZ)
Fig. 1.7 Transmissibility of Road Input to the Sprung Mass, for the System Shown in Fig. 1.6 1 10 0 10 10 1 -2 10 -3 -4 L 10 . I 100 ' ' ' I'
SIMPLE SUSPENSION
1 10
FREQUENCY
(HZJ
Fig. 1.8 Variation in Tire Normal Load, Due to Road Input, for the System Shown in Fig. 1.6 5 10
z
0 H 0z
0 u E-4 4 10 3 10-- 25% CRITICAL BODY DAMPING 50% CRITICAL BODY DAMPING
21
FA: active control force
-Z -Z
Simple Active Suspension Model MF
FA
rn
Accelerotion
Cover
Sensing Memer Cover Vent Compensating Piston
I LeofDapn
oht Feedback I Spring - Damping Dashpot
Piston I Pivot
c'G
Bimetallic Domper Pilot Gravity SpringValve LReservoir
Prse Main Supply Anti-sing Fixed Pilot
Orif ice Orifice
Exhaust Valve H req. Min. Press.
Bias Filter-Co. Valve
Pressure
Exhaust Inlet Valve Damping et P Orifice and Floating N N Valves
Plug Reservoir Actuator Actuator Upper Lower
Cylinder Cylinder
Fig. 1.10 Schematic Diagram of One of Four Controllers Used in the Westinghouse Inertially Stabilized Automobile
Z B
z B
SF A
Fig. 1.11 Simple Active Suspension Model, With Absolute Body Velocity
Feedback
FA : active control force
VEHICLE MODEL
2.1 INTRODUCTION
The automobile is a rather complex engineering system. From a system dynamics point of view, an accurate model representing all the subsystems that can vibrate would
involve multiple degrees of freedom. To start with, such a model would include the dynamic modes of the vehicle body. Beside the 6 d.o.f.'s needed to describe the gross motions of the vehicle, an infinite number would be required to
model the vibratory modes of the body structure itself, such as torsion and bending. The sub-assemblies such as the
engine and transmission, the propeller shaft (if present) and the driveshafts, the various components of the suspen-sion, the steering system (including the steering column and steering wheel),, as well as others, should be included.
These various asemblies are not rigidly mounted to the
vehicle structure, and can thus vibrate relative to it. In fact, such vibrations are very often the cause of occupant discomfort in actual automobiles, and are the subject of
extensive analysis by the manufacturers. Unfortunately, each of these assemblies would require several d.o.f.'s for a complete description. A complete dynamic model of the
vehicle should include the rotating and reciprocating
torques that result from these rotating inertias can affect handling, not to mention the vibrations they generate.
Moreover, the occupants are suported by the seats which are relatively compliant, and they should be treated as sub-assemblies of the whole system, even if the human body is assumed a rigid mass instead of the mass-spring-damper
system that it is. Clearly, such an accurate model would be difficult to generate and even more difficult to analyze. Besides requiring sizeable computational power, its
complexity will result in the loss of any physical insight into the system being analyzed.
As a general rule, the best model is the simplest one which can represent the phenomena being analyzed, and
provide the answers sought. For instance, a more complex model would be needed if accurate numerical results, as opposed to general trends, are needed.
2.2 OVERVIEW OF VEHICLE MODELS
In general, vehicle models tend to fall into one of two categories: ride models, and handling models. In the higher order models, this distinction is no longer valid however.
The simplest ride model is the one-mass, heave-only model used, for example, by Hullender et. al. [15]. Because of the large difference in bandwidth between the sprung and
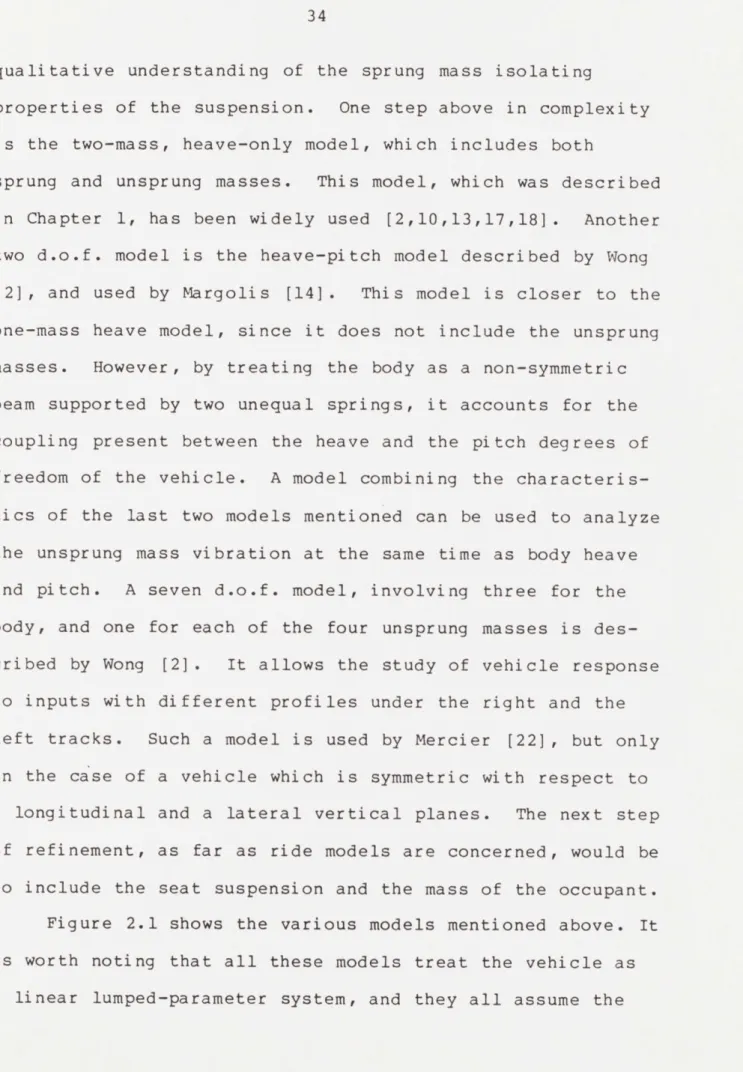
One step above in complexity
is the two-mass, heave-only model, which includes both
sprung and unsprung masses.
This model, which was described
in Chapter 1, has been widely used [2,10,13,17,18].
Another
two d.o.f. model is the heave-pitch model described by Wong
[2], and used by Margolis [14].
This model is closer to the
one-mass heave model, since it does not include the unsprung
masses.
However, by treating the body as a non-symmetric
beam supported by two unequal springs, it accounts for the
coupling present between the heave and the pitch degrees of
freedom of the vehicle.
A model combining the
characteris-tics of the last two models mentioned can be used to analyze
the unsprung mass vibration at the same time as body heave
and pitch.
A seven d.o.f. model, involving three for the
body, and one for each of the four unsprung masses is
des-cribed by Wong [2].
It allows the study of vehicle response
to inputs with different profiles under the right and the
left tracks.
Such a model is used by Mercier [22], but only
in the case of a vehicle which is symmetric with respect to
a longitudinal and a lateral vertical planes.
The next step
of refinement, as far as ride models are concerned, would be
to include the seat suspension and the mass of the occupant.
Figure 2.1 shows the various models mentioned above. It
is worth noting that all these models treat the vehicle as
a linear lumped-parameter system, and they all assume the
given road profile.
The main difference between ride models and handling
models, is that the formers do not account for the lateral
displacement of the vehicle, or for its yaw or rotation
around the heave axis, they thus assume that the road
traversed is straight.
The simplest handling model, known
as the bicycle model [2,3], consists of two degrees of
freedom, one for vehicle sideslip, and one for vehicle yaw.
The unsprung masses are not modeled separately, and the
vehicle is not allowed to roll; the tires are modeled as
lateral stiffnesses.
The model permits investigating the
effect of the location of the center of gravity, and the
front and rear tire stiffnesses, on the understeer or
over-steer characteristics of the vehicle during constant speed
maneuvers.
A more refined handling model is the one
pro-posed by Segel [23], and used widely.
The model considers
the vehicle
as a three-dimensional system, consisting of an
unsprung mass representing the whole vehicle, with freedom
to yaw and sideslip, as well as a sprung mass constrained to
roll about an axis fixed to the unsprung mass.
Another
degree of freedom could be added for the steering system, to
account for the inertia and compliance there.
In the latter
case, it becomes possible to study the "free control" of the
vehicle, where a torque input is applied to the steering
wheel, as opposed to "fixed control" where the steering
A handling model using a totally different approach is
the one developed by Ellis [24]. In this model, no roll axis
is assumed, and the unsprung masses are not given separate
degrees of freedom, but they are assumed "geared" to the
sprung mass.
Therefore, they cannot vibrate independently,
and the model is only valid over smooth roads with no
disturbances, although degrees of freedom for body heave and
body pitch are provided.
The six degrees of freedom are
those of the whole vehicle.
Variable forward speed, as well
as coupling effects due to the particular suspension
geometry are accounted for.
Higher order models, which can be used to analyze ride
quality and handling at the same time, have been developed,
and are commonly used.
The simplest has ten degrees of
freedom, six for the body and one for each of the four
unsprung masses.
Eleven degrees of freedom can be used, if
the steering system dynamics are of interest.
Some models
include a rotational degree of freedom for each of the
unsprung masses, normal to the wheel plane.
An example of
such a model is that used at the University of Michigan
[25].
2.3
MODEL DEVELOPMENT
The model used in this study is a seven d.o.f. ride
model.
The model is first described below, and its
advant-description of a coordinate transformation which is of importance in deriving the equations of motion and in analyzing the system. Finally, in a third section, the equation derivation is outlined.
2.3.1 Model Description
The model used is shown schematically in Figure 2.2. It has seven degrees of freedom:
* Three degrees of freedom for the sprung mass which is assumed rigid. Relative to a reference origina-ting from the center of gravity of the sprung mass, these are the heave H, or vertical translation, the roll R, or rotation about the longitudinal axis, and pitch P, or rotation about the lateral axis, as
shown in Fig. 2.2;
* One degree of freedom for each unsprung mass. The four unsprung masses are lumped independently. Each is assumed to move in a direction normal to the
plane of the body. Furthermore, the unsprung masses can only transmit forces through the suspension
springs, dampers, and active elements. These forces are assumed normal to the plane of the sprung mass. It should be noted that the coordinates chosen are only valid for small displacements and rotations, since the
were used to locate the body in space. The rotations have to be small enough for the small angle approximation to be valid.
The whole system is assumed linear, and the stiff-nesses, both of the suspension and of the tires, as well as the damping rates, whether relative or absolute, are con-stant. Although a real vehicle exhibits many non-lineari-ties, both geometric and constitutive, the linear model is justifiable since the object of the study is not to obtain accurate numerical results, but rather to understand the general behavior of the system.
The small amount of damping present in the tires is neglected, and the tires are thus modeled as linear springs. In terms of energy dissipation, tire damping has a secondary effect compared to the damping present in the suspension
[2]. In fact, if the body is assumed inertially fixed, and the unsprung masses are allowed to vibrate, tire hysteresis would provide only about 10% of critical damping for the unsprung masses, according to results obtainied by Overton, Mills, and Ashley [26].
Another assumption concerning the tires is that they remain in contact with the road at all time. The road
itself is assumed to provide the only inputs to the system, as the vehicle travels at a constant speed in a straight line.
respect to a longitudinal vertical plane through its middle.
Although the model described above is a ride model, it is adequate for understanding the effect of road distur-bances on the handling characteristics of the vehicle,
because it is a full three-dimensional model. It is possible to keep track of all four tire normal loads individually, and thus to analyze how their distribution varies as the
vehicle traverses a bumpy road. The extent to which the normal load distribution is affected by the disturbances, can be used to qualitatively compare various suspension designs, or control strategies. This approach presents
certain limitations however, when quantitative estimates are desired: a given change in normal load distribution could have no appreciable effect at low vehicle acceleration, yet result in a dramatic change in handling at higher accelera-tions, because the effect of normal load on the available tire forces becomes more pronounced closer to the tire limit of adhesion (ref. Fig. 1.5). Because of this and other
non-linear behavior, simple superposition does not apply.
2.3.2 Coordinate Transformation
It is desirable to obtain the equations of motion in a form that lends itself to simple physical interpretation. A crucial step in this direction involves the transformation of all the variables and parameters at the four corners into
pitch, and roll).
This can be accomplished via linear
com-binations of these "local" variables, as described in this
sub-section.
It should be noted that this transformation,
as well as the equation derivation which follows in the next
sub-section, are loosely based on those of Mercier [22],
although definitions may differ, partly because the vehicle
is not assumed symmetric, and for other reasons as well.
The transformation will be first
derived for the road
inputs.
The four corners of the vehicle are numbered from 1 to
4, starting at the left front corner and moving clockwise.
Referring to Figure 2.3, the problem could be stated as
follows:
Given the road vertical displacements ZRi, i
=
1 to 4,
under each wheel, taken positive downward, a transformation
matrix [TF] is needed, such that:
{QR} = [TF] {ZR};
where {QR} is the new road input vector consisting of road
heave HR, road pitch PR, road roll RR, and road warp WR;
HR
{QR}= PR
RR
WR
new variables are defined. This is facilitated by the introduction of the mid-point displacements ZR1 2, ZR3 4,
ZR1 4, and ZR2 3 shown in Figure 2.3, where ZRij is the
weighted average vertical displacement of the road plane at the points corresponding to the intersections of the x- and y-axes with the vehicle perimeter:
ZRy
+ZR2
ZR
=1
+2
(1)
12 2 ZR3 + ZR4 ZR3 4 2 ; (2) b - ZR1 + a-ZR4 IA I + b h (3)and
ZR
2 3 ( L )b
- ZR2 + a* ZR3 (a + b) I(4)
where a is the distance from the center of gravity of the
sprung mass, or from its projection onto the road plane, to
the front axle, and b is the distance from the same point to
the rear axle.
The heave of the road plane is now defined as the
vertical distance between the projection of the sprung mass
center-of-gravity onto the static or zero-input road plane,
or upon substituting for ZR1 2 and ZR3 4 from Eqns. (1) and
(2):
b - ZR1 + b - ZR2 + a - ZR3 + a * ZR4
HR = 2(a + b) . (6)
The pitch of the road plane is defined as the angle formed by the projections of the x-axis on the static, and on the displaced road planes:
-ZR2
+ZR
PR = 12+ 34 (7) (a + b) or -ZR - ZR2 + ZR3 + ZR4 2(a + b)Similarly, road roll is defined as the angle between projections of the y-axis onto a static and a displaced road planes:
ZR2
- ZR
RR = ZR23 -Z14 2 ,(9) tm
where tm is the half track of the vehicle, measured along the y-axis. From Fig. 2.3, it can be seen that:
b-
tf
+ a -tr
axle)
,
and tr is the rear half track.
Thus road roll becomes:RR =
-b - ZR + b - ZR2 + a - ZR3 - a - ZR4
2(b - tf + a - tr) (11) after substituting for tm, and for ZR1 4 and ZR2 3
-Finally, road plane warp is defined as the conjugate to road roll. It gives an indication of the torsional deflec-tion of the road plane:
-b ZR + b * ZR2 - a - ZR3 + a * ZR4 2(b - tf + a * tr)
(12)
Based on the b 2w -b 2q [TF] =above definitions, [TF] can be obtained:
b
a
a
2w 2 w 2wb
a
-a
2q
2q
2q
12w
-a 2q 12w
a
2q-l
-l
b 2w -b b 2 q '2qwhere w is the wheelbase:
w = a + b
Iq
=b
*tf
+ a & tr I(13)
and
(14) .0 (15)define tire and suspension compressions and unsprung mass displacements.
The tire compression terms ZTi, i = 1 to 4, corres-ponding to the four corners, can be combined into tire heave HT, tire pitch PT, tire roll RT, and tire warp WT:
HT ZT 1 PT= [TF] ZT2 (16)
RT
ZT
3 S(6 .WT ZT4Similarly for suspension compression terms ZSi:
HS
PS~
ZS1= [TF] * , (17)
RS ZS3
and for the unsprung mass displacements:
HU ZU1
PU = [TF] * ZU2 (18)
RU ZU
3
.W ; ZU4j
The advantage of using the transformed coordinates and variables will become apparent later on in the study. The transformations make the system more transparent as far as analyzing and understanding the coupling between the various modes, and its effect on the response of the system.