HAL Id: hal-00508527
https://hal.archives-ouvertes.fr/hal-00508527
Submitted on 4 Aug 2010
HAL is a multi-disciplinary open access
archive for the deposit and dissemination of
sci-entific research documents, whether they are
pub-lished or not. The documents may come from
teaching and research institutions in France or
L’archive ouverte pluridisciplinaire HAL, est
destinée au dépôt et à la diffusion de documents
scientifiques de niveau recherche, publiés ou non,
émanant des établissements d’enseignement et de
recherche français ou étrangers, des laboratoires
Wastewater treatment over sand columns : treatment
yields, localisation of the biomass and gaz renewal
J.A. Guilloteau, J. Lesavre, A. Lienard, P. Genty
To cite this version:
J.A. Guilloteau, J. Lesavre, A. Lienard, P. Genty. Wastewater treatment over sand columns :
treat-ment yields, localisation of the biomass and gaz renewal. 2nd international specialized conference on
design and operation of small wastewater treatment plants, Jun 1993, Trondheim, Norway. p. 153
-p. 160. �hal-00508527�
93/0096
WASTEWATER TREATMENT
OVER SAND COLUMNS
TREATMENT YIELDS, LOCALISATION OF THE BIOMASS
AND GAZ RENEWAL.
J.A. GUILLOTEAU*, J. LESAVRE**, A. LIENARD***, P. GENTY**
* SAUR. Laboratoire Central, 2 rue de la Bresle, 78312 Maurepas Cedex,
France
** Agence de l'Eau Seine-Normandie, CREATE, 5-7-9 Bd L. Seguin,
92700 Colombes, France
*•* CEMAGREF, 3 bis Quai Chauveau, 69336 LYON Cedex 09, France
ABSTRACT
Domestic wastewater treatment by infiltration-percolation is a process that becomming common in France. The aim of this study is to find the depth of biologically active substrate in an infiltration basin by determining the depth of the media colonised by the biomass and by studying oxygen renewal mechanisms. The study using sand columns has allowed simultaneous comparison, on the same profile, of biomass content (ATP), gaseous composition (chromatography) and the variations of the effluent quality (carbon, nitrogen, phosphorous). Down to a depth of 30 cm, removal rates achieved in terms of conventional treatment parameters are very high (COD and SS > 90%, N H4 + « 95%, Total Phosphorus « 50%).
Beyond a depth of 15 cm, the biomass content (expressed in ATP) is ten times lower than at the surface, and virtually ceases to develop.
Monitoring of C>2 levels points to the need for drying periods in order to ensure natural ventilation of the basins. The primary settling stage must be effective in order to avoid any risk of clogging which would prevent the air from being renewed by diffusion.The length of the drying period must be almost double that of the flooding period to allow the media to recover as much of its treatment capacity as possible.
This study pinpointed the depth of the biologically active substrate at arround 30 cm. The data obtained from this trial project point to the following design criteria : 1.5 m /p.e. spread over three basins, and a drying period twice as long as the flooding period. The sand depth will depend on the plant's overall water quality objectives : arround 0.50 m for the removal of carbonaceous pollution and nitrification of Kjeldhal nitrogen, a greater depth for desinfection purposes.
KEYWORDS
Wastewater treatment, Infiltration-percolation. Sand filtration, ATP, Oxygen.
INTRODUCTION
Domestic wastewater treatment by infiltration-percolation is a process that is becoming common in France. It consists in the sequenced filtration of wastewater having already undergone fairly intensive treatment, through generally sandy soil (in-situ or brough-in soil); the media is kept insaturated to allow aerobic biological removal to take place within the basin (AULENBACH, 1979 ; LELAND and DAMEWOOD, 1990). The infiltration surface area generally adopted, of around 1 m / p . e . makes this process highly competitive, notably as an alternative to ponds which requires 10 m /p.e. Reliable operation and simple maintenance are two more arguments in favour of the use of this technique for wastewater treatment in small communities. The quality levels outlined in the bibliography reveal 85 - 95% COD, SS and N H4 + removal
(DE VRIES, 1972; BOUWERetaJ, 1980).
AmnioniuíTi is transformed into nitrates, which are released at the beginning of the cycle (MATHEW et al, 1984). Phosphorous yields are highly variable and appear to depend on the electrochemical conditions of the sand (AULENBACH and MEISHENG, 198S).
The present study aims to find the precise location inside an infiltration basin of the biological mechanisms responsible for wastewater treatment. The first part of the study, conducted on site, demonstrated the potential of infiltration-percolation as a secondary treatment process (GUILLOTEAU et al, 1992). This second part of the study, conducted on a pilot plant, aims to determine the depth of the biologically active material. To this end, we monitored the following parameters at various depths : biomass (expressed in ATP), removal rates (COD, SS, NH4 +, NO3", TP) and the gaseous composition of the soil.
MATERIALSAND METHODS
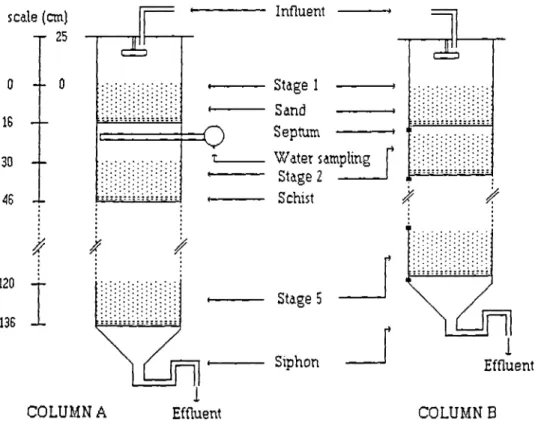
To establish these vertical profiles, two columns were build comprising five 15-cm layers of sand (from an infiltration-percolation plant). Space was provided between each layer to allow reading to be taken of the effluent and sand in Column A, and of gas in Column B. A control column was also built (Column C), consisting of a single 75-cm layer of sand on top of a 5-cm expanded schist layer to provide the same total material depth as in Column A and B. This control column only served as a comparison for the average retention time and overall removal efficiency of the sand medium (influent and effluent readings). The three columns each had a diameter of 30 cm. The sand was graded as follow : D ¡ Q = 0.2 mm, Dgg = 1 mm, U.C.= 5. The operating cycle adopted for all three columns consisted of two periods :
- a flooding period (3 days) during which 7 litres of clarified wastewater was fed every eight hours (corresponding to a 10-cm layer of water on the infiltration surface),
- a drying period (4 days).
scale
0
16
30
46
-(cm)
r 25
- 0
Influent
120
136
1
COLUMNA
Water sampling
Stage 2
Schist
1.il:
d ÜS
. 1 .il:
Stage 5
Siphon
COLUMN B
Two hours after the batch was released, the following samples were taken from Column A :
- 150 ml effluent from each layer to determine COD and SS contents, and nitrogenous and phosporous substances.
- 15 g of sand to determine the fixed biomass.
ATP is measured by bioluminescence using the internal standard technique.
On Column B, 5 ml of gas was removed each time a sample was taken from the different septa. Gases (O2. CO2 and CH4) were detected by Gas Chromatography on two columns assembled in series, one
porapak Q and a molecular screen.
RESULTS AND DISCUSSION
Determining the retention time
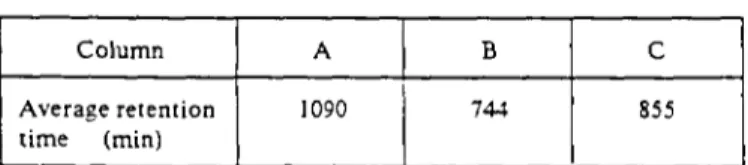
The average retention time of the effluent in the different columns was determined using the tracer substance, injected with the second batch. The behaviour of the first batch is un-representative because the sand has just undergone a 96-hour drying period with 10% water retention in Column A, 12% in Column B and 15% in Column C. The tracer substance used was sodium chloride (NaCl) in a concentration of 10 g/1. The NaCl concentration was determined by conductimetry using a pre-established correlation between conductivity and NaCl concentration. Readings were taken until the ninth batch of the cycle, at which time conductivity returned to that of drinking water, 0.5 mS/cm. The average retention times obtained are set out in Table 1.
Table 1 Average retention times on the three columns Column Average retention time (min) A 1090 B 744 C 855
Comparison of Columns A and C at an identical height shows that the the column split into layers has a higher retention time. This prolonged retention time could be due to the presence of gaps, which create capillary fringes where water build up.
Removal efficiency
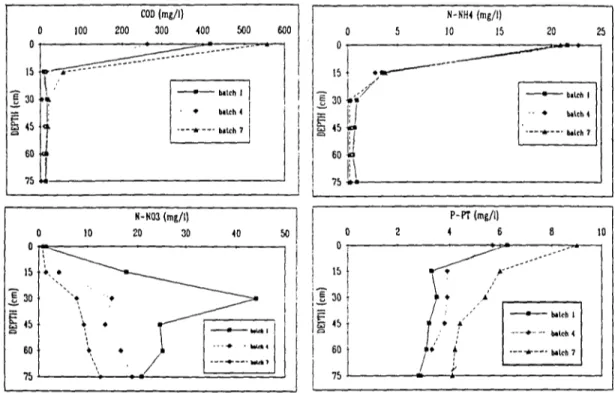
Figure 2 shows the changes in the four treatment parameters (COD, NH4 +, NO-j' et TP) according to the
depth and the lenght of the flooding period. The vertical profiles of COD, ammonium and phosphorous are similar, changing little with the number of batches. It may therefore be concluded that the pollution is decomposed in the surface zone (0 - 15 cm). A few more percentage points are gained in the 15-to-30 cm zone in particular with respect to the removal of NH4 +.
A release of nitrates was observed during the first batch of the cycle (because during the drying period, the NH4 + ions adsorbed during the last batch of the previous cycle nitrified). Then, over the course of cycles, the
NOj' content at the column outlet decreased without affecting NH4 + retention. This phenomenon is due to
localised processes of denitrification caused by the lack of oxygen due to the wastewater to be treated stagnating on the surface.
In conclusion, investigations show that the 0 - 30 cm zone, and in particular the very first centimetres, is the section in which the process is at its most effective.
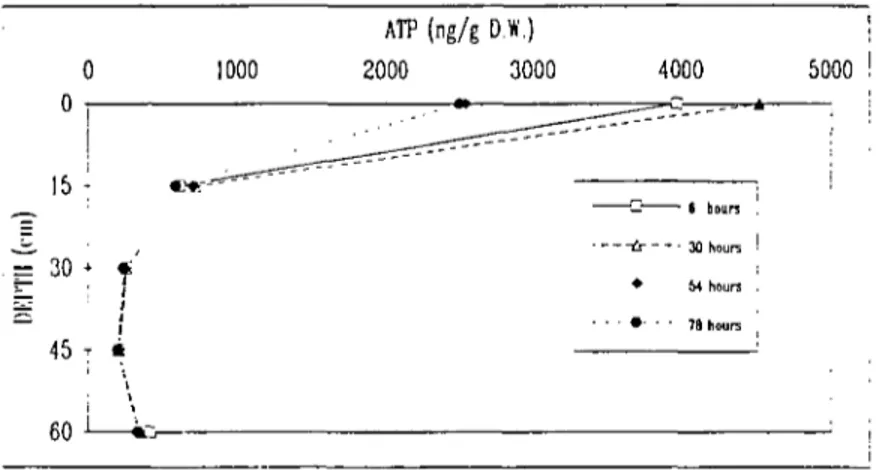
Biomass
Staying with Column A, at the same time as the calculation of treatment efficiency, a sample of sand was taken to measure the fixed biomass. The results obtained are given in Figures 3 and 4. The duration of the flooding period does not appear to have any influence on the biomass content. Results obtained for biomass content in the flooding and drying periods are given separately. Throughout the flooding period, there is no change in the biomass (expressed in ATP) through time; it remains stable.
After the end of the flooding period, the biomass content is maintained for the first two days, and diminishes over the course of the third and fourth, especially at the surface. The ATP content is ten times lower at a depth of 15 cm than on the surface, it stabilises berween 15 and 45 cm and rises again slightly at 60 cm. This could be due to the rise in water content, always greater at this depth.
15
î
30
¡45
60 75 1001 /
i
i
COD (mg/l) 200 300 400 5O0 - • bitch 1 • bilch 4 • * • — bitch 7 600 N-N03 (mg/l) 20 30 50e 30 iv
; 60I
o 0 T I 15 I 30 i 60 75 N-NH4 (mg/l) 10 15 20 25 • bilth I - • bilcM — •*•--• Uich 7 P-PT (mg/1) 4 6i
i!
/ : /
• f y i • bilch 1 - — - * — - blich 7Fig. 2. Removal of COD, NH4 +, NOj" et TP at different depths.
1000 ATP (ng/g D.W.) 2000 3000 4000 5000 " • — _ - - - - * * 15 • E 30 -45 r 60 -batch 1 ; batch 4 : I batch 7 ! \ t |
ATP (ng/g D.W.) 0 1000 2000 3000 4000 5000 0 T - • li» :
• i=
30* f
— = — fr — • 6 bours 30 hours M hoursFig. 4. ATP curves during drying period (cycle n°14).
Gaz renewal
The monitoring of the biomass, treatment yields and the gaseous composition of the sand media all have the same purpose - to define the biologically active zone in an infiltration basin. The treatment process sought in infiltration-percolation is the aerobic decomposition of the pollution. The operation and management of the basins are dependent on the content of oxygen, its renewal capacity and position within the basin. It follows that oxygen must be provided at the right time and in the right place.
CC>2 content is a good indicator of the presence of purifying fiora because it is the end product of the aerobic decomposition of the polluted water.
CH4, not present in the atmosphere, serves exclusively to detect zones in which anaerobic conditions could
develop due to clogging at the surface.
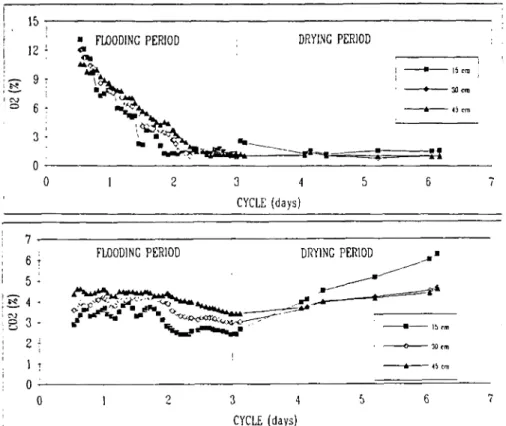
The results presented in Figures 5 et 6 correspond to two different cases. Figures 5 shows the oxygen and carbon dioxyde curves during a cycle in which clogging occurate due to an excess of suspended solids permanently covering the infiltration surface from the sixth batch of the cycle onwards. Figure 6 shows the curves for the same parameters representative of the normal operating conditions in an infiltration-percolation basin.
The following observations can be made from analysis of the oxygen and carbon dioxyde curves during the flooding and drying periods of the cycle.
Flooding period. If clogging occurs during a cycle (Figure 5) oxygen is consumed very rapidly and by batch n°6 its content falls to about 1%. Oxygen renewal by convection or diffusion can no longer take place in the interval between two batches (8 hours) because the infiltration surface remains submerged. This continous submersion leads to the formation of methane (0.3 to 1%) indicating the existence of anoxic zones in the column (notably in the first 15 centimetres).
The overall carbon dioxyde content remains stable during the flooding period. These different phenomena lead to a deterioration in the treatment efficiency readings taken at the column outlet. Batch n°9 (day 3) produced relatively poor results : less than 80% COD and SS removal, less than 15% retention of ammonium ions, total absence of nitrification and low phosphorous adsorption. All these elements indicate that aerobic conditons are no longer present in the media.
If no clogging occurs in the cycle (Figure 6), oxygen consumption remains high and the oxygen content decreases rapidly. The residual content in the upper level (15 cm) at the end of the flooding period is around 3%. There is a reduction in CO2 content during the first few minutes of the flooding period.
15 12
-i g 9?
6 3 -o «li MFLOODING PERIOD DRYING PERIOD
- 15 cm - 30 cm 2 3 4 CYCLE (days) 7 6 5 8 3 2 1
FLOODING PERIOD DRYING PERIOD
Fig Ü -0 . 5 . 20
°2
1 and CO-, 2 3 4 5 CYCLE (days)curves for cycle during which clogging occurred (SS
6 7
ss 600 mg/1)
FLOODING PERIOD DRYING PERIOD
* * -3 4 CYCLE (days) 1
1
1 n '• 0 l1 2 I 3 CYCLE 4 (days) 5 6 i 7 :This is due to a phenomenon of convection whereby air is transferee! from the upper to the lower levels. From the second batch onwards, the CO-, rate rose again and remained fairly stable for the whole of the flooding period. Unlike the cycle during which clogging occurred, no methane was detected because the infiltration surface was not completely submerged for the height hours separating one batch from the next. Consequently, treatment yields remained excellent throughout the flooding period.
Drying period. In cycles where clogging occurs (Figure 5). the end of the flooding period does allow a small amount of oxygen to enter the media as the surface clears. But this input is minimal (< 2%) and does not allow the sand to recover the treatment capacity required to decompose the pollution in the next cycle. The drying period does not play its role, and the surface has to be scraped in order to remove the clogging layer and let air enter the media. The carbon dioxyde concentration rises significantly in the first fifteen centimetres and only slightly in the 30 to 45 cm zone. This indicates that bacterial activity is still fairly high within the sand media, and may be explained by the fact that a small amount of water is retained on the clogged surface and slowly percolates into the media.
During the drying period of the cycle where there was no clogging (Figure 6), the carbon dioxyde content increased initially as the last batch percolated through the media. Decomposition continued in the lower levels of the media, while in the upper level (15 cm), CC>2 content fell from 8% to 3% during the four-day drying period. This can be linked to the fact that the C>2 content greatly increase (7% to 17%) in the upper level. It may also be noted that the increase is faster at the beginning of the drying period when the oxygen content differential is at its highest, than at the end of the drying period when the difference is lower. A slight increase in oxygen content may be observed at a depth of 30 cm.
These observations concerning gas renewal confirm the results obtained from tests on the localisation of the biomass and treatment efficiency in a infiltration-percolation column. Oxygen renewal and consumption take place in the initial 15 centimetres of the sand media. The gaseous composition of the 15 • 30 cm level fluctuates, but only slightly, and beyond 30 cm the atmosphere remains stable, with low oxygen contents. This is consistent with the low biomass content found at this different levels. Without oxygen, and in waste water with low organic loading, the aerobic flora is unable to develop.
The main finding of this monitoring campaign was the importance of the drying period. Oxygen renewal took place almost exclusively by means of diffusion, since there is little movement of the water mass in the column during the 96-hour drying period. Under these experimental conditions (3 days' flooding, 4 days' drying) oxygen content stabilised at approximately 18% at the beginning of each cycle. It would be interesting to extend the drying period to see how long it would take for the oxygen content to reach its atmospheric level of 21%. By extrapolation of the data given in Figure 6, it would take 6.5 days for the oxygen content to reach 21%. That is why we are proposing an infiltration-percolation process designed with three basins instead of two, so that the drying period is twice as long as the flooding period.
CONCLUSION
The essential aim of this work was to determine the biologically active height of a sand filter. Earlier tests conducted on a 500 p.e. sewage plant (GUILLOTEAU eia\. 1992) showed that the active zone was situated at between 0 and 40 cm. Due to the destructive nature of the samples and lack of flexibility of the facilities, the tests on site had to be interrupted and two specific columns were built allowing monitoring of treatment yields, biomass localisation and gas renewal at different depths. The results obtained for the three elements of an infiltration basin - water, air, sand - point to the same conclusion :
The monitoring of treatment efficiency at different depths showed that the 0 to 30 cm zone was clearly the most biological active. After 15 cm of percolation, the yields obtained on carbonaceous pollution was 80%, 75%onNH4 + and 45% on total phosphorous. At a depth of 30 cm, 90% of COD has been removed,
96% of N H4 + and 50% of TP, in other words practically the same yields as after 75 cm of filtration.
The localisation of the biomass showed that the biomass content falls by a factor of 10 between the first and fifteenth centimetres and remains stable from 30 down to 75 cm.
Analysis of changes in oxygen content, the vital parameter for aerobic treatment, shows that oxygen is consumed rapidly during the flooding period, while COj content remains stable. The 8-hour intervals between batches do not allow air renewal in the column. The drying period should fulfil this function. In the event of clogging, the crust deposited on the surface prevents outside air from entering the media, oxygen renewal does not take place, anoxic conditions develop and treatment yields deteriorate. However, when primary settling is effective, oxygen renewal does take place during the drying period, but in the upper level (0 - 15 cm) and only to a very slight degree in the 15 - 30 cm zone. It may be noted with this cycle (3 days' flooding and 4 days' drying), that the oxygen content does not return to its atmospheric level of 21% and there is always a residual CC>2 level of about 3% at the end of the drying period.
These different results clearly show that the biologically active zone of a sand filter is in the initial 30 centimetres. As far as the management of this type of process is concerned, we suggest that the infiltration of effluent should be performed using three basins, rather than two as is often the case. This provides a drying period twice as long as the flooding period as well as increased security in the event of one of the basins becoming clogged. These considerations result in design criteria of 1.5 m v p . e . spread over three basins.
REFERENCES
AULENBACH, D.B. (1979). Long term recharge of trickling filter effluent into sand.
U.S.E.P.A. 600/2-79-068.
AULENBACH, D.B. and MEISHENG, N. (1988). Studies on the mechanism of phosphorus removal from treated wastewater by sand. J.W. P.C. F., 60. 12, 2089-2094.
BOUWER, H., RICE, R.C., LANCE, J.C. and GILBERT, R.G. (1980). Rapid infiltration research at Flushing Meadows project, Arizona. J. W.P.C.F.. 52, 10, 2457-2469.
De VRIES, J. (1972). Soil filtration of wastewater effluent and the mechanism of pore clogging.
J. W.P.C.F.. 44.4,565-573.
GUILLOTEAU, J.A., LIENARD, A., VACHON, A. and LESAVRE, J. (1992). Wastewater treatment by infiltration basins. Case study : Saint Symphorien de Lay (France). Proceeding of the First Middle East Conference on Water Supply and Sanitation for Rural Areas, February 1992, Cairo, Egypt.
MATHEW, K., HO, G.E. and NEWMAN, P.W.G. (1984). Removal of nitrogen from wastewater by soil percolation with alternate flooding and drying. Asian Environment, 6, 4, 9-16.
LELAND, D.E. and DAMEWOOD, M. (1990). Slow sand filtration in small systems in Oregon.