First International Conference on Bio-based Building Materials
June 22nd - 24th 2015
Clermont-Ferrand, France
MEASUREMENT OF THE HYGROTHERMAL PROPERTIES OF STRAW-CLAY
MIXTURES
N. Oudhof1,2, M.Labat1, C.Magniont1*, P. Nicot1
1 Université de Toulouse;UPS, INSA;LMDC (Laboratoire Matériaux et Durabilité des
Constructions);135, avenue de Rangueil;F-31077 Toulouse Cedex 04, France
2 Ecoterre Scop 22, rue des Boisseliers 30610 Sauve - France
*Corresponding author; camille.magniont@insa-toulouse.fr
Abstract
Straw-clay mixtures are composed of unprocessed earth mixed with water and straw. The strongest advantage of such a material relies on its low environmental footprint. However, its impact on the building energy consumption an indoor comfort still has to be determined, mainly because of the lack of experimental data. This results in a poor integration in current regulation codes and in numerical studies. This work aims to assess the basic hygrothermal properties of clay-stray samples, provided by two French companies (Ecoterre and Inventerre). Results showed that the hygroscopic properties of clay-straw equals or overtops other self-insulating materials, both conventional (autoclaved aerated concrete) and biobased (hemp concrete). Keywords:
Straw-clay mixture, bio-based material, hygrothermal properties, measurement
1 INTRODUCTION
In the field of building construction and retrofitting, the development of innovative materials have to meet environmental and social concerns. On an energy point of view first, the whole building energy consumption has to be minimized, which stresses the need for thermal efficient materials. Second, a low environmental footprint is required. Finally, achieving comfortable and healthy indoor conditions without using energy consuming systems (such as HVACs) is an on-going topic.
Straw-clay mixtures are composed of unprocessed earth mixed with water and straw, and could be used to meet these three objectives. Indeed, both clay and straw are abundant local resources with very low embodied energy. Straw is also a renewable raw material (by-product of agricultural activities) that contributes to carbon storage. According to the people living in buildings where clay-straw was used as infill insulating material, comfortable indoor environment was achieved with no significant increase of the energy consumption. However, very few studies could be found in the scientific literature to assess this statement [Goodhew 2005]. This is the direct consequence of the lack of data for such mixtures, which results in a poor integration in current thermal regulations and numerical studies.
This work aims to assess the basic hygrothermal properties of straw-clay samples, provided by two French companies (Ecoterre and Inventerre).Thermal conductivity, vapor sorption isotherms, water vapor
permeability, and MBV (Moisture Buffer Value) measurements were achieved in our laboratory. 2 MATERIALS AND SAMPLING
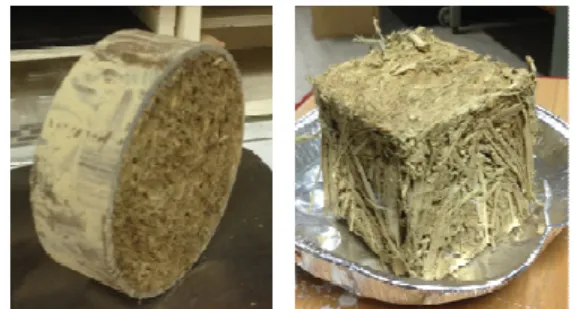
The material was obtained by filling a mold with a wet straw-clay mixture, and then packed by hand. Even if this production method is very convenient, the samples revealed apparent heterogeneities (Fig. ).
Fig. 1: Straw clay samples with different geometries. A density measurements campaign was realized on 25 large samples (7*7*7cm3), taken at middle height in the
mold in order to obtain a representative volume and to avoid edge effects.
The results revealed an average density of 399kg/m3
with a relative dispersion around 7% between the specimens. This low scattering in the results shows the good reproducibility of fabrication and gives confidence in the sampling processes.
3 METHODS
3.1 Thermal conductivity
Tests were performed using the guarded hot plate method with a λ-Meter EP 500. Measurements were achieved at 25°C with a difference of temperature of 10K between the two plates. Steady state was assumed to be reached when the change in conductivity was less than 1% in 60 minutes.
Plane-parallel samples with 15*15cm² sections and 7cm thick were tested. The compaction and test directions were chosen in order to reproduce the orientation of straw fibres in a real wall (Fig. ).
Fig. 2: Schematic representation of fabrication and sampling processes for conductivity measurement. Specimens were dried prior to testing in oven at 50°C until the change in mass of the sample was less than 0.1% between two weightings 24 hours apart.
The results presented here are mean values of measurements taken on at least 3 different samples. 3.2 Water vapor sorption
General considerations
The moisture content was calculated by using (1):
0 0 m m m u i i − = (1)
where ui stands for the moisture content (%), m0 is the
mass in the dry state (g) and mi is the mass in the
humid state (g).
Each mass was determined by averaging 3 successive measurements on a ±0.01g accurate weighing scale.
Measurements were achieved on 25 large samples (7*7*7 cm3), taken at middle height in the mold.
Estimating the mass for the dry samples
It can be seen in equation (1) that the measurement accuracy is highly depending on the estimation of the mass in the dry state. In the current French regulation code [ISO 12570], the definition of the dry state is not very clear: it is stated that the dry state is obtained if the mass variation of the sample remains lower than 0.1% over 24h, when the relative humidity (ψ) is lower than 10%. However, a significant mass variation is expected when ψ increases from 0 to 10%.
Here, samples were placed in an oven maintained at 55°C, and the relative humidity was monitored by a KISTOCK KH 110 sensor. All the samples were weighed for 3 different values of the relative humidity (5, 7 and 9%). A linear relationship was fitted for each sample: this allowed estimating the mass in the dry state (namely, when the relative humidity is equal to 0). The obtained values were ranging from 134.96g to 184.26g, and the average value was 160g.
Measurements
Sorption and desorption measurements were achieved according to the French standard NF EN ISO 12571 [ISO 12571]. Both a climatic chamber and salt solutions were used to maintain a constant level of relative humidity for 6 different values (9%, 22%, 50%, 66%, 81% and 93%). The temperature was maintained at 23°C during all the experiment.
All the samples were used to measure the sorption value at 9%. A very low deviation was obtained (0.02%), which gave confidence in the production method and in the sampling. In order to reduce the duration of the measurement, the samples were separated in small groups, containing from 3 to 12 samples (see Tab. 1). This allowed achieving all the measurement in 3 months. Desorption measurements were achieved with the 12 samples only, the one that were exposed at the highest relative humidity (ψ=93%). Each sample was periodically weighed until the difference between two consecutive measurements, 24h apart, was less than about 0.1%. The final value corresponds to the average moisture content of all the samples. The standard deviation increased with relative humidity to reach as much as 1.26% for ψ=93%.
3.3 Water vapor permeability
The vapor diffusion measurement was carried out according to the French standard NF EN ISO 12572 [ISO 12572].
Both dry (9%) and wet (93%) cups had been realized by sealing cylindrical straw-clay samples with a mix of paraffin (40%) and beeswax (60%) on PVC cups containing saturated salt solutions. Three samples were tested for each condition.
Tab. 1: Distribution of the samples for sorption and desorption measurements.
ψ 9% 22% 50% 66% 81% 93% Sorption CC 25 samples SS 4 samples CC 8 samples SS 4 samples SS 4 samples SS 12 samples Desorption SS 3 samples SS 3 samples X CC 3 samples SS 3 samples X
The whole systems were placed in a climatic chamber kept at 23°C and 50%RH. The samples mass was monitored through diary weightings. The moisture flux through the specimen gv (kg/m2.s) was then
determined.
Three parameters can be calculated (see (2)): the water vapor permeability (π), the water vapor resistance factor (µ) and the water vapor diffusion equivalent air layer thickness (Sd).
d v a v a v v
S
p
d
p
d
p
g
=
∆
=
∆
=
.
∆
.
.
.
π
µ
π
π
(2) where ∆pv (Pa) is the difference in vapor pressure atthe opposite sides of the sample, πa is the water vapor
permeability of stagnant air and d(m) is the thickness of the sample.
3.4 Moisture buffer value
The practical Moisture Buffer Value (MBV) is an experimental indicator that characterizes the moisture buffer capacity of a material, i.e. its ability to moderate variations of indoor relative humidity. MBV measurements were realized in accordance with the NORDTEST method [DTU 2005]. The MBV indicates the amount of water that is transported in or out of a material per open surface area, during a certain period of time, when it is subjected to variations in relative humidity of the surrounding air. The periodical exposure applied was 8 h at 75%RH and 16 h at 33%RH. The unit for MBV is kg/(m2.%RH).
The mass measurements were achieved on 3 samples (10*10*20cm3) directly casted in a mold with required
sizes. They were sealed on 5 out of 6 sides with aluminum tape, the exposed area of each sample was 0,01m2.
Cyclic variations of RH were obtained with a programmable climatic chamber. Weightings were performed on a ±0.1g accurate balance, 5 days a week but cycles were continuously applied.
4 RESULTS AND ANALYSIS 4.1 Thermal conductivity
Five different mixtures of straw-clay had been provided by the companies (Ecoterre and Inventerre). The straw to clay ratio was modified in order to obtain a dry material with variable density (ρ). The mean values of thermal conductivity (λ) obtained for each formulation are reported in Tab. 2.
Tab. 2: Thermal conductivity of the 5 straw-clay mixtures (average values (standard deviation)).
Mixtures 1 2 3 4 5 ρ (kg/m3) 241 (42) 381 (6) 403 (14) 449 (18) (30) 531 λ (W/m.K) (0.004) 0.071 (0.002) 0.088 (0.007) 0.099 (0.002) 0.104 (0.005) 0.120 As expected, thermal conductivity increases with density. For ρ ranging from 241 to 531kg/m3, λ lies between 0,071W/m.K and 0,120W/m.K. We can note the quite low dispersion of the final dry densities in each group (<5% excepted for the lightest mixture). This reveals a good knowledge of the fabrication process by the actors and their ability to produce in the field a material with repeatable density.
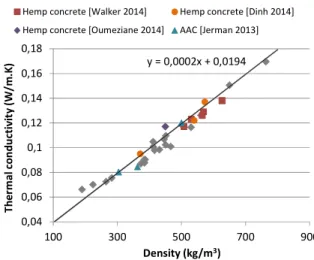
All the values of λ measured during this campaign were plotted on Fig. together with values of biobased and conventional building materials conductivity found in the literature. y = 0,0002x + 0,0194 0,04 0,06 0,08 0,1 0,12 0,14 0,16 0,18 100 300 500 700 900 T h e rm a l c o n d u ct iv it y ( W /m .K ) Density (kg/m3)
Hemp concrete [Walker 2014] Hemp concrete [Dinh 2014]
Hemp concrete [Oumeziane 2014] AAC [Jerman 2013]
Fig.3: Thermal conductivity of straw-clay (grey diamonds) and other building materials versus dry
density.
As shown on Fig., the dry thermal conductivities of straw-clay mixtures are comparable with those of hemp concretes or aerated autoclaved concrete (AAC) with equivalent density.
These experimental results are in good accordance with the empirical relationship (see (3)) established on hemp concretes in [Cerezo 2005] and plotted on Fig. 4.
0194
.
0
0002
.
0
×
+
=
ρ
λ
(3)Straw-clay mixtures with density below 450 kg/m3
could be favorably applied in new buildings in compliance with the current French thermal regulations (RT2012). With a common wall thickness of 30cm, the thermal resistance would exceed 3m2.K/W.
4.2 Sorption Measurements
In order to make the comparison easier with other materials, several regression curves were tested. In [Del Coz Diaz 2013], 3 theoretical models were used to represent the sorption isotherms for construction materials, but only the Kumaran model (see (4)) and the Burch model (see (5)) gave satisfying results.
c b a w + + =
ψ
ψ
ψ
2 (4) b a w − − ⋅ = 1 1 1ψ
(5) Where w is the volumetric water content (kg.m-3), a, b, c are the fitting coefficients.Another model known as the GAB model (see (6)) is widely used nowadays ([Collet 13]) and is based on the moisture content.
(
) (
)
m G G i w k C k k k C u ⋅ ⋅ ⋅ + ⋅ − ⋅ ⋅ − ⋅ ⋅ =ψ
ψ
ψ
ψ
1 1 (6) where CG, k and wm are the fitting coefficients.The fitting coefficients were obtained by inverse method (Generalised Reduced Gradient method). Results were compared by computing the Pearson’s correlation coefficient (see (7)).
(
) (
)
(
) (
)
∑ − ⋅∑ − ∑ − ⋅ − = i i i i i i i xy y y x x y y x x r 2 2 (7)The computed coefficients were higher than, 0.975 in all the cases, meaning that the models are suited well the measurements. This can be seen in Fig. 4. However, as the two first models (Kumaran and Burch) are based on the volumetric water content, the volume of the samples has to be determined. Therefore, the measurement uncertainty is higher for the volumetric water content than for the moisture content. Consequently, the GAB model was preferred. The fitted coefficient are CG=2.9772 101, k=9.7077 10-1,
and wm = 1.1897 10-2.
Finally, a very low hysteresis was observed between sorption and desorption measurements. This resulted in similar fitted coefficients. For the sake of clarity, only the results for sorption are presented here.
The sorption isotherm was compared to 6 other results obtained with earth bricks [Cagnon 2014], autoclaved aerated concrete (AAC) [Jerman 2013] and with hemp concrete [Collet 2013]. Results are presented in Fig. 5. It can be observed from Fig. 5 that the straw-clay mixture has a similar behavior than hemp concrete [Collet 2013]. It can be observed that the GAB model was used in both cases. Second, the moisture content at high relative humidity (ψ=93%) is approximately 12% for both materials.
Fig. 4: Comparison of the 3 regression curves for sorption at 23°C
Fig. 5: Comparison with measured sorption values for hemp concrete, AAC and earth bricks. Stronger differences were observed with earth bricks and AACs. Indeed, the moisture content is twice lower for both materials at 93%. However, it should be mentioned that the density of earth brick is four time higher: consequently, the volumetric water content (unit: kg.m-3) is twice higher with earth brick for the
same volume. This is not the case for AAC which bulk density is of the same order of magnitude. Second, earth bricks and AAC are used to achieve the structural frame of the building whereas straw-clay should be used for filling. Therefore, the impact on moisture transfer at the wall scale should be different. 4.3 Water vapor permeability
Results of water vapor permeability obtained with wet and dry cups methods are presented in Tab. 3.
Tab. 3: Water vapor diffusion characteristics of straw-clay (average value (standard deviation)). Method ρ (kg/m3) π x 10-11 (kg/s.m.Pa) µ Sd 30 cm wall (m) Wet cup 355.4 (4.7) (0.98) 6.81 (0.43) 2.92 (0.13) 0.88 Dry cup 341.8 (4.8) 4.15 (0.52) 4.77 (0.58) (0.17) 1.43 The measurements show that straw clay is highly permeable to water vapor transfer. The spread of the experimental results looks acceptable in comparison with results presented in the literature for gypsum boards, which is a very common building material: [Roels 2010]. The water vapor resistance factors of straw clay are compared against results obtained with biobased and conventional self-insulating materials on Fig. 66 and 7, for wet and dry methods respectively.
0 2 4 6 8 10 12 14 16 18 250 350 450 550 650 µ w e t Density (kg/m3)
AAC [CSTB 2012] Wood concrete [CSTB 2012] AAC [Jerman 2013] Hemp concrete [Chamoin 2013]
Fig. 6: Water vapor resistance factors of straw-clay (grey diamond) and other building materials measured
with wet cup method versus dry density.
0 2 4 6 8 10 12 14 16 18 250 350 450 550 650 µ d ry Density (kg/m3)
AAC [CSTB 2012] Wood concrete [CSTB 2012] AAC [Jerman 2013] Hemp concrete [Chamoin 2013] Hemp concrete [Walker 2014] Hemp concrete [Evrard 2006]
Fig.7: Water vapor resistance factors of straw-clay (grey diamond) and other building materials measured
with dry cup method versus dry density. The water vapor resistance factors determined with wet cup are systematically higher than with dry cup.
This can be explained by the additional liquid transfer due to capillary forces occurring for high moisture content. Straw clay water vapor permeability equals or overtops the one of the other building materials in both wet and dry cups. This performance constitutes a good indicator for the use of straw clay as water vapor diffusion-open insulation systems for rehabilitation of old buildings [Scheffler 2011].
4.4 Moisture buffer capacity
After one month long exposure to 75%-33%RH cycles, the stabilization criteria described in the NORDTEST protocol were not reached. This could be explained by the following two points:
• Dimensional variations might have been induced by moisture cycles, leading to changes in the exposed area to moisture transfer during the test. • Because of the important mass of the samples
(more than 1000g) the use of a ±0.1g accurate scale was required. An uncertainty calculation showed, it was not possible to obtain an accuracy lower than 5% in this case.
Additional measurements will be realized. First point will be solved by using a rigid mold insensitive to moisture changes that will suppress the dimensional variations of straw-clay. In order to improve the accuracy of the measurement, the mass of the sample will be reduced. The moisture penetration depth could be determined as presented in [DTU 2005] by using the hygric properties previously determined. In the case of straw-clay materials, the penetration depth is lower than 8 cm. Consequently, the thickness of the sample could be favorably reduced from 20 to 10 cm. Even if stabilization criteria established in the NORDTEST protocol were not obtained, the samples were submitted to 30 successive cycles. This largely
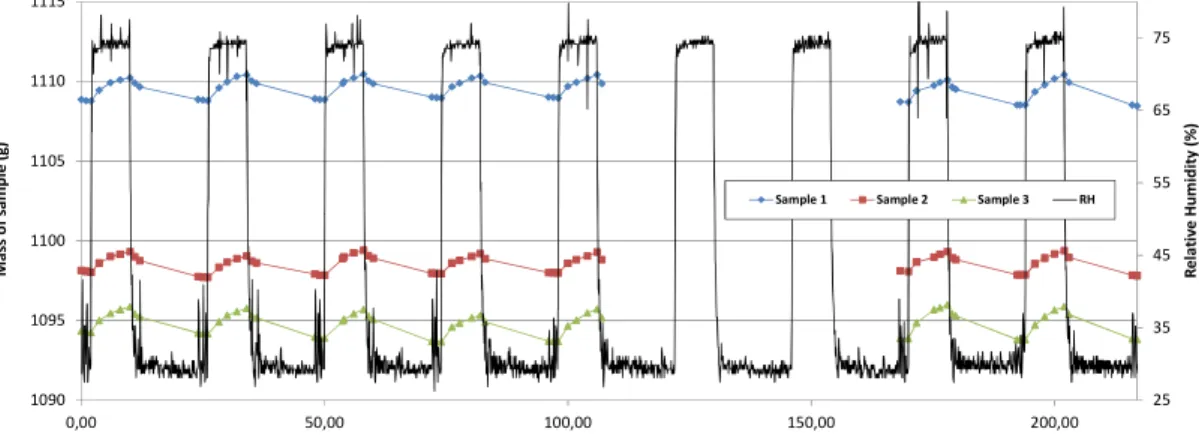
overtops the number of cycles observed in the literature to reach the stabilization ([Collet 2012], [Collet 2013]). Fig. 9 represents the mass variation of the samples during the last 9 cycles. The minimum MBV value measured during this period was 2.86 g/m2.%HR, which is sizeable compared to results from the literature, as plotted in Fig. 8. Still, this value should be carefully analyzed as the stabilization criteria were not reached.
0 0,5 1 1,5 2 2,5 3 Sprayed hemp concrete Precast hemp concrete Hemp concrete with coating
AAC Gypsum Straw clay
M B V ( g /m 2.% H R ) [Collet 2012] [Collet 2013] [DTU 2005]
Fig. 8: Comparison of MBV of biobased and conventional building materials and straw-clay. The comparison with conventional materials as AAC or gypsum reveals a two and a half times higher buffer value for straw-clay. Considering the classes determined during the NORDTEST project (see Fig. 1010), straw-clay presents an excellent moisture buffering ability. 25 35 45 55 65 75 1090 1095 1100 1105 1110 1115 0,00 50,00 100,00 150,00 200,00 R e la ti v e H u m id it y ( % ) M a ss o f sa m p le ( g ) Time (hours)
Sample 1 Sample 2 Sample 3 RH
Fig. 9: Evolution of samples mass and relative humidity during moisture cycles.
Fig. 10: Graphic presentation about practical Moisture Buffer Value classes [DTU 2005]
These first results on moisture buffer value of straw clay are encouraging and need to be completed and detailed. The combination of plant aggregates together with an earthen matrix allows reaching performances even better than those obtained with hemp concrete (Fig. 8). This could be attributed to the very good hygric characteristics of this binder that largely overtops usual mineral binders [Cagnon 2014]. The dynamic hygric behavior of straw-clay is expected to improve the hygrothermal comfort into the buildings and to make significant energy savings for HVAC systems ([Liuzzi 2013]; [Osanyintola 2006]; [Rode 2007]). But, as shown by Collet [Collet 2012] the addition of a coating material with different hygric properties might significantly reduce this positive effect (Fig. 88).
5 CONCLUSIONS AND OUTLOOK
This paper presents the hygrothermal characterization of straw-clay material, namely: the thermal conductivity, the water vapor sorption isotherms, the water vapor permeability and an estimation of the moisture buffer value. To be complete, the thermal capacity or of the effusivity should also be measured. Second, the results were set against others coming from the literature, mainly with hemp concrete and aerated concrete which are other self-insulating materials used in construction. The performances of straw-clay are at least equivalent to those of these two materials. Its low thermal conductivity, high water vapor sorption capacity and high water vapor permeability make it suitable for both new construction and renovation purposes.
In addition, an experimental campaign at wall scale should be achieved by considering a constructive technique which associates straw-clay with a timber frame. It would bring interesting results about the homogeneity and the reproducibility of this building technique taking into account: i/ the edge effects at the interface between wood frame or form work and straw-clay, ii/ the heterogeneous compaction forces applied in the different parts of the wall.
Besides, the results from this experimental campaign are suitable with modelling purposes. For example, coupled heat and mass transfer in a wall made of straw-clay mixtures could be estimated by using a HAM model (e.g. WUFI, Energy Plus, TRNSYS, HAM-Tools, …). As several many well-documented numerical studies were already published, one or more could be used to extend the comparison between straw-clay material and others. This should be done in a very near future, by applying the methodology presented in [Roels 2006].
6 ACKNOWLEDGMENTS
The authors would like to thank Ecoterre and Inventerre for their support in this project.
7 REFERENCES
Cagnon, H., Aubert, J.E., Coutand, M., Magniont, C.; Hygrothermal properties of earth bricks. Energy and Buildings, 2014, 80, 208–217.
Cérézo V., Propriétés mécaniques, thermiques et acoustiques d’un matériau à base de particules végétales : approche expérimentale et modélisation théorique. PhD Thesis, ENTPE, Vaux en Velin, France, June 2005.
Chamoin J., Optimisation des propriétés (physiques, hydriques et mécaniques) de bétons de chanvre par la maîtrise de la formulation. PhD Thesis, INSA Rennes, France, July 2013.
Collet F., Pretot S., Effect of Coating on Moisture Buffering of Hemp Concrete. The Second International Conference on Building Energy and Environment, Aug 2012, Boulder, USA. pp.878-885. Collet, F., Chamoin, J., Pretot, S., Lanos, C.; Comparison of the hygric behaviour of three hemp concretes. Energy and Buildings, 2014, 62, 294–303. Règles Th-U Fascicule 2 : Matériaux, CSTB March 2012.
Del Coz Díaz, JJ, Álvarez Rabanal, FP, García Nieto, P.J., Domínguez Hernández, J., Rodríguez Soria, B.; Hygrothermal properties of lightweight concrete: Experiments and numerical fitting study. Construction and Building Materials, 2013, 40, 543–555.
Dinh The M., Contribution to the development of precast hempcrete using innovative pozzolanic binder, PhD Thesis, Toulouse, France, May 2014. Moisture Buffering of Building Materials. Report BYG·DTU R-126. Department of Civil Engineering – Technical University of Denmark, 2005.
Evrard A., Sorption behavior of Lime-Hemp Concrete and its relation to indoor comfort and energy, PLEA2006 - 23rd Conference on Passive and Low
Energy Architecture, Genève, Suisse, 6-8 Sept 2006. Goodhew S., Griffiths R.; Sustainable earth walls to meet the building regulations. Energy Build., May 2005, vol. 37, no 5, p. 451‑459.
NF EN ISO 12570, Hygrothermal performance of building materials and products - Determination of moisture content by drying at elevated temperature, Oct 2000.
NF EN ISO 12571, Hygrothermal performance of building materials and products - Determination of hygroscopic sorption properties, Oct 2000.
NF EN ISO 12572, Hygrothermal performance of building materials and products - Determination of water vapour transmission properties, Oct 2001. Jerman M., Keppert M., Vyborny J., Cerny R.; Hygric, thermal and durability properties of autoclaved aerated concrete, Construction and Building Materials, 2013, 41, 352–359.
Liuzzi S., Hall M.R., Stefanizzi P., Casey S.P., Hygrothermal behaviour and relative humidity buffering of unfired and hydrated lime-stabilised clay composites in a Mediterranean climate. Buildind and Environnement, 2013, 61, 82-92.
Osanyintola O.F., Simonson C.J., Moisture buffering capacity of hygroscopic building materials: Experimental facilities and energy impact. Energy and Buildings, 2006, 38, 1270-1282.
Evaluation des performances hygrothermiques d’une paroi par simulation numérique: application aux parois en béton de chanvre, PhD Thesis, INSA Rennes, France, March 2013.
Roels S., Janssen H. A; Comparison of the Nordtest and Japanese Test Methods for the Moisture Buffering Performance of Building Materials. Journal of Building Physics, 2006, 30,137-161.
Rode C., Grau K., The importance of moisture buffering for indoor climate and energy conditions of buildings, Proceedings of the 12th Symposium for Building Physics, Dresden, Germany, 2007.
Roels S., Talukdar P., James C., Simonson C.; Reliability of material data measurements for hygroscopic buffering. International Journal of Heat and Mass Transfer, 2010, 53, 5355–5363.
Scheffler G. A.; Hygric performance of internal insulation with light-weight autoclaved aerated concrete. 5th International Conference on Autoclaved
Aerated Concrete. Bydgoszcz, Poland, Sept 2011. Walker P., Pavia S.; Moisture transfer and thermal properties of hemp-lime concretes. Construction and Building Materials, 2014, 64, 270–276.