Double Layer Capacitors:
Automotive
Applications and Modeling
by
David Allen New
B.S.E.E., University of Arkansas (2002)
B.S., University of Arkansas (2002)
Submitted to the Department of Electrical Engineering and Computer Science
in partial fulfillment of the requirements for the degree of
Master of Science
at the
MASSACHUSETTS INSTITUTE OF TECHNOLOGY
February 2004
©
Massachusetts Institute of Technology, MMIV. All rights reserved.
/
11/Author_
Aepartment of Electrical Engineering and Computer Science
December 8, 2003
Certified by_
Dr. John G. Kassakian
Professor and Director Laboratory for Electromag. and Elec. Sys.
~T§hesis
Sup yisorAccepted by.
Arthur C. Smith
Chairman, Department Committee on Graduate Students
MASSACHUSETTS INS E OF TECHNOLOGY
Apo i
SBARKER
BAPR
1
52004
/
LDouble Layer Capacitors: Automotive Applications and Modeling
byDavid Allen New
Submitted to the Department of Electrical Engineering and Computer Science on December 8, 2003, in partial fulfillment of the
requirements for the degree of Master of Science
Abstract
This thesis documents the work on the modeling of double layer capacitors (DLCs) and the validation of the modeling procedure. Several experiments were conducted to subject the device under test to a variety of charging/discharging profile and temperatures in an effort to simulate the various conditions such a device might encounter in an automotive type applica-tion. High and low current charging profiles were performed for both charge/discharge and charge/hold/discharge type experiments. Low temperature (--25 C), room temperature (-21 'C), and high temperature experiments (-50' C) were performed for the investigation of temperature effects on these devices. The derived DLC model was used in PSpice® and Matlab® simulations to determine how accurately the model could predict the performance of the device. The nonlinear characteristics of the device were also investigated and the nonlinear modeling information presented as an addition to the basic DLC model. Device variation was explored for a small sample of these devices in an effort to gain insight on the range of tolerances for modern devices. This work also presents an extensive look into the variety of electrochemical capacitor devices under investigation and in use today. An expla-nation of these devices and their distributed resistances and capacitance is included. This thesis gives a detailed look into the experimental setups and testing procedures used to test the devices, the simulations for the comparison, and presents the results of the comparison. Finally, this thesis documents the conclusion that this simple model procedure adequately predicts the performance of the device under these various performance profiles.
Thesis Supervisor: Dr. John G. Kassakian
Acknowledgements
I would like to thank the following for their help and support that has lead to the completion
of this work: God; my parents (mom, dad, and Lindy); my grandfather, Doyle Bailey (who has been a role model for me all these years); my uncle, Larry Bailey; my family; my thesis supervisor, Professor John Kassakian, for all his help and guidance throughout this project; Professor David Perreault and Dr. Tom Keim who deserves special recognition for their guidance and efforts involving this project; Dr. John Miller; and the MIT/Industry Consor-tium. Additionally, I'd like to thank the members of MIT's Laboratory for Electromagnetic and Electronic Systems and others at MIT, namely: Ivan Celanovid, Woo Sok Chang, Albert Chow, Alejandro Dominguez-Garcia, James Geraci, Leandro (Ian) Lorilla, Chris Laughman, Padraig Cantillon-Murphy, Tim Neugebauer, Frank O'Sullivan, Tushar Parlikar, Joshua Phinney, Yihui Qiu, Juan Rivas, John Rodriguez, Ernst Scholtz, Dr. Sai Chun Tang, Wayne Ryan, Kiyomi Boyd, Peggy Carney, Gary DesGroseilliers, Vivian Mizuno, Marilyn Pierce, Karen Janson-Strasswimmer, Professor Leeb, Professor Schindall, and John Banzhaf IV. Finally, I'd like to thank my friends, who over the years believed in me, even when I didn't
- Professor Balda, Joe Chang, Angie Chow, Anita Chow, Ron Gaylord, Ann Kachenchai, Tony Kachenchai, Kimmy Lin, Meryl Marr, Marvin Melton, Professor Mantooth, Professor Olejniczak, Kevin Speer, Professor Stewart, and Jake Willis.
1 An Overview of Double Layer Capacitor Technologies 1.1 Introduction .... .... ... .. . . ... . .. .
1.2 Background Summary . . . . 1.2.1 Double Layer Capacitor Basics . . . . 1.2.2 DLCs and Conventional Capacitors . . . .
1.2.3 Energy Storage Devices . . . . 1.2.4 DLCs Contribution to Industry . . . .
1.2.5 DLC Limitations . . . . 1.2.6 Recent Uses of DLC Technology . . . .
1.3 Research Summary . . . .
1.3.1 DLC Model Development . . . . 1.3.2 DLC Model Validation . . . . 1.3.3 Low/High Temperature Effects . . . . 1.3.4 Non-Linear Capacitances . . . .
2 An 2.1
2.2
Introduction to Advanced Electrochemical Introduction . . . . Electrode Discussion . . . . 2.2.1 Carbonaceous Materials . . . . 2.2.1.1 Binders . . . . 2.2.2 Metal Oxides . . . . 2.2.3 Conducting Polymers . . . . 2.2.3.1 Types of ECP Devices . . . . . 2.2.3.2 Pani based ECP Supercapacitors .
Contents
21 21 21 22 23 24 26 29 30 31 31 32 32 34 35 35 37 37 40 40 41 44 45 Energy Storage Devices. . . . . . . . . . . . . . . . . . . . . . . .
2.2.3.3 pMeT based ECP Supercapacitors 2.2.4 Hybrid Devices ... 2.3 Electrolyte Discussion ... 2.3.1 Aqueous Electrolyte . . . . 2.3.2 Nonaqueous Electrolyte . . . . 2.3.3 Polymeric Electrolyte . . . . 2.3.4 Conclusion . . . .
2.4 Distributed Resistances and Capacitances . .
2.5 Investigating Double Layer Capacitor Models
3 Modeling of Double Layer 3.1 Introduction . . . . 3.2
3.3 3.4
Capacitors: Model Extraction
Test Setup . . . . Extraction Procedure . . . .
Example of Extraction Procedure 3.4.1 Calculation of Rf... 3.4.2 Calculation of Cf... 3.4.3 Calculation of Rm . . 3.4.4 Calculation of Cm . . 3.4.5 Calculation of R . . . . 3.4.6 Calculation of C . . . . 3.4.7 Extracted Model
3.4.8 Comparison of Simulated Model to Expe
3.5 3.6
. . . . rimental Data . .
Long-Term Discharge Experiment . . . . Conclusion . . . .
4 Validation of Modeling Procedure: Power Measurement Experiment
4.1 Introduction ... 4.2 Test Setup ... 4.3 DLC Model ... ... 47 . . . . 47 . . . . 49 . . . . 49 . . . . 50 . . . . 52 . . . . 52 . . . . 53 . . . . 56 Experiment 59 59 61 62 68 69 70 72 75 79 81 84 85 87 90 93 93 94 96
. . . . .
.
.
4.4 4.5 4.6 4.7 4.8 4.9 4.10 4.11 4.12 4.13 100 A Experiment ... ... 100 A PSpice Simulation . . . . 100 A Experiment with Delay . . . . 100 A with Delay PSpice Simulation . . . . 10 A Experiment . . . . 10 A PSpice Simulation . . . . 10 A Experiment with Delay . . . . 10 A with Delay PSpice Simulation Simulation -100 A Experiment . . . .
Summary of Experimental/Simulation Results.
5 Temperature Effects on DLCs
5.1 Introduction . . . .
5.2 Room Temperature Experiment .
5.2.1 Test Setup . . . . 5.2.2 Results . . . .
5.3 High Temperature Experiment .
5.3.1 Test Setup . . . .
5.3.2 Results . . . .
5.4 Low Temperature Experiment . . 5.4.1 Test Setup . . . .
5.4.2 Results . . . . 5.5 Conclusion . . . .
6 Modeling of the DLC's Nonlinear 6.1 Introduction . . . .
6.2 Test Setup . . . .
6.3 Extraction Procedure . . . .
6.4 Example of Extraction Procedure 6.4.1 Calculation of Cf . . . . . Capacitances Contents 96 100 104 106 109 111 113 115 118 119 123 123 124 125 126 128 128 130 132 133 134 135 149 149 152 155 156 156
6.4.2 Calculation of Rm ... . . . . . . . .. 165
6.4.3 Calculation of Cm . .. . . . 166
6.4.4 Other Model Parameters . . . . 167
6.4.5 Extracted Model . . . . 168
6.4.6 Comparison of Simulated Model to Experimental Data . . . . 169
6.5 Conclusion . . . . 170
7 An Investigation of Device Variances 173 7.1 Introduction . . . . 173
7.2 Test Setup . . . . 175
7.3 Experimental Results . . . . 179
7.4 DLC Models & Extraction Calculations . . . . 181
7.4.1 DLC #2 . . . . 182
7.4.2 DLC #3 . . . . 188
7.4.3 "Fast" Branch Variance Comparison . . . . 190
7.5 Comparison . . . . 191
7.6 Conclusion . . . . 192
8 Conclusions 195 8.1 Introduction. . . . . 195
8.2 Evaluation of Thesis Objectives and Contributions . . . . 196
A Supplemental Material for Chapter 3: Matlab Code 199 A.1 File Name: expfit . . . . 199
A.2 File Name: model . . . . 199
B Supplemental Material for Chapter 4: Labview and PSpice 201 B.1 Labview . . . . 201
B .2 P Spice . . . . 201
Contents
C.1 File Name: voltagecurrentpower . . . .
D Supplemental Material for Chapter D.1 File Name: temp . . . . D.2 File Name: RT model . . . .
D.3 File Name: HT model ... D.4 File Name: LT model ... D.5 File Name: combo ...
E Supplemental Material for Chapter E.1 File Name: dave-main ...
E.2 File Name: dave-int ... E.3 File Name: spl ...
5: Matlab
6:
F Supplemental Material for Chapter 7:
F.1 File Name: modeDUT2 ...
F.2 File Name: dave-int2 ...
F.3 File Name: File Name: modeDUT3. .
F.4 File Name: dave-int3 ...
Matlab Matlab Code Code Code 205 207 207 208 209 210 211 213 213 214 215 217 217 218 218 . . . . 219 F.5 File Name: F.6 File Name: File Name: spl . ... modeDUTcombo . . . . . Bibliography 220 221 223 . . . . . . . .
List of Figures
1.1 Basic Structure of a Double Layer Capacitor . . . . 22
1.2 Details of Cylindrical Double Layer Capacitor . . . . 23
1.3 Details of Prismatic Double Layer Capacitor . . . . 24
1.4 Diagram of Conventional Capacitor . . . . 25
1.5 Diagram of Double Layer Capacitor . . . . 26
1.6 Electrode/Electrolyte Interface of a Double Layer Capacitor . . . . 28
1.7 Ragone Plot of Various Energy Storage Technologies . . . . 29
1.8 Ragone Plot of Various DLC Technologies . . . . 30
1.9 General Form of a "Short-term" DLC Model . . . . 32
1.10 Basic Experimental Test Circuit . . . . 33
1.11 Basic PSpice@ Simulation Circuit . . . . 34
2.1 Carbon powder electrode DLC . . . . 38
2.2 Structure of pyrrole [41] . . . . 42
2.3 Structure of aniline [41] . . . . 43
2.4 Structure of two thiophene derivatives [41] . . . . 43
2.5 Basic Construction of a Pani-based Supercapacitor [47] . . . . 46
2.6 Discharge Capacitance versus Number of Cycles [47] . . . . 46
2.7 Discharge Capacitance versus Number of Cycles [48] . . . . 47
2.8 Comparison of Carbon-based and Hybrid Supercapacitor [40, 49] . . . . 49
2.9 Electrode/Electrolyte Interface of a Double Layer Capacitor . . . . 54
2.10 Inside a DLC (Not drawn to scale) . . . . 55
2.11 Activated Carbon Pores (Not drawn to scale) [58] . . . . 56
2.12 Zubieta Equivalent Circuit Model of Double Layer Capacitor [3, 30, 53, 54] 57 3.1 Time Constant Comparison . . . . 60
3.2 3.3 3.4 3.5 3.6 3.7 3.8 3.9 3.10 3.11 3.12 3.13 3.14 3.15 3.16 3.17 3.18 3.19 3.20 3.21 3.22 3.23 3.24 3.25 3.26 3.27 3.28 3.29 3.30 3.31
General Form of a "short-term" DLC Model . . . . Charging and Charge Redistribution of DLC (0 to 30 s) . . . . . Charging and Charge Redistribution of DLC (0 to 300 s) . . . .
Charging and Charge Redistribution of DLC (0 to 3000 s) . . . .
Basic Experimental Test Circuit . . . .
Equivalent Circuit at t=0 . . . ..
Charging of the Fast Branch (t<Td) . . . . Charging of the Medium Branch, t = t+off . . . . Charging of the Medium Branch, t > t+off . . . .
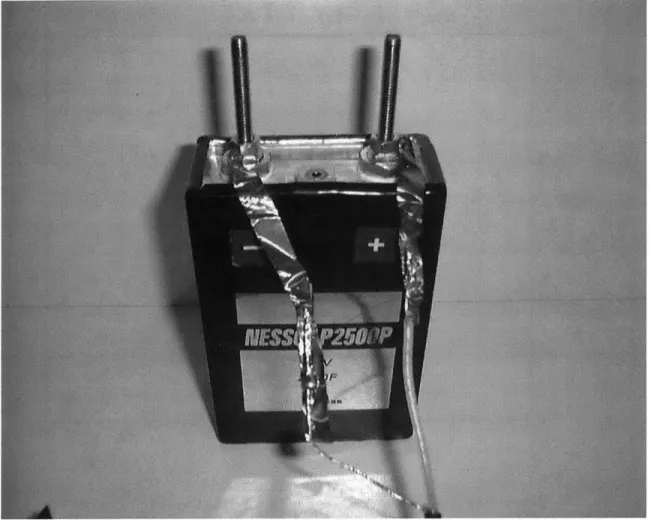
Basic DLC M odel . . . . 2500 F NessCap DLC with Shorting Bar . . . .
Connection of Voltage Probe to DUT . . . . Experimental Data for 2500 F NessCap DLC (0 to 30 s) . . . . . Experimental Data for 2500 F NessCap DLC (0 to 300 s) . . . .
Experimental Data for 2500 F NessCap DLC (0 to 3000 s) . . . .
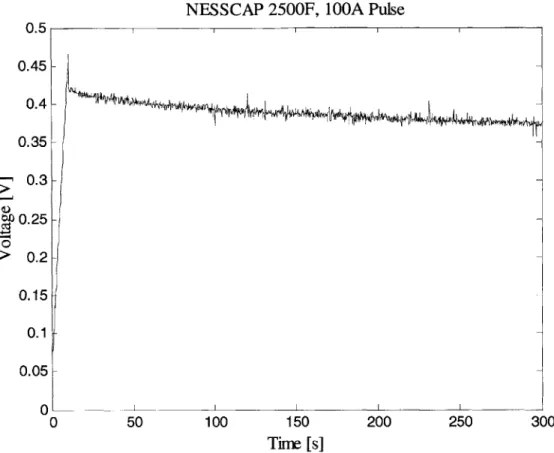
Pulse of Current used to Charge DLC . . . . Voltage of DLC in Response to Charging Pulse . . . . Voltage of DLC in Response to Charging Pulse . . . . Charge (Q) Transferred to DLC . . . .
Initial Decay of DLC Voltage (20 to 30 s). Calculation of R.- . . Decay of DLC Voltage (20 to 90 s). Data used to calculate Cm. Charging of the Slow Branch . . . . Decay of DLC Voltage (30 to 100 s). Calculation of R.. . . . . .
Charging of the Slow Branch . . . . Decay of DLC Voltage (0 to 2000 s). Data used to calculate C,. . Extracted Model for 2500 F NessCap DLC . . . .
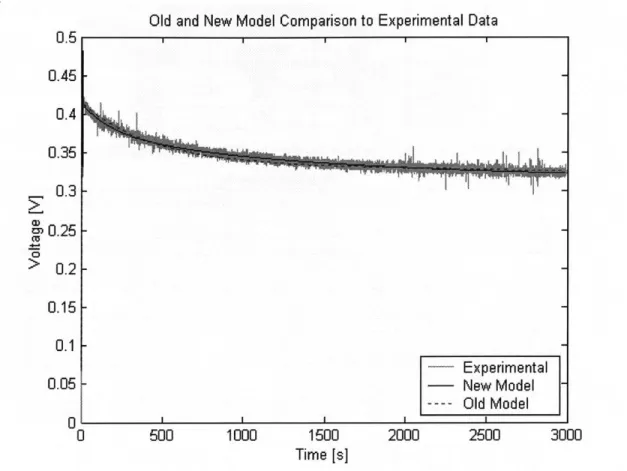
Sim ulink Setup . . . . Model Comparison for 2500 F NessCap DLC (0 to 30 s) . . . . . Model Comparison for 2500 F NessCap DLC (0 to 300 s) . . . .
Model Comparison for 2500 F NessCap DLC (0 to 3000 s) . . . .
. . . . 61 . . . . 62 . . . . 63 . . . . 64 . . . . 65 . . . . 66 . . . . 66 . . . . 67 . . . . 67 . . . . 69 . . . . 70 . . . . 71 . . . . 72 . . . . 73 . . . . 74 . . . . 75 . . . . 76 . . . . 77 . . . . 78 - . . . .. 79 . . . . 80 . . . . 82 . . . . 83 . . . . 84 . . . . 85 . . . . 86 . . . . 87 . . . . 88 . . . . 89 . . . . 90
List of Figures
3.32 DLC Charged to and Held at 1 V . . . . 91
3.33 Long-Term Voltage Decay . . . . 92
3.34 Extracted Model for 2500 F NessCap DLC with Rik . . . . 92
4.1 Power Experiment Test Circuit . . . . 94
4.2 Basic PSpice® Simulation Circuit . . . . 95
4.3 Extracted Model for 2500 F NessCap DLC . . . . 96
4.4 Model Comparison for 2500 F NessCap DLC (0 to 30 s) . . . . 97
4.5 Model Comparison for 2500 F NessCap DLC (0 to 300 s) . . . . 98
4.6 Model Comparison for 2500 F NessCap DLC (0 to 3000 s) . . . . 99
4.7 100 A Experiment (Voltage, Current, and Power Waveforms) . . . . 100
4.8 100 A PSpice® Simulation Results (Voltage, Current, and Power Waveforms) 102 4.9 100 A PSpice® Simulation Energy Results . . . . 103
4.10 100 A PSpice® Simulation Energy Results for each Brach . . . . 104
4.11 100 A Experiment with Delay (Voltage, Current, and Power Waveforms) . . 106
4.12 100 A with Delay PSpice® Simulation Results (Voltage, Current, and Power W aveform s) . . . . 107
4.13 100 A with Delay PSpice® Simulation Energy Results . . . . 108
4.14 100 A with Delay PSpice® Simulation Energy Results for each Brach . . . 109
4.15 10 A Experiment (Voltage, Current, and Power Waveforms) . . . . 110
4.16 10 A PSpice@ Simulation Results (Voltage, Current, and Power Waveforms) 111 4.17 10 A PSpice@ Simulation Energy Results . . . . 113
4.18 10 A PSpice® Simulation Energy Results for each Brach . . . . 114
4.19 10 A Experiment with Delay (Voltage, Current, and Power Waveforms) . . 115
4.20 10 A with Delay PSpice® Simulation Results (Voltage, Current, and Power W aveform s) . . . . 116
4.21 10 A with Delay PSpice@ Simulation Energy Results . . . . 117
4.22 10 A with Delay PSpice® Simulation Energy Results for each Branch . . . 118
4.23 -100 A Experiment (Voltage, Current, and Power Waveforms) . . . . 120
5.1 Basic Experimental Test Circuit . . . . 124
Oven Test Setup . . . . 126
Wires and Gas Line Entering Oven . . . . 127
DLC in Oven . . . . 128
Extracted Room Temperature Model for 2500 F NessCap DLC . . . . 129
Room Temperature Model Comparison for 2500 F NessCap DLC (0 to 30 s) 130 Room Temperature Model Comparison for 2500 F NessCap DLC (0 to 300 s) 131 Room Temperature Model Comparison for 2500 F NessCap DLC (0 to 3000 s) 132 Oven Temperature Versus Time . . . . 133
5.3 5.4 5.5 5.6 5.7 5.8 5.9 5.10 5.11 5.12 5.13 5.14 5.15 5.16 5.17 5.18 5.19 5.20 5.21 5.22 5.23 Maxwell 450 F DLC . . . . Basic Test Circuit . . . . Charging of DLC . . . . General Form of a Nonlinear "short-term" DLC Model . . . Basic Experimental Test Circuit . . . . Copper Foil Connection to Device . . . . Connection of Device to Interface Board . . . . Illustration of Contact Resistances . . . . View of Test Circuit . . . .
(0
(0
(0
(0 t
(0 t (0 t . . . . . 134 to 30 s) 135 to 300 s) 136 to 3000 s) 137 . . . . . 139 . . . . . 140 . . . . . 141 o30 s) . 142 o 300 s) 143 o 3000 s) 144 . . . . . 145 . . . . . 146 . . . . . 147 . . . . 150 . . . . 151 . . . . 152 . . . . 153 . . . . 154 . . . . 155 . . . . 156 . . . . 157 . . . . 158Extracted High Temperature Model for 2500 F NessCap DLC . High Temperature Model Comparison for 2500 F NessCap DLC High Temperature Model Comparison for 2500 F NessCap DLC High Temperature Model Comparison for 2500 F NessCap DLC
DLC in Oven with Dry Ice . . . .
Temperature Versus Time . . . . Extracted Low Temperature Model for 2500 F NessCap DLC . Low Temperature Model Comparison for 2500 F NessCap DLC Low Temperature Model Comparison for 2500 F NessCap DLC Low Temperature Model Comparison for 2500 F NessCap DLC
DLC Performance with Temperature Variation (0 to 30 s) .
DLC Performance with Temperature Variation (0 to 300 s) DLC Performance with Temperature Variation (0 to 3000 s) 6.1 6.2 6.3 6.4 6.5 6.6 6.7 6.8 6.9
List of Figures
6.10 Close-up View of Test Circuit . . . . 159
6.11 DLC "Cluster" and "Interface Board" . . . . 160
6.12 Initial and Final Slope of the Charging DLC . . . . 161
6.13 Initial and Final "Intervals" . . . . 162
6.14 Pulse of Current use to Charge DLC . . . . 163
6.15 Charge (Q) Transferred to DLC . . . . 164
6.16 Change in DLC Terminal Voltage during Initial and Final Intervals . . . . . 165
6.17 Spline Generated Nonlinear Capacitance . . . . 166
6.18 Extracted Parameters for the 450 F Maxwell DLC Model . . . . 168
6.19 Model Comparison for 450 F Maxwell DLC (0 to 30 s) . . . . 169
6.20 Model Comparison for 450 F Maxwell DLC (0 to 300 s) . . . . 170
6.21 Model Comparison for 450 F Maxwell DLC (0 to 3000 s) . . . . 171
7.1 Series Connected DLC Circuit . . . . 174
7.2 Experimental Circuit of Series Connected DLCs . . . . 175
7.3 Variance Experimental Test Setup . . . . 176
7.4 Diode "Or" Circuit . . . . 177
7.5 DLC Cluster and Interface Board . . . . 177
7.6 Interface Board . . . . 178
7.7 Precision Unity Gain Differential Amplifier Circuit . . . . 179
7.8 Differential Amplifier Board . . . . 180
7.9 Laboratory Test Setup . . . . 181
7.10 Laboratory Test Setup . . . . 182
7.11 DLC Voltage Curves (0 to 6 s) . . . . 183
7.12 DLC Voltage Curves (0 to 30 s) . . . . 184
7.13 DLC Voltage Curves (0 to 300 s) . . . . 185
7.14 DLC Voltage Curves (0 to 3000 s) . . . . 186
7.15 DLC Voltage Curves for DLCs #2 & 3 (0 to 30 s) . . . . 187
7.16 DLC Voltage Curves for DLCs #2 & 3 (0 to 300 s) . . . . 188
7.17 DLC Voltage Curves for DLCs #2 & 3 (0 to 3000 s) . . . . 189
7.19 DLC #3 vs. Nonlinear DLC Model . . . . 192
7.20 Model Comparison to Experimental Data . . . . 193
7.21 Spline Generated Value of Nonlinear Capacitance for DLC #2 & 3 . . . . . 194
B.1 LabView® Screen Capture . . . . 201
B.2 100A Simulation Circuit Diagram . . . . 202
B.3 100A with Delay Simulation Circuit Diagram . . . . 202
B.4 1OA Simulation Circuit Diagram . . . . 203
1.1 Comparison of Maxwell DLC Technologies . . . .
1.2 Comparison of NessCap DLC Technologies . . . . 1.3 Comparison of EPCOS DLC Technologies . . . . 2.1 Energy Storage Device Comparison [32] . . . .
2.2 Comparison of Raw Carbon Materials [36] . . . . 2.3 Comparison of Specific Capacitance and Surface Area [34, 38] 2.4 Summary of Acronyms . . . . 2.5 n/p pMeT Supercapacitor [40, 49] . . . . 2.6 Capacitance of Activated Carbon [40] . . . . 2.7 Summary of Acronyms . . . . 2.8 Comparison of Electrolyte Classifications and Conductivity [32, 3.1 Extracted Parameters for the 2500 F NessCap DLC Model . .
4.1 Summary of Calculated Discharge Resistances . . . .
4.2 Extracted Parameters for the 2500 F NessCap DLC Model 4.3 Summary of Experimental/Simulation Results for 100 A Test
4.4 4.5 4.6 4.7 4.8 52]
Summary of Experimental/Simulation Results for 100 A Delay Test Summary of Experimental/Simulation Results for 10 A Test . . .
Summary of Experimental/Simulation Results for 10 A Delay Test Summary of Experimental/Simulation Results . . . .
Summary of Simulated Branch Energy Losses . . . .
5.1 Extracted Parameters for the 2500 F NessCap DLC Model (Room Temper-ature) . . . .
5.2 Extracted Parameters for the 2500 F NessCap DLC Model (High Tempera-tu re) . . . .
List of Tables
. . . 26 . . . 27 . . . 27 . . . 36 . . . 39 . . . 41 . . . 42 . . . 48 . . . 48 . . . 51 . . . 53 86 96 100 103 . . . . 108 . . . . 112 . . . . 117 . . . . 120 . . . . 121 129 1345.3 Extracted Parameters for the 2500 F NessCap DLC Model (Low
Tempera-ture) . . . . 138
5.4 Experimental Comparison . . . . 138
5.5 Extracted Resistance Parameters for the 2500 F NessCap DLC Model . . . 138
5.6 Extracted Capacitance Parameters for the 2500 F NessCap DLC Model . . 141
5.7 Extracted Time Constants for the 2500 F NessCap DLC Model . . . . 141
6.1 Data Table for Matlab@ Model . . . . 164
6.2 Voltage dependent capacitance for Cf . . . . 167
6.3 Extracted Parameters for the 450 F Maxwell DLC Model . . . . 168
7.1 Extracted Parameters for the 450 F Maxwell DLC #2 Model . . . . 188
7.2 Extracted Parameters for the 450 F Maxwell DLC #3 Model . . . . 190
7.3 Data Table for DUT #2 . . . . 190
Chapter 1
An
Overview of Double Layer Capacitor
Technologies
1.1
Introduction
Double layer capacitors (DLCs) are an emerging technology that possesses a greater spe-cific energy density (Wh/kg) than conventional capacitors (i.e., electrolytic capacitors) and a higher specific power density (W/kg) than lead-acid automotive battery technologies. Additionally, these devices are light weight, low-volume, and low cost (a predicted cost of ~'-1e/F within a few years). Automobile manufactures are interested in the abilities of these devices to enhance existing automotive electrical systems and to make possible the use of new technologies for future automobiles. These new technologies for future automobiles will lead to a more efficient automobile, an increase in safety for the motorist/public, and an improvement in comfort and luxury of the automobile.
The development of equivalent models is a necessary step for using this technology in existing and future systems. This chapter presents a summary of the research completed that contributes to the understanding of these complex devices, the development of equivalent circuit models for these devices, and finally, the investigation of the use of these devices in advanced automotive electrical systems.
1.2
Background Summary
Double layer capacitors go by several names, an example of a few of these names include: ultra-capacitor, super-capacitor, electric double layer capacitor, electrochemical double layer capacitor, and pseudocapacitor. Some recent journal articles seem to attempt to distinguish between the different names according to the dominant storage mechanism (i.e. non-faradaic and faradaic charge storage), while other articles seem to use the different terms interchange-ably [1]. The devices investigated during the course of this research program will be referred to in this thesis using the general term-double layer capacitor.
1.2.1 Double Layer Capacitor Basics
Double layer capacitors are an exciting technology that seems to have great potential in both existing and future electronic systems. They have numerous advantages: charge/discharge efficiencies superior to that of batteries, near infinite shelf life and cycleability, minimal (if any) maintenance, and most DLCs can be fully discharged without reducing the lifetime of the device. These capacitors are distinguished from other capacitors in that they are limited to low voltage ratings and have an extremely large capacitance per unit volume as compared to conventional capacitors (sometimes as high as 100 times the capacitance per unit volume of a conventional electrolytic capacitor) [2, 3, 4, 5, 6].
The basic structure of a DLC and some of the more common materials used in the con-struction of its components can be seen in Fig. 1.1. Double layer capacitors are available currently in both cylindrical (Fig. 1.2) and prismatic packages (Fig. 1.3). An electrically insulating ion permeable separator resides between two activated carbon electrodes. With its near ideal charge/discharge characteristics, carbon is widely used as the electrode ma-terial; however, other high surface area materials are also used [7]. Although there is no physical contact between the electrodes, ion transfer does occur [8].
Polypropylene
Aluminum
Activated Carbon/Electrolyte
Figure 1.1: Basic Structure of a Double Layer Capacitor
Double layer capacitors can be constructed with either an aqueous or non-aqueous (often an organic) electrolyte. Volumetric energy densities of 5500 Wh/m3 have been projected when using a DLC with a sulfuric acid electrolyte [9]. In comparison, volumetric energy densities of 20,000 Wh/m3 have been projected for DLCs that are to be constructed using a non-aqueous electrolyte [9].
1.2 Background Summary
Separators
Case
Electrodes
Figure 1.2: Details of Cylindrical Double Layer Capacitor
A relationship between the type of electrolyte used in a DLC and its operating voltage and
ESR exist. Aqueous DLCs exhibit a lower ESR and lower operating voltage resulting in lower energy densities and higher power densities than non-aqueous DLCs. In contrast, non-aqueous DLCs exhibit a higher ESR and higher operating voltage which results in a superior energy density but an inferior power density than aqueous based DLC. The DLCs
investigated in this research program are devices that use a non-aqueous electrolyte.
1.2.2
DLCs and Conventional Capacitors
An illustration of a conventional capacitor (e.g., an electrolytic capacitor) is shown in Fig. 1.4. The capacitance of this device is given by (1.1) and the distance, d (on the order of 0.01 microns for an electrolytic capacitor [10]), is determined by the thickness of the dielectric
used in the device. The area, A, is the surface area of the dielectric film, and CoEr is the product of the permittivity of free space and the dielectric material used respectively. The capacitance achieved in this device is entirely due to electrostatic charge storage.
C= orA1.1) d
Separato
Electrodes
Case--Figure 1.3: Details of Prismatic Double Layer Capacitor
A diagram of a double layer capacitor is provided in Fig. 1.5. The capacitance possessed by a DLC is proportional to surface area, A, of the electrode bulk/electrolyte interface
(which is extremely high for a DLC as compared to conventional capacitors-1000-2000
m2/g for activated carbon) and inversely proportional to the distance, d (on the order of a
few angstroms for a DLC), separating the charged ions in the electrolyte from the charges in the electrode bulk material.
Double layer capacitors also store charge electrostatically; however, charge storage occurs at the electric double layer formed at the solid/liquid interface. This phenomena is illus-trated in Fig. 1.6). In addition, DLCs can store charge through a faradaic (leading to a capacitance termed "pseudocapacitance") charge storage reaction. The level of pseudoca-pacitance possessed by the DLC is determined by the materials used for the electrode bulk and electrolyte. This research looks at devices that posses little pseudocapacitance and hence the capacitance of the device is dominated by the relation given in (1.2).
CDLC OCA (1.2)
1.2.3 Energy Storage Devices
Double layer capacitor technology can be viewed as a hybrid technology somewhere be-tween lead-acid battery technology and conventional electrolytic capacitor technology in that DLCs posses some of the better qualities of the battery device and combine those
1.2 Background Summary
Dielectric
Electrodes
Distance, d
Figure 1.4: Diagram of Conventional Capacitor
qualities with some of the desirable attributes of the electrolytic capacitor. Double layer capacitors can provide high specific (gravimetric) power densities (W/kg), between 10-20 times greater than those of lead-acid battery technologies [1, 11, 12]. They have a higher specific energy density (Wh/kg) than other capacitor technologies. Double layer capacitors energy densities can exceed those of conventional capacitors by approximately 10-100 times [1, 3, 13]. Figure 1.7 shows a Ragone plot of several energy storage technologies. This plot illustrates specific power versus specific energy, where conventional capacitors have the highest specific power rating and battery technology has the highest specific energy rating. Double layer capacitors on this Ragone plot can be seen to bridge the gap between the other two energy storage technologies with respect to specific power and specific energy.
Besides comparing general energy storage technologies, the Ragone plots in Figs. 1.7 & 1.8 also illustrates some of the current DLC technologies available from various DLC manufac-turers (Maxwell, 4 devices; NessCap, 6 devices; and Epcos, 13 devices). Fig. 1.8 shows a more detailed look at these commercially available devices. Tables 1.1 - 1.3 tabulate the pertinent data for these 23 devices as shown on manufacture's data sheets. As can be seen in Fig. 1.8, an EPCOS device is plotted with the highest specific power rating of the three manufactures DLC lines shown. A detailed look at the ESR values given for the devices plotted in the Ragone diagram will reveal that the EPCOS line boast the lowest ESR values (as low as 0.2 mQ). In addition, Fig. 1.8 demonstrates that a NessCap device is plotted as having the highest specific energy of the devices in this plot. NessCap offers the highest rated terminal voltage (2.7 V) of the three DLC lines shown.
Electrolyte
Activated Carbon
Activated Carbon7Z
Distance, d
Figure 1.5: Diagram of Double Layer Capacitor Maxwell Technologies
Model Farad Continuous Maximum Specific Power Specific Energy
Voltage ESR (W/kg) (Wh/kg)
BCAP0013 450 (-20%/+20%) 2.5 V 2.4 mQ © 25*C 3400 © 2.5 V 2.1 ( 2.5 V BCAP0014 900 (-20%/+20%) 2.5 V 1.6 mQ 0 25*C 3800 © 2.5 V 3.0 L 2.5 V BCAP0015 1800 (-20%/+20%) 2.5 V 0.9 mQ L 25'C 4300 © 2.5 V 3.9 © 2.5 V BCAP0016 12600 (-20%/+20%) 2.5 V 0.7 mQ © 250C 4300 © 2.5 V 4.3 © 2.5 V
Table 1.1: Comparison of Maxwell DLC Technologies
1.2.4 DLCs Contribution to Industry
Recent journal articles and other writings document several applications that may benefit from DLC technology. Many of these applications are sufficiently developed that the DLC may be used to improve efficiency and/or performance by replacing an existing device. Other systems that may benefit from DLC technology are either in the process of being developed now or systems that have been envisioned but are not feasible without the addition of a technology such as the DLC. For instance, the use of DLCs in a system may allow the productions of a portable system that otherwise would require much larger batteries, and therefore would become too bulky to merit production.
1.2 Background Summary
NessCap
Model Farad Continuous Maximum Specific Power Specific Energy
Voltage ESR (DC 100A) (W/kg)t (Wh/kg)t
HP1200P-0023A 1200 (-10%/+30%) 2.3 V 0.7 mQ 4970 2.32 HP250OP-0023A 2500 (-10%/+30%) 2.3 V 0.5 mQ 4070 2.83 HP3500P-0023A 3500 (-10%/+30%) 2.3 V 0.4 mQ 3800 2.96 HP1700P-0027A 1700 (-10%/+30%) 2.7 V 0.7 mQ 6850 4.53 HP3500P-0027A 3500 (-10%/+30%) 2.7 V 0.5 mQ 5610 5.45 HP500OP-0027A 5000 (-10%/+30%) 2.7 V 0.4 mQ 5240 5.82
t
Measured at matched loadTable 1.2: Comparison of NessCap DLC Technologies
EPCOS
Model Farad Continuous Maximum Specific Power Specific Energy
Voltage ESR (W/kg)t (Wh/kg)t B49300F1605Q000 600 (-10%/+30%) 2.3 V 2.0 mQ A 25'C 2300 1.5 B49300G1126Q000 1200 (-10%/+30%) 2.3 V 0.9 mQ A 25'C 3700 2.2 B49620A1186Q000 1800 (-10%/+30%) 2.3 V 0.4 mQ A 25'C 10700 4.3 B49610A1186Q000 1800 (-10%/+30%) 2.3 V 1.0 mQ A 25'C 3800 3.8 B49300G1236Q000 2300 (-10%/+30%) 2.3 V 0.5 mQ A 25'C 3600 2.3 B49620A1236Q000 2300 (-10%/+30%) 2.3 V 0.7 mQ A 25'C 4800 4.3 B49300L1276Q000 2700 (-10%/+30%) 2.3 V 0.6 mQ A 25'C 3000 2.7 B49300A1366Q000 3600 (-10%/+30%) 2.3 V 1.2 mQ A 25'C 1700 4.1 B49400A2605Q002 600 (-10%/+30%) 2.5 V 0.6 mQ A 25'C 16300 3.3 B49400A2126Q002 1200 (-10%/+30%) 2.5 V 0.4 mQ A 25'C 13000 3.5 B49400A2276Q002 2700 (-10%/+30%) 2.5 V 0.23 mQ A 25*C 11300 3.9 B49400A2366Q002 3600 (-10%/+30%) 2.5 V 0.2 mQ A 25'C 11200 4.5 B49400F2506Q000 5000 (-10%/+30%) 2.5 V 0.25 mQ A 250C 7400 5.1
t
Measured at matched loadElectroc
Solid/Li
Helmholtz Layer (few Angstroms)
e Bulk
Electroly
-
Average
Ionic
Center
quid Interface
te
Figure 1.6: Electrode/Electrolyte Interface of a Double Layer Capacitor
of DLC technology: consumer electronics, such as personal digital assistants (PDAs), digital cameras, power tools, toys, digital clocks, wireless communication, GSM-protocol cell phones, two-way pagers, handheld GPS systems, and automotive applications such as automobiles equipped with advanced automotive subsystems, and electric/hybrid cars
[12, 14, 15].
This research focuses on DLCs' usability in automotive type applications. These devices are foreseen as devices that may complement a battery in hope of increasing the performance of the system and to improve the system efficiency. Some of the more widely anticipated applications for the DLC may be a brake-by-wire subsystem, a steer-by-wire subsystem, the integrated starter/generator (ISG) and the regenerative braking subsystem. The re-generative braking system could capture energy to charge the DLC, and then this energy may be used to provide peak power for/during acceleration as well as for the starting of the vehicle [7, 13, 16, 17]. Additionally, the DLC may help to load level the battery in an electric/hybrid vehicle (or other system) and to ease peak power requirements for the battery, and to help reduce the chances of the battery suffering from voltage sags and thus, extending the life of the battery [1, 7, 18]. Furthermore, most common batteries are not designed to accept large short bursts of power, as may be required to harness the energy produced in regenerative braking systems, and to do so may damage them [12, 19]. How-ever, DLCs can accept regenerative braking systems' high-pulsed charging energy without
1.2 Background Summary
Ragone Diagram of Various Energy Storage Technologies
Convention
Cap citor
10 1 + Maxwell O Nesscap V Epcos DLC Battery 10 10 Specific Energy [Wh/kg] 102 103Figure 1.7: Ragone Plot of Various Energy Storage Technologies
negative consequences. Finally, the use of DLCs could allow designers to reduce the number of batteries used in a system and/or reduce the size of batteries used and work towards the elimination of the practice of over-sizing batteries to accommodate peak power demands
[1, 12, 20, 21]. This reduction in battery volume and the use of DLCs can lead to a more
portable design and improvements in energy management, as well as reductions of system size, weight, and cost [12].
1.2.5 DLC Limitations
The main limitation of DLCs is their low voltage rating (~3 V for non-aqueous based devices). The series combination of the capacitors will increase the voltage of the overall combination of the devices; unfortunately, for the most part, this solution is not enough. Due to manufacturing tolerances, which maybe as high as ±20%, the voltages and energies of each individual capacitor may differ greatly throughout the series-chain of devices, leading to other problems and limiting the lifetime of the devices. This serious issue impedes designing systems such as the 42V PowerNet, which will require the series combination of
17-20 DLCs in order to achieve the needed voltage level [22]. Additional limitations of the DLC include: the capacitance of the DLC may be found to change by up to +30%
a
0 U (1) CL 102 ' 102 . Ia)
a-)
0,
W,
103
Ragone Diagram of Various DLC Technologies
+ Maxwell-O Nesscap V Epcos V7 V OG7 V VV 100 Specific Energy [Wh/kg]
Figure 1.8: Ragone Plot of Various DLC Technologies
101
depending on the temperature, when pulsed at high charge/discharge rates, they have a reduced capacitance rating, and as with other capacitors, the voltage drops as it discharges thus requiring some from of a voltage regulator in many system designs [1, 23, 24, 25]. Several solutions to the problem of voltage equalization and minimization of device volt-age fluctuation have been proposed including the use of: Zener diodes, bleeder resisters, switched resistors, or conventional electrolytic capacitors in parallel, a matrix or array of DLCs (parallel combinations of series-chains in a grid-like formation), dc/dc converters or smart/multi-functional dc/dc converters to raise the voltage level and to regulate an output
[16, 22, 26, 27, 28]. Each of the above solutions has its own downside; the use of bleeder
resisters and Zener diodes raises concerns of system efficiency; the use of an array of DLCs may be cost prohibitive; and the use of dc/dc converters may be not only cost prohibitive but also create unacceptable system complexity for some designs.
1.2.6 Recent Uses of DLC Technology
Currently, DLCs are being used to supply peak power in some electronic devices, to supply power to IC memories, to provide temporary backup for power systems and electronic
10
1.3 Research Summary
devices, and in the automotive industry [12, 29]. Honda employs DLCs in its new Integrated Motor Assist (IMA) system. In Honda's power assist/power regeneration process, the DLCs provide power to assist in acceleration and store power during braking. Additionally, Honda used DLCs in the J-VX concept car in 1997 and now in their fuel cell powered/regenerative braking equipped FCX.
1.3
Research Summary
After the initial background/literature search on DLCs and their role in automotive type applications, this research focused on the development and validation of simple linear "short-term" DLC models. Furthermore, this research investigated the temperature effects on DLCs, complex non-linear modeling of DLCs, and how DLCs can be used to enhance existing automotive electrical systems and/or future automotive electrical systems.
1.3.1 DLC Model Development
The development of DLC models is a necessary step for exploiting the benefits of this technology. As with many systems, the model can range from very simple to extremely complex, depending on the required level of accuracy that the model is to predict. The use of DLCs as a supplemental energy storage device for advanced automotive electrical systems will require the device to perform under a variety of system profiles from rapid charging/discharging (short-term storage) to long-term storage (e.g., 60 days). Figure 1.9 shows the general form of a "short-term" DLC model. Chapter 3 of this thesis illustrates the development of such a model and Chapters 3 & 4 demonstrated that the DLC can be modeled with acceptable accuracy for short-term charging/discharging as would be required for some advanced automotive electrical systems (e.g., steer by wire, regenerative braking). The procedure used for the extraction of the model parameters for the "short-term" model is similar to the method proposed by Zubieta in his work [30].
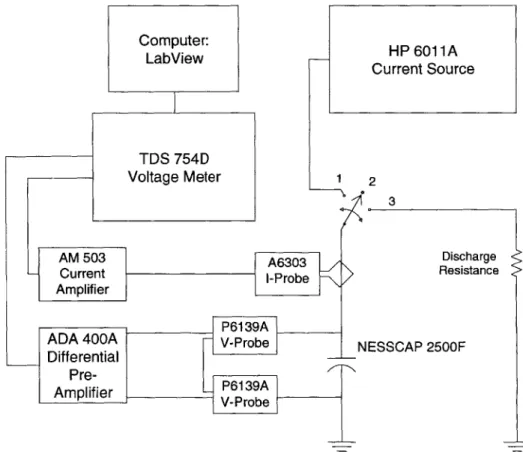
A basic diagram of the experimental setup used in the extraction of the DLC model
param-eters is shown in Fig. 1.10. The test setup illustrated in Fig. 1.10 consists of a HP 6011A power supply operating as a constant current source, the device under test, and a TDS
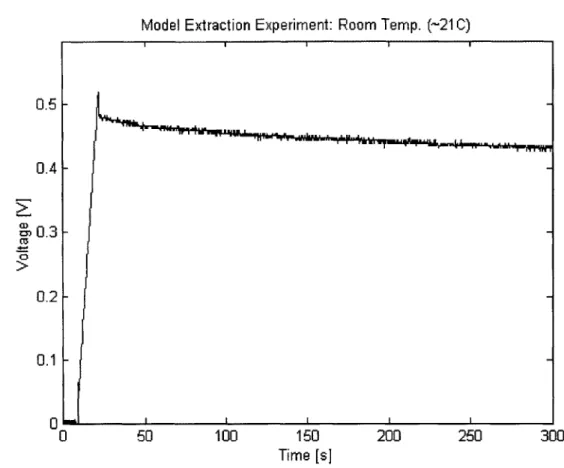
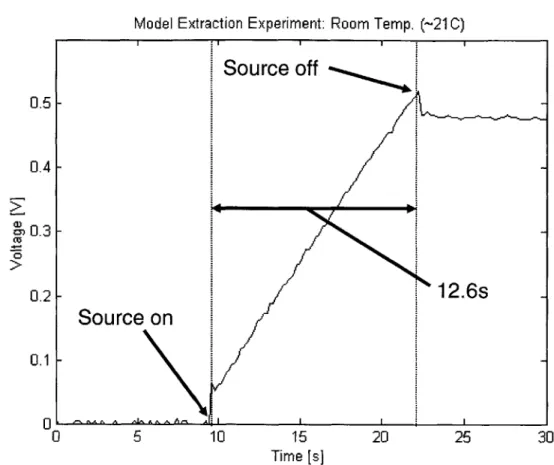
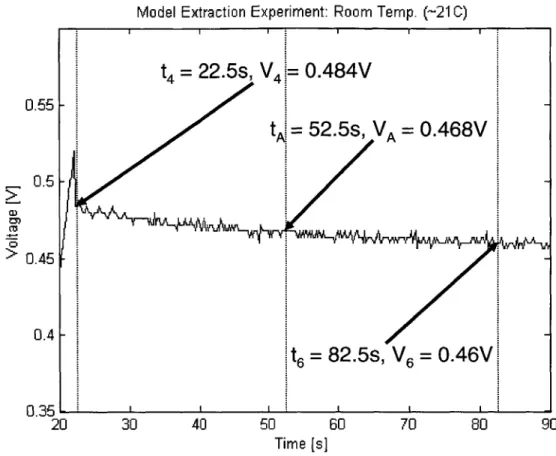
754D oscilloscope for recording data. For the "Model Extraction" experiment, the device
was charged with a constant current (of approximately 100A) to a maximum experimental voltage (approximately 0.5 V) and then open circuited for the remainder of the experiment. Current measurements were taken from the line feeding current into the DLC by a current probe which is fed to the oscilloscope via a current amplifier. Experimental data was then
be dumped into the computer via LabView® so that MATLAB® could be used to filter and plot the data for analysis.
Rf
>Rm
R
Rik
S Cf Cm M C
Figure 1.9: General Form of a "Short-term" DLC Model
1.3.2
DLC Model Validation
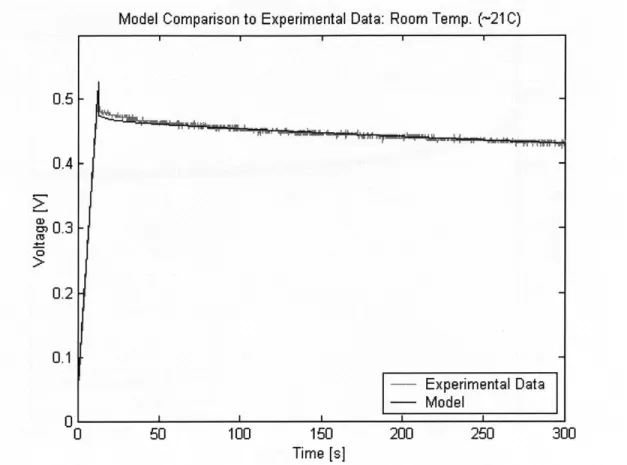
The DLC behavior is physically complex and the question is raised as to whether a fixed
model can be used to describe the device's behavior over a range of conditions. Therefore, in an effort to attempt to validate the model extracted from the "Model Extraction" ex-periment, the device and model was subjected to a variety of conditions and the results compared. First, the model was subjected to the same testing profile of the "Model Ex-traction" experiment and the experimental results compared to the simulation results by overlaying the experimental curve with the curve generated by the model. Second, the de-vice (and model) underwent a variety of current profiles that include high and low current charging (discharge via a resistive load) and profiles that investigated the effects that a de-lay period (between the constant charge and resistive discharge) has on the performance of device. The comparison for the various current profiles include a quantitative investigation of the energy transfer (comparing discharge energy out with charge energy in). The general PSpice@ simulation circuit is shown in Fig. 1.11. This figure illustrates the DLC model, a constant current source that generates the pulse of current used to charge the model, the discharge resistance needed when performing simulations that include discharging the device, and the switching network that emulates the switching conditions that the device were subjected to in the lab.
1.3.3
Low/High Temperature Effects
The effect that temperature has on DLCs is important when designing a system that will be subjected to various temperatures (such as in an automotive electrical system). Therefore, this research includes experiments that help explain the effect of temperature on DLCs and
1.3 Research Summary Computer: LabView K-AM 503 A6303 - Current I-Probe Amplifier 2 3 Discharge Resistance NESSCAP 2500F
Figure 1.10: Basic Experimental Test Circuit
the models of DLCs. These temperature experiments do not attempt to be as quantitative as the experiments to used when subjecting the device to various current profiles; instead, they are used to determine the trends that temperature has on the model parameters. For the low-temperature experiment, a low-temperature environment (-30'C) cooled the device for a predetermined time period. Next, the device was subjected to a testing profile similar to the one used when extracting the model parameters at room temperature. A low-temperature model was extracted from the low-temperature data to compare to the room temperature model.
In addition to the low-temperature experiment, this research investigated the effect that high-temperature has on DLCs and their models. For the high-temperature experiment, the device was placed in an oven (set at 50 C) for an extended period of time and then subjected to a testing profile similar to that used when extracting the model parameters at room temperature. The temperature data was then used to determine a high-temperature model, which was compared to the room high-temperature model to determine how elevated temperatures effect DLCs.
HP 601 1A
Current Source
TDS 754D
P6139A
ADA 400A -V-Probe
Differential-
Pre-Amplifier -P6139A V-Probe
Switching
Discharge
Resistance
DLC Model
Figure 1.11: Basic PSpice® Simulation Circuit
1.3.4
Non-Linear Capacitances
The non-linear capacitance of the DLCs is a voltage dependent capacitance due to the interfacial tension in the double-layer [30, 311. The nonlinear capacitance of DLCs, as mentioned in Zubieta's work, is an inherent aspect of DLCs and is therefore an important component of a "complete" DLC model [30]. One goal of this research is to advance the comprehension of this phenomenon. By working towards modeling this aspect of the DLC, this research strives to contribute a better understanding of the non-linear capacitance of DLCs to the field of Electrical Engineering.
Current
Source
_f- 1
Chapter 2
An
Introduction to Advanced
Electrochemical Energy Storage Devices
2.1
Introduction
Electrochemical energy storage devices, such as batteries, are commonplace in today's con-sumer products (cell phone, automobiles, personal mobile music devices, laptop computers, television remote controls, etc.). But batteries are not the only form of electrochemical energy storage device available. Electrochemical capacitors are another important form of these devices. Electrochemical capacitors can store charge electrostatically (as a con-ventional capacitor) or through an oxidation/reduction (redox) process (similar to energy storage by a battery). Table 2.1 gives a comparison of some electrochemical devices and their storage capabilities. The table shows a comparison of three types of electrochemical energy storage devices and the storage capability (given in terms of the number of elec-trons per atom involved in the storage process). The first device shown is a "general" battery, which relies on an electrochemical reaction as a method of energy storage. The remaining devices shown are electrochemical capacitors (double layer capacitor and pseu-docapacitor). The electrochemical capacitor is further classified by two sub-groups, the double layer capacitor (which primary form of energy storage is electrostatic in nature) and the pseudocapacitor (whose primary means of energy storage is via an electrochemical reaction). These sub-groups are distinguished from one another by the device's primary form of energy storage. One important difference to notice between the battery and the two classifications of capacitor technology is that the storage capability of the battery is determined by the bulk material of the electrodes, whereas, for the other two devices, the storage capability primarily depends on the accessible surface area of the electrodes. Double layer capacitors (DLCs) store charge primarily through an electrostatic mechanism. That is, in the electric field between the conduction band electrons of the electrode material (carbon or metal in some cases) and electrolyte ion accumulation at the double-layer inter-face. The charge storage is considered a direct or a non-Faradaic form of charge storage (i.e., no intermediate chemical reaction has to occur for the storage of the energy). This form of charge storage is the lowest of the three shown in Table 2.1, but due to the enormous surface
Energy Storage Device Comparison
Device Storage
Battery 1 - 3 e-/atom of bulk phase material
Double Layer Capacitor 0.17 - 0.20 e-/atom of accessible surface area Pseudocapacitor -2.5 e-/atom of accessible surface areat
t
Based on -500 pLF/cm2Table 2.1: Energy Storage Device Comparison [32]
area possessed by these devices, the total amount of energy storage possible is significant. The storage of charge for these devices is on the order of tens of piF/cm2 [32, 33].
Pseudocapacitors rely on reduction/oxidation charge storage mechanisms for their primary form of energy storage . This form of charge storage occurs with electron transfer and results in a change in oxidation state of the material involved. During the process of storing charge, the charge is passed through the double-layer (electrode/electrolyte) interface. The electrons involved in this process are valence electrons of the redox material [32, 33].
OxidizedMaterial + e-- ReducedMaterial
The energy storage achievable by indirect or Faradaic charge storage is greater, for a given interfacial area, than that achievable by the double-layer charge storage (however, the in-direct method of energy storage is a slower method than the in-direct method-thus reducing the devices relative power density). Faradaic charge storage is able to achieve values of 100s to 1000s of pF/cm2 [32, 33]. The electrode materials used in these devices tend to be
transition metal oxides and conducting polymers [34].
In addition to an overview of the many types of electrochemical capacitors and how they store energy, this chapter presents an introduction to several popular electrolytic systems in use for electrochemical energy storage devices. As will be seen, there are several electrolytic systems that are available for electrochemical capacitors and the electrolyte chosen will determine the capabilities of the resulting device. Finally, this chapter concludes with a discussion of the effects of the porous electrode material on the device's behavior and the modeling of that behavior.
2.2 Electrode Discussion
2.2
Electrode Discussion
There are several materials to choose from when selecting an electrode bulk material. The choice of material will determine the dominant method of charge storage, and the device's power and energy density capabilities.
2.2.1 Carbonaceous Materials
Carbon electrode based double layer capacitors are one of the most common forms of the
DLC available on the market today. The dominant method of charge storage for this
electrode material is electrostatic at the electrode bulk/electrolyte interface. This form of capacitance is denoted as a double layer capacitance (Cdl), although, depending on the form of carbon used for this electrode, 1 - 5% of the total device capacitance may come from
redox charge storage mechanisms (pseudocapacitance, CO) [33].
Ctotai = Cdl + Co
Carbonaceous materials are an attractive material for electrochemical energy storage de-vices. The carbon is available in a variety of porous, high surface area forms, at a reasonably
low cost, and its physicochemical properties can be manipulated through various processing
(mechanical, thermal, and chemical) techniques. Once processed, the resulting carbon can have good electrical and thermal conductivity, and a high purity. Carbon also has a high resistance to corrosion, which is important when considering energy storage devices that often use a highly corrosive electrolytic solution. Other physical/characteristic features of some forms of carbon which are a product of the processing/treatment method used include: variable pore structure (size, shape), variable pore density, low thermal expansion, and low elasticity [35].
The form of carbon (carbon and carbon composites, which contain one or more metals) to use in electrochemical storage devices is a very important consideration when designing them. A variety of structures such as powder, fibers, thin solid sheet, and bulk carbon are available in addition to the large variety of types of carbons (activated carbon, carbon fibers, aerogels, microbeads, etc.) [32, 35, 36] . Figure 2.1 shows a carbon powder based electrochemical double layer capacitor. In the figure, the powder is shown as circular pellets (in reality, the powder will not be so uniform) that have a large surface area due to the activation process performed on the powder to increase its surface area.
Activated Carbon Powder Electrodes
Carbon Powder
Electrolyte
Figure 2.1: Carbon powder electrode DLC
Activated carbon (also known as activated charcoal) is typically a powder or granular struc-ture with a high degree of surface reactivity and a surface area of ~2000 m2/g. This form of carbon is often made by carbonization (a thermal process which forms tiny pore networks and creates certain functional surface groups) and chemical activation from such precursor material as nutshells (e.g., coconut shells), wood, phenol resin, pitch, and petroleum coke. Table 2.2 gives a comparison of surface area and pore volume for some common precursor materials [32, 36].
This enormous amount of surface area achievable by these materials is due to the extremely porous nature of the processed material. Imagine a granular piece of carbon or a single carbon fiber whose surface is covered in pores (of various sizes), the largest of which are "macropores" (with a diameter of >500
A)
and macropore-channels. Inside the macropores are yet smaller pores (the largest of these are called "mesopores" which measure 20 - 500A).
The process continues with "micropores" (8 -20
A)
next, followed by "sub-micropores" (<82.2 Electrode Discussion
Comparison of Raw Carbon Materials
Raw Material Surface Area (m2/g) Pore Volume (cm /g) Coconut shell 960 -2060 0.46 - 1.12
Phenol Resin 2100 - 2350 1.00 - 1.31
Petroleum coke 2600 - 3100 1.39 - 1.78
Table 2.2: Comparison of Raw Carbon Materials [36]
density. "Closed-pores" are pores that are created in the processing of the material that do not effect the overall surface area of the material (as the pores are completely isolated from the outside world; compare to swiss cheese), but do affect the measurable density of the material [35]. An increase in porosity of the processed material results in an increase in overall surface area, but the "effective" surface area only increases to a point. Eventually, the increase in overall surface area is due to the formation of micropores and sub-micropores. The effective surface area of the bulk material is determined by the surface area that the ions in the electrolyte are able to populate. An increased surface area due to pores that are smaller than the ions in the electrolyte does not increase the effective surface area of the material as the ions are not able to take advantage of (populate) this area. The capacitance due to double layer charge storage is typically in the range of 5-10 ptF/cm2. Given a material with a surface area of 1500 -2000 m2/g, the resulting specific capacitance should be approximately 300 - 400 F/g. However, due to the fraction of total surface area that cannot be populated, the resulting specific capacitance (which is dependent on the electrolyte used and the fraction of total surface area due to sub-micropores and micropores; i.e., the electrode's "effective" surface area) is found to be approximately 50 - 150 F/g
[34]. The size of the electrolyte ions varies depending on the type of electrolyte used, but typically, the diameter of the ions of an aqueous electrolyte are >20
A,
while the ions of an nonaqueous electrolyte are >50A
[35]. As electrostatic (non-Faradaic) charge storage is asurface phenomenon, the surface must be accessible to the electrons/ions. The inaccessible bulk material and the closed pores do not contribute to the storage mechanism.
The physicochemical properties (such as surface morphology, porosity of the bulk material, wetability of the surface, and electrical conductivity) of the carbon electrode can be ma-nipulated through complex processing procedures to yield the desired/optimized properties for electrochemical electrodes. These processes include thermal, mechanical, and chemical treatments.
The heat treatment of the electrode is often performed in an inert atmosphere. These processes have the ability to affect the surface area and porosity of the material, and to increase the electrical conductivity of the resulting electrode. The electrical conductivity is increased as the heat treatment decreases the oxygen surface groups by CO and CO2