HAL Id: hal-02148328
https://hal.archives-ouvertes.fr/hal-02148328
Submitted on 30 Nov 2020HAL is a multi-disciplinary open access
archive for the deposit and dissemination of sci-entific research documents, whether they are pub-lished or not. The documents may come from teaching and research institutions in France or abroad, or from public or private research centers.
L’archive ouverte pluridisciplinaire HAL, est destinée au dépôt et à la diffusion de documents scientifiques de niveau recherche, publiés ou non, émanant des établissements d’enseignement et de recherche français ou étrangers, des laboratoires publics ou privés.
Methanol oxidation in dry and humid air by dielectric
barrier discharge plasma combined with MnO2–CuO
based catalysts
Caroline Norsic, Jean-Michel Tatibouet, Catherine Batiot-Dupeyrat, Elodie
Fourré
To cite this version:
Caroline Norsic, Jean-Michel Tatibouet, Catherine Batiot-Dupeyrat, Elodie Fourré. Methanol oxida-tion in dry and humid air by dielectric barrier discharge plasma combined with MnO2–CuO based catalysts. Chemical Engineering Journal, Elsevier, 2018, 347, pp.944-952. �10.1016/j.cej.2018.04.065�. �hal-02148328�
1 Methanol oxidation in dry and humid air by dielectric barrier discharge plasma combined with 1
MnO2-CuO based catalysts
2
Caroline Norsica, Jean-Michel Tatibouëta, Catherine Batiot-Dupeyrata, Elodie Fourréa
3
a Institut de Chimie des Milieux et Matériaux de Poitiers (IC2MP), UMR CNRS 7285
4
Université de Poitiers, Ecole Nationale Supérieure d'Ingénieurs de Poitiers (ENSIP) 5
1, rue marcel Doré, TSA 41105, 86073 Poitiers cedex 9 (France) 6
Corresponding author: elodie.fourre@univ-poitiers.fr 7
Other authors: caroline.norsic@univ-orleans.fr 8 jean.michel.tatibouet@univ-poitiers.fr 9 Catherine.batiot.dupeyrat@univ-poitiers.fr 10 11 Keywords 12
Non thermal plasma, humidity, methanol, oxidation, metal oxide, TPR, ozone 13
Highlights 14
• Humidity in plasma alone enhanced CO2 selectivity
15
• 5% MnO2/5% CuO/Al2O3 balls catalyst presented the best activities
16
• Hydroperoxide species and/or adsorbed H2O2 more selective to CO2 formation
17
• High flow rate treatment of low pollutant concentration is achievable with scaling up 18
19
20
21
2 Abstract
1
Presence of humidity in polluted gas streams is a key parameter to give a realistic view of a 2
depollution process efficiency. With this in mind, the elimination of methanol by non thermal 3
plasma in presence of a MnO2-CuO based catalyst and 35 % relative humidity (20°C,
4
atmospheric pressure) was achieved. The reactor allows the treatment of low concentration 5
pollutants (25-200 ppm) at weak residence time (0.36s) in air at atmospheric pressure. Based 6
on conversion rate and CO2 selectivity, a 5 % MnO2/ 5 % CuO/ Al2O3 catalyst was selected
7
within an array of catalysts prepared by different impregnation methods with various metal 8
oxide ratios. The presence of humidity affected methanol conversion, ozone concentration and 9
selectivities to by-products. Beneficial effects of humidity were observed on by-products 10
elimination and CO2 selectivity despite a lower methanol conversion compared to dry air
11
conditions. 12
3 1. Introduction
1
Within the possible decontamination ways to clean gas exhaust, non thermal atmospheric 2
plasma (NTAP) is a renowned process, that does no longer need to prove its worth and has 3
been applied to the treatment of numerous polluted gases with a large diversity of reactor 4
configurations [1-3]. In fact, NTAP shows a high efficiency when treating effluents with low 5
concentration pollutants (ppm level). Within the diversity of species generated in an air 6
plasma, atomic oxygen, nitrogen and, in presence of humidity, OH radicals are produced. 7
These highly reactive species react with each other and with other molecules present in the 8
gas phase to generate ozone and trigger radical oxidation reactions if organic molecules such 9
as volatile organic compounds (VOC) are present. These oxidation processes allows the 10
elimination of pollutants present in air. However, NTAP suffers from several drawbacks such 11
as weak energy efficiency, mineralization and generation of ozone and nitrous oxides (NOx).
12
One way, which has been developed extensively, to overcome these disadvantages is by 13
placing a catalyst inside or post discharge. Depending on the VOC chemical structure, non-14
thermal plasma reactor layout and catalyst chemical nature, several conclusions were drawn in 15
respect of VOC removal efficiency (RE), ozone concentration, carbon mass balance (CMB), 16
by-products selectivites, specific energy or discharge behavior [4-14]. Treatment by non 17
thermal plasma alone succeeds in removing low concentration pollutants at low energy 18
consumption compared to conventional catalytic processes. However, the process is sensitive 19
to humidity and since it is non selective, unwanted by-products are generated (ozone, NOx,
20
amongst others depending on the pollutant). When a catalyst is placed in the plasma 21
discharge, and depending of its chemical nature, a synergistic effect is observed leading to 22
high removal efficiencies. In post plasma configuration, it improves the oxidation reactions by 23
ozone activation leading to higher carbon oxides (COx) selectivities and low residual ozone
24
concentration. 25
4 Additionally, it is difficult to dissociate humidity levels from gas emission when controlling 1
the levels of contaminated air flows, under real operating conditions, arising either from 2
industrial or household environments. When treatment of polluted gas is considered, either via 3
classical (thermal, catalytic oxidation, adsorption…) or slightly more unconventional ways 4
(such as non thermal plasma, photocatalysis...), water should be taken into account, as it will 5
affect the reaction selectivities and efficiencies. 6
In a plasma alone configuration, when no catalyst was present in the discharge or post 7
discharge, opposite effects were observed depending on the relative humidity (RH) 8
percentages present in the gas stream [4, 7, 12, 13]. In a low humid environment, the 9
formation of highly oxidative hydroxyl radicals (•OH) increases due to the dissociation of 10
water molecules by impact with electrons or oxygen radicals, O(1D). Ono and Oda [15] 11
measured the •OH concentration as a function of humidity and observed a maximum [•OH] at 12
RH < 1 % in a pulsed corona discharge. In the case of toluene elimination [4], since •OH 13
radicals have the highest reaction rate coefficient (k = 5.7 x 10⁻¹² molecule cm-3.s-1) within the
14
group of plasma oxidizing species (for atomic oxygen k = 7.6 x 10⁻¹⁴ molecule cm-3.s-1 and 15
ozone k = 3.9 x 10⁻²² molecule cm-3.s-1), an increase of the VOC removal efficiency was 16
observed. Depending on the type of plasma reactor and pollutant treated, a positive effect on 17
the removal efficiency (RE) was detected with fairly different RH contents. Lock et al. [12] 18
observed an increase of the RE with RH up to 2 % in a corona reactor for methanol and 19
dimethyl sulfide elimination. Regarding the treatment of toluene effluent, the limit was drawn 20
at 0.2 % (mol %) in a dielectric barrier discharge (DBD) wire plate reactor [13], 26 % in a 21
direct current (DC) positive corona discharge [4]. Surprisingly, Karatum et al. [7] showed that 22
a RH of 30 % did not alter the RE of ethylbenzene in a volumic cylindrical DBD. 23
However, removal efficiencies and ozone concentrations are decreasing when the relative 24
humidity exceeds the values cited above, independently of the reactor configuration or VOC. 25
5 Several arguments were given to explain this phenomena. Water content has a strong impact 1
on the plasma discharge electronic density. Excess humidity limits the current at constant 2
applied voltage due to the modification of dielectric’s surface resistance and reduces the 3
transferred charges between the electrodes and thus reducing of the volume of plasma [14]. 4
Additionally, a reduction of highly energetic electrons concentration was observed due to 5
their inelastic collisions with water molecules [15]. These arguments were confirmed by other 6
authors such as Van Durme et al. [4]. They reported that toluene abatement, in a plasma alone 7
configuration, was enhanced in presence of relatively low RH contents (25 - 27 %). However, 8
at higher humidity levels (50 %), this effect was impeded by the reduction of the plasma 9
electric field and mobility of charge carriers in presence of water, thus altering the discharge 10
chemical composition [4, 16]. If the advantage of increasing •OH radical content with low 11
humidity levels improved the removal efficiency, this effect was counteracted at higher RH 12
due to the decrease of the number of microdischarges, especially for VOCs that can be 13
directly decomposed by electronic impact. Furthermore, the ozone formation in the plasma 14
discharge was reduced under the influence of humidity. O (1D) radicals (from O2 dissociation)
15
reacts with H2O to produce •OH radicals. The H• radicals issued from water dissociation can
16
also account for the increased HO2 formation. The resulting H•, •OH and •HO2 are responsible
17
for the decrease of ozone concentration. These radicals react with ozone to form O2 [4, 17,
18
18]. By-products, COx selectivities and carbon balance were also modified by the RH. If
19
water showed a negative effect on the RE, it improved by-products oxidation, carbon balance 20
and COx selectivities [12, 13, 19].
21
When a catalyst is combined to the plasma under humid conditions, in plasma or post plasma, 22
a decrease of the VOC removal efficiency was observed, independently of reactor type or 23
VOC chemical structure [5, 6, 8–11, 18]. The beneficial effect of the catalyst was hindered by 24
surface coverage with water molecules thus limiting access to active sites [6, 8, 18–20]. 25
6 Sivachandiran et al. [8] reported a very detailed study on the effect of humidity on
1
isopropanol adsorption on TiO2 surface and its ensuing non thermal plasma treatment. They
2
showed that isopropanol adsorption was affected by humidity in different ways according to 3
the RH level. Below 35 %, a decrease of adsorption was observed with increasing RH due to 4
the competition between water and VOC for adsorption on surface sites. Above 35 %, the 5
decrease of adsorption with RH was also observed with an increase of irreversible isopropanol 6
adsorption. It was suggested that above 35 % humidity level the surface is covered by one 7
monolayer of water [21] and the irreversible adsorption could be partially due to solvated IPA 8
isopropanol. Under plasma treatment, the RH content improved isopropanol desorption due to 9
the rehydroxylation of the catalyst surface by •OH radical and ensuing swap of isopropanol 10
molecules to OH. If dichloromethane and toluene contaminated effluents encountered a more 11
or less important drop in their conversion in presence of water (2 mol % ), it was surprising 12
that methanol (CH3OH) was almost not affected by water content in a ferroelectric packed
13
bed reactor (FPR) containing BaTiO3 pellets [9]. Conclusions were drawn on the basis that the
14
plasma treatment activated directly CH3OH which converted rapidly into formaldehyde then
15
to CO, with little H2O contribution. Regarding the enhanced selectivity to CO2 in presence of
16
water, a direct transformation of intermediates to CO2, and not from CO oxidation was
17
proposed. Selectivites to CO2 and carbon balance were enhanced in presence of a catalyst in
18
18 % humidity for TCE abatement as shown by Dinh et al. [19], in over 35 % RH for IPA 19
elimination [8], 2% RH for dichloromethane, toluene and methanol [9]. 20
It appears from all these studies that humidity presents contradictory effects regarding the 21
VOC conversion, ozone concentration and selectivities of chemical reactions, depending on 22
the VOC nature and plasma reactor configuration with or without a catalyst. A statement 23
found in every publication, although, is the decrease of pollutant removal efficiency at high 24
humidity levels (>30 %) due to 3 major factors: 1- decrease of the electronic density of the 25
7 plasma discharge thus decreasing the active species energy and concentration; 2- surface 1
coverage of the catalyst by water molecules reducing the adsorption process of pollutant and 2
active sites availability; 3- reduction of the ozone concentration, strong oxidant in catalytic 3
process. Increased •OH radical concentration, despite its high reactivity, cannot supplant, in 4
many cases, the loss of reactivity. 5
This work is in the continuity of a study started on methanol elimination by non thermal 6
plasma combined to catalysis at atmospheric pressure, in dry air conditions [22]. The effect of 7
humidity on the methanol conversion, by products selectivities and ozone concentration is 8
investigated. A high level of relative humidity is chosen, 35 % as it is representative of indoor 9
air levels. The plasma reactor was then associated to MnO2 and CuO/MnO2 based catalysts
10
placed in post discharge and the effect of the catalyst metal oxide ratio, preparation method 11
and methanol initial concentration were evaluated. 12
2. Experimental 13
2.1. Plasma reactor configuration 14
The NTAP reactor consisted in a surface dielectric barrier discharge (DBD) reactor. Two 15
electrodes (one copper comb and one copper plate stuck on the glass plate) were separated 16
from each other by a 2 mm thick glass plate acting as a dielectric barrier. Details of the reactor 17
and experimental setup can be found in [22]. 4g of catalyst were placed in the post discharge 18
(PP) area in a 1.6 cm inner diameter glass tube. The space occupied by the catalyst was 4.1 19
cm which corresponded to a residence time in the catalytic reactor of 100 ms. The NTAP 20
feeding gas was provided by an evaporating system (Serv’Instrumentation) with controlled 21
pollutant concentrations. The gas flow rate was kept constant (5 L.min-1, residence time in 22
plasma alone: 0.36 s), whereas the methanol concentration could be varied from 25 to 200 23
ppmv. The presence of a manometer on the set-up allowed the control of the pressure drop. 24
8 Thanks to the structure of the catalyst support, consisting of alumina balls of 2 mm diameter, 1
the system remained at atmospheric pressure. The water vapor was controlled by a humidity 2
transmitter (Vaisala HTM330) with a constant content of 35 % RH which roughly 3
corresponded to 8050 ppmv at 20°C. 4
5
Figure 1: Experimental set-up. 6
2.2. Catalyst preparation 7
The section detailing the catalyst preparation can be found in [22]. Briefly, a solution of 8
Mn(NO3)2.4H2O was mixed with 2 mm alumina balls and stirred for 4 hours in a rotary
9
evaporator under reduced pressure. The catalyst was dried at 110 °C and calcined at 300 °C. 10
The volume of precursor salt solution and weight of alumina were adjusted for a metal 11
loading of 5 wt. %. 12
The mixed oxides of CuO/MnO2 were prepared by successive impregnation of alumina balls
13
by Mn or Cu nitrate solutions, separated by drying at 110 °C and calcinations at 300 °C as 14
previously described for single metal oxide catalyst. Two procedures have been used 15
according to the order of processing (copper first or manganese first). Metal content and 16
catalysts characterizations are gathered in Table 1. 17
9 Table 1: Metal oxide content (theoretical and measured from ICP1), BET1, support nature and 1
preparation methods of the catalysts. 2 Catalyst name* CuO content (wt. %) MnO2 content (wt. %)
SBET (m2.g-1) ICP (oxide
wt.%) Mn/Al 0 5 179 5.0 Cu/Al 5 0 197 3.9 SI-5Cu-5Mn 5 5 186 3.7 CuO 4.0 MnO2 SI-5Mn-5Cu 5 5 187 4.0 CuO 4.2 MnO2 CI-5Cu5Mn 5 5 191 3.7 CuO 4.2 MnO2 SI-25Cu-75Mn 2.5 7.5 186 2.5 CuO 7.4 MnO2 SI-75Cu-25Mn 7.5 2.5 194 7.6 CuO 2.5 MnO2
*SI: successive impregnation; CI: co-impregnation. The metal is cited in the order of 3
impregnation. For example, Si-5Cu-5Mn corresponds to a catalyst prepared by successive 4
impregnation of copper followed by manganese.1Explained in the following section 5
6
2.3. Analytical methods 7
The energy density of the discharge was set at 20 J.L-1 and its calculation is issued from the
8
Manley method [23]. This method has been used in many reported studies. It links the voltage 9
between the electrodes, U, to the charge Q (measured via a capacitor placed in series) of the 10
system. The plot of these series of data results in the so-called Lissajous curve whose 11
integration leads to the energy per cycle (Ec) transferred through the gas. The discharge power
12
(P) is obtained by multiplying the frequency (f) to the energy Ec. Dividing the power (P) by
13
the gas flow rate (Q) results in the energy density, Ed (equation 1), which is a recurrent
14
measure to compare plasma processes [22, 24]. 15
10 𝐸𝑑 (𝐽. 𝐿−1) = 𝑃 (𝑊𝑎𝑡𝑡)
𝑄 (𝐿. 𝑠−1)
1
The specific surface area of the samples was measured by the Brunauer–Emmett–Teller 2
(BET) method after calcination of the catalyst at 400 °C. The metal loading was measured by 3
inductively coupled plasma optical emission spectrometry (ICP-OES). The catalysts were also 4
characterized by hydrogen temperature programmed reduction (H2-TPR) [22].
5
Methanol conversion, X (%) and by-products selectivities, S (%) were calculated as follow: 6
𝑋(%) =[𝑋]0−[𝑋]
[𝑋]0 7
with [X]0 = input methanol concentration and [X] = ouput methanol concentration
8 9 𝑆𝑥(%) = [𝑅].(𝑛𝑢𝑚𝑏𝑒𝑟 𝑜𝑓 𝐶𝑎𝑟𝑏𝑜𝑛 𝑜𝑓 𝑅)[𝑋] 0−[𝑋] × 100 10
with [R] output concentration of product R 11
All the experiments were repeated 3 times and standard deviation of ±2 % was estimated. An 12
ozone analyzer (ES, Dualbeam 205) allowed the online measurement of the ozone upstream 13
and downstream the catalyst bed. 14
X-Ray diffraction pattern were obtained from a Siemens D5005 diffractometer using the 15
KCu1 = 1.5406 Å. The 2 data within the 0° and 90° with a step size of 0.08° and an
16
integration time of 90s per step. Unfortunately, the structural characterization by XRD was 17
not usable. XRD diffraction lines of the catalysts show only alumina lines suggesting that 18
either the amount of oxides is too low to obtain a visible diffraction pattern or the oxides are 19
mainly amorphous. 20
21
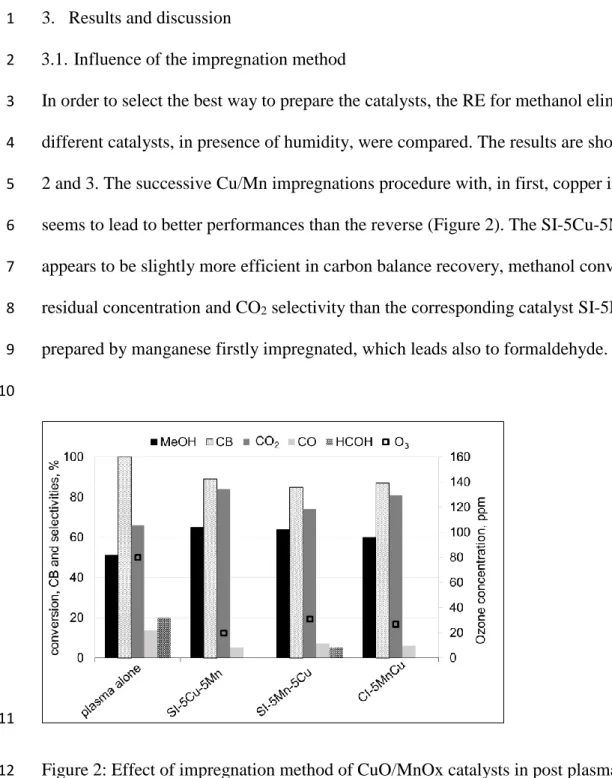
11 3. Results and discussion
1
3.1. Influence of the impregnation method 2
In order to select the best way to prepare the catalysts, the RE for methanol elimination of the 3
different catalysts, in presence of humidity, were compared. The results are shown in Figures 4
2 and 3. The successive Cu/Mn impregnations procedure with, in first, copper impregnation 5
seems to lead to better performances than the reverse (Figure 2). The SI-5Cu-5Mn catalyst 6
appears to be slightly more efficient in carbon balance recovery, methanol conversion, ozone 7
residual concentration and CO2 selectivity than the corresponding catalyst SI-5Mn-5Cu
8
prepared by manganese firstly impregnated, which leads also to formaldehyde. 9
10
11
Figure 2: Effect of impregnation method of CuO/MnOx catalysts in post plasma configuration 12
on methanol conversion, carbon balance, ozone concentration and selectivities to secondary 13
products. Conditions: 20 J.L-1, 50 ppm methanol, 35 % RH. 14
The oxidation state of manganese cations were characterized by temperature programmed 15
reduction (Figure 3). The TPR profile of the sample prepared by copper first impregnation 16
shows a single reduction peak centered at 250-280 °C, whereas the sample prepared by 17
manganese first impregnation shows two reduction peaks at 250-300°C and 350-380 °C. 18
12 1
Figure 3 : TPR profiles of the catalysts with different impregnation methods: SI-5Cu-5Mn, 2
SI-5Mn-5Cu and CI-5Cu-5Mn. 3
According to the total H2 uptake experimental values, it is possible to estimate the respective
4
percentages of MnIV and MnIII for each sample by assuming the total reduction of copper (CuIIO 5
+ H2 Cu° + H2O) and the reduction of manganese species to MnII (MnIVO2 + H2 MnIIO +
6
H2O and MnIIIO1.5 + 1/2H2 MnIIO + 1/2H2O). The results are gathered in Table 2.
7
8
Table 2: Hydrogen consumption for the oxide reduction (cm3 H
2/g ± 5 %) STP. 9 SI-25Cu-75Mn SI- 5Cu-5Mn SI-75Cu-25Mn
SI-5Mn-5Cu CI-5Cu5Mn Mn/Al
Mn (wt%) 4.7 2.5 1.6 2.7 2.7 3.2
13
Vexp(cm3H2/g) 19.1 18.7 29.6 23.8 19.8 13.7
%MnIV 13 37 93 100 49 99
%MnIII 87 63 7 ≈0 51 1
Cu/Mn at. ratio 0.37 1.04 3.3 1.02 0.96 -
1
It appears that the sample prepared by manganese first impregnation contains only MnIV, 2
whereas the sample prepared by copper impregnation first contains mainly MnIII. The two peaks
3
profile of SI-5Mn-5Cu sample could then be explained by the reduction of CuII to Cu° and MnIV 4
to MnIII for the peak at the lowest temperature and to the reduction of MnIII to MnII for the 5
highest one. The reduction profile of the SI-5Cu-5Mn sample which presents a single peak at 6
low temperature could suggest that a strong interaction exists between copper and manganese 7
increasing the reducibility of MnIII [25].
8
By varying the Cu/Mn atomic ratio, it appears that the percentage of MnIV increases with the 9
copper content for the samples prepared by successive impregnation with copper first. 10
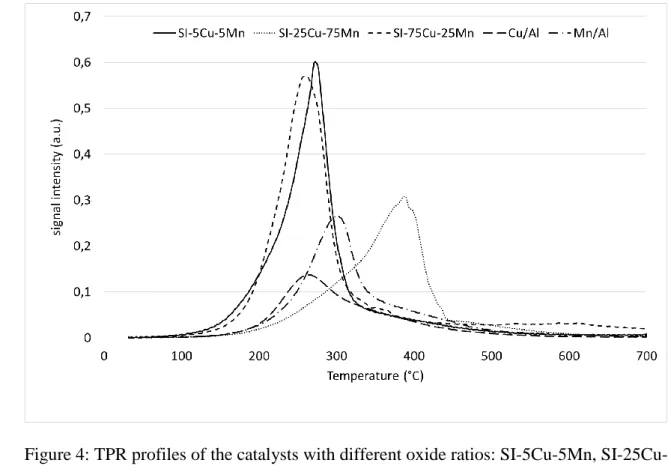
The TPR profiles of the samples prepared by copper first impregnation are shown on Figure 4 11
along with profiles of manganese and copper oxides alone. 12
14 1
Figure 4: TPR profiles of the catalysts with different oxide ratios: SI-5Cu-5Mn, SI-25Cu-2
75Mn, SI-75Cu-25Mn, Mn/Al and Cu/Al. 3
4
For the Cu/Mn atomic ratio higher than 1, the reduction behavior is similar to single oxides, 5
with the presence of only one reduction peak at low temperature. However, for the lowest ratio 6
(Cu/Mn = 0.37) a single peak is also observed but at higher temperature (380-400°C) and could 7
indicate the formation of a defined compound more stable than single oxides of copper and 8
manganese. This compound could be a copper manganese spinel (CuMn2O4) for the lowest
9
Cu/Mn atomic ratio which is destabilized when the copper content increases [26]. The MnO2
10
catalyst (Mn/Al) profile (Figure 4), as described in our previous publication, shows a main 11
reduction peak at 300°C and a small shoulder between 350-480°C, resulting from the reduction 12
of MnO2 to Mn2O3/Mn3O4 then MnO [27] or from the reduction of Mn5O8 to Mn3O4 then MnO
13
as observed by Ye and al. [25]. 14
It was demonstrated that copper addition tends to maintain MnO2 oxide phase, while higher
15
manganese oxide content leads to Mn2O3 phase, hindering the copper oxide effect [28].
15 It was suggested, in the case of mixed oxides, that the activity depends on the redox couple 1
Mn3+ + Cu2+ Mn4+ + Cu+ [29] which could be present on manganese copper spinel structure 2
(Mn3+ oxidation state). We can expect that the highest interactions between copper and 3
manganese cations lead to the highest catalytic activity, as observed for the SI-5Cu-5Mn and 4
SI-25Cu-75Mn catalysts. To notice, these samples contain mainly manganese as MnIII (Table
5
2). The MnO2 catalyst (Mn/Al) profile (Figure 4), as described in our previous publication,
6
shows a main reduction peak at 300°C and a small shoulder between 350-480°C, resulting from 7
the reduction of MnO2 to Mn2O3/Mn3O4 then MnO [27] or from the reduction of Mn5O8 to
8
Mn3O4 then MnO as observed by Ye and al. [25].
9
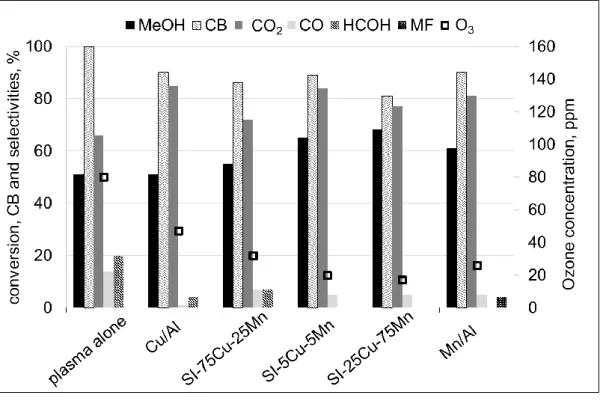
The percentage of loaded metal oxide was also evaluated in terms of methanol RE (Figure 5). 10
It appeared that the ozone degradation is dependent on the percentage of loaded manganese 11
resulting in only 17 ppm left after one passage over SI-25Cu-75Mn, while it remains at 12
32ppm over SI-75Cu-25Mn. Methanol conversion increases as a function of ozone 13
degradation, indicating a reaction in which the plasma oxidizing species (O•, •OH, •HO2)are
14
given first place for methanol conversion. As specified above, Cu/Mn redox couple and MnO2
15
phase availability are responsible of ozone degradation into oxidizing species. Only little 16
effect is observed on the carbon balance between the different metal oxide ratios which 17
remains close to 90% except SI-25Cu-75Mn that drops at 80 %. The drop in carbon balance 18
could be related to formic acid formation. 19
16 1
Figure 5: Effect of metal oxide ratio of MnO2/CuO catalysts placed in post plasma
2
configuration on methanol conversion, ozone concentration and selectivities to secondary 3
products: HCOH; MF: methyl formate. Conditions: 20J.L-1, 50 ppm methanol, 35% humidity. 4
According to the fair methanol RE, carbon balance and selectivity to by-products (especially 5
to CO2), the catalyst prepared via successive impregnation with CuO first, SI-5Cu-5Mn, was
6
chosen as reference catalyst and further investigated. 7
8
4. Influence of humidity 9
4.1. Effect of humidity in plasma alone configuration 10
The addition of 35 % relative humidity in the gas flow led to a decrease of the methanol 11
conversion, from 60 % to 43% and ozone concentration (160 ppm to 75 ppm) but did not 12
affect the carbon balance of the reaction which remained close to 100% (Figure 6). 13
17 1
Figure 6: Effect of water on methanol conversion, ozone concentration and selectivities to 2
secondary products: HCOH; ML: methylal; MF: methyl formate. Conditions: 20J.L-1, 50 ppm 3
methanol. 4
When looking at the by-products selectivities, the presence of humidity improves the 5
selectivity of the reaction to carbon dioxide rather than CO, slightly affects formaldehyde 6
(HCOH), while neither methyl formate (MF) nor methylal (M) are detected. These effects 7
were observed by different authors [4–8, 10]. They have postulated that the presence of 8
relatively low humidity levels increases the concentration of •OH radicals that can enhance 9
the chemical reactivity. Concomitantly, the lower ozone production could be due to its 10
reaction with H•, •OH and •HO2 arising from water dissociation and/or from the succession of
11
reactions involving O and •OH. According to thermodynamic data (Ref. NIST), the reaction 12
of H2O with O radical leads to the formation of hydrogen peroxide rather than direct •OH
13
radical formation since an estimation of the value of the variation of Gibbs energy at 300K 14
(G) shows that the only reaction between water and O with G < O is the formation of 15
hydrogen peroxide (Table 3). Moreover, the further reactions between hydrogen peroxide and 16
O or •OH radicals are thermodynamically favored and lead to the formation of •OH and •HO2
18 which are highly oxidative species. It means that the •OH and •HO2 generation occurs most
1
probably by hydrogen peroxide secondary reactions rather than by water dissociation or direct 2
reaction of O radical with water. 3
Table 3: Thermodynamic data. 4 Product H°f (kJ/mol) S° 300K (J/mol.K) H2O2 -136.1 239.9 H2O -241.8 188.8 °HO +39.0 183.7 °HO2 +2.1 229.1 O° +249.2 161.1 5 H2O + O H2O2 H = -143.5 kJ/mol; G = -108.4 kJ/mol 6 H2O + O 2 •OH H = + 70.6 kJ/mol; G = + 65.4 kJ/mol 7 H2O2 2 •OH H = + 214.1 kJ/mol; G = + 175.9 kJ/mol 8 H2O2 + O •HO2 + •HO H = - 72.0 kJ/mol; G = -75.5 kJ/mol 9 H2O2 + •OH H2O + •HO2 H = - 142.6 kJ/mol; G = -140.9 kJ/mol 10 11
Moreover, the VOC conversion and ozone concentration were reduced at high humidity levels 12
(level depending on plasma discharge type) due to the modification of the discharge electric 13
field, leading to a decrease of reactive plasma volume and chemical species [14]. Regarding 14
by-products selectivity, the affinity of formaldehyde to water would favor its direct 15
transformation into CO2 at the expense of CO, according to Sugasawa [9]. The total oxidation
16
of methyl formate and methylal under humid flow contributes to the improved CO2
17
selectivity. 18
19 4.2. Effect of humidity in presence of a post plasma (PP) catalyst
1
As already observed in our previous publication [22], and from the results cited above, a 5 % 2
MnO2/5 % CuO/Al2O3 catalyst presented some of the best activities, such as methanol
3
conversion or ozone degradation, that swayed our catalyst choice to SI-5Cu-5Mn in the study 4
of the humidity impact on methanol elimination efficiency. In order to evaluate the efficiency 5
in presence of a catalyst in post-plasma location, 4 g of SI-5Cu-5Mn catalyst were placed 6
immediately after the plasma reactor in a specific catalytic reactor. 7
In dry conditions, when 4 g of catalyst were placed in post plasma, the methanol conversion 8
and carbon balance were close to 100 % with only formation of carbon oxides (CO = 43 %; 9
CO2 = 55 %) for the plasma and catalyst reactors connected in series. In presence of humidity
10
(RH = 35 % corresponding to about 8000 ppmv) a large decrease in conversion was observed. 11
The methanol total conversion decreased from 100 % to 65 % and the carbon balance from 12
99 % to 89 %, but the CO2 selectivity increased to 83 %, with only 6 % of CO. The most
13
significant effect concerned ozone exiting the plasma reactor which decreased from 160 ppmv 14
in dry conditions to 74 ppmv under 35% of RH. 15
On the catalyst, the ozone consumption reached 148 ppmv in dry conditions (ozone 16
conversion=92.5%) and only 54 ppmv in presence of humidity (ozone conversion = 73 %). 17
The residual ozone concentration is higher in presence of humidity (20 ppmv) than in dry 18
conditions (12 ppmv) despite a lower initial concentration entering the catalyst reactor (75 19
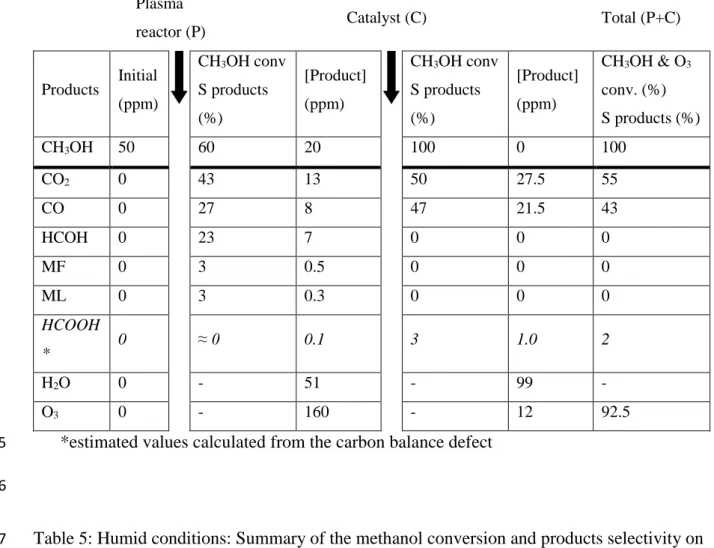
ppm in humid vs 160 ppm in dry conditions). The results are gathered in Tables 4 and 5. On 20
the same tables, the calculation of conversions and selectivities are done according to the 21
consumption of methanol for the plasma reactor and to the sum of the consumptions of all the 22
products for the catalyst reactor, taking into account the carbon number for methyl formate 23
and methylal. 24
20 For example, in dry conditions (Table 4) the consumption of the products appears to be 20 1
ppm for methanol, 7 ppm for formaldehyde, 0.5 ppm for methyl formate (corrected to 1 ppm), 2
0.3 ppm for methylal (corrected to 0.9 ppm) and 0.1 ppm for formic acid, leading to a total 3
consumption of 29 ppm. The value of formic acid formation (formic acid is not detected but 4
its formation is expected according to the possible reaction of oxidation of methanol) is 5
estimated from the carbon balance defect. The CO2 (50%) and CO (47%) selectivities are then
6
calculated as the ratio between their increased concentration through the catalyst reactor (14.5 7
ppm for CO2 and 13.5 ppm for CO) and the sum of the products consumption (29 ppm).
8
According to our calculations it appears that the methanol conversion on the catalyst is higher 9
in dry (or pseudo-dry conditions since 51 ppm of water are produced in the plasma reactor 10
due to the methanol oxidation), than in humid conditions in presence of more than 8000 ppm 11
of water, but the selectivity to CO2 is lower (50%) in dry conditions compared to 82% in
12
humid conditions without CO formation. In dry conditions, the selectivity to CO is 47%. 13
This surprising effect could be correlated with the possible mechanism of ozone and water 14
reaction on the manganese oxide surface. It is well admitted that ozone reacts with manganese 15
surface cations to form Mn-O- or Mn-OO- surface species [30]. In presence of water the 16
reaction of ozone on the catalyst surface was partly inhibited due to the water adsorption on 17
the manganese active sites [31, 32]. A mechanism was proposed by Zhu et al. [33] for the 18
reaction of ozone decomposition on manganese oxide in presence of gaseous water. It consists 19
of the slow reaction of ozone on adsorbed water leading to the formation, at the catalyst 20
surface, of hydroxyl species on which further ozone molecules can react to form 21
hydroperoxide species and peroxide species. Nevertheless, the possible formation of hydrogen 22
peroxide cannot be excluded from direct reaction between Mn-O species and water from the 23
gas phase leading to the formation of surface hydroxyl species on which ozone can react [33] 24
21 (Scheme 1) blocking partially the ozone elimination cycle, but allowing the formation of the 1
highly oxidative hydroperoxide species. 2
3
4
Scheme 1: Pathway of ozone elimination in presence of water [33] 5
According to this hypothesis, the formic acid formation estimated from the carbon balance 6
defect could result from formaldehyde oxidation by H2O2 or •OH [17]:
7 HCOH + H2O2 HCOOH + H2O 8 HCOH + •OH HCOOH + H• 9 10 11 12 13 14 15
Mn□
O
3H
2O
Mn(H
2O)
O
3Mn(OOH) + Mn-O-O
Mn□ + CO
2, H
2O
Mn-O + O
2O
3Mn-O-O + O
2Mn□ + O
2fast
slow
Mn(H
2O
2)
CH
3OH
H
2O
CH
3OH
X
22 Table 4: Dry conditions: Summary of the methanol conversion and products selectivity on 1
plasma and catalyst reactors and products concentration after plasma and catalyst reactors. “S 2
product”: selectivity to products. (Experimental conditions: 20 J.L-1, catalyst = 4 g, total flow
3
rate = 5 L.min-1).
4
Plasma
reactor (P) Catalyst (C) Total (P+C)
Products Initial (ppm) CH3OH conv S products (%) [Product] (ppm) CH3OH conv S products (%) [Product] (ppm) CH3OH & O3 conv. (%) S products (%) CH3OH 50 60 20 100 0 100 CO2 0 43 13 50 27.5 55 CO 0 27 8 47 21.5 43 HCOH 0 23 7 0 0 0 MF 0 3 0.5 0 0 0 ML 0 3 0.3 0 0 0 HCOOH * 0 ≈ 0 0.1 3 1.0 2 H2O 0 - 51 - 99 - O3 0 - 160 - 12 92.5
*estimated values calculated from the carbon balance defect 5
6
Table 5: Humid conditions: Summary of the methanol conversion and products selectivity on 7
plasma and catalyst reactors and products concentration after plasma and catalyst reactors. 8
(Experimental conditions: 20 J.L-1, catalyst = 4 g, total flow rate = 5 L.min-1). 9
Plasma
reactor (P) Catalyst (C) Total (P+C)
Products Initial (ppm) CH3OH conv S products (%) [Product] (ppm) CH3OH conv S products (%) [Product] (ppm) CH3OH & O3 conv. (%) S products (%) CH3OH 50 45 27.5 36 17.5 65 CO2 0 60 13.5 82 27 83
23 CO 0 18 4 0 2 6 HCOH 0 20 4.5 0 0 0 MF 0 0 0 0 0 0 ML 0 0 0 0 0 0 HCOOH * 0 2 0.5 18 3.5 11 H2O >8000 - >8000 - >8000 - O3 0 - 74 - 20 73
*estimated values calculated from the carbon balance defect 1
2
4.3. Reactivity as a function of methanol concentration in humid reaction conditions 3
We have already shown [22] that in dry reaction conditions, a strong influence on reaction 4
behavior occurs when the initial methanol concentrations change. The influence of humidity 5
(RH = 35 %) on the reaction behavior was evaluated as a function of initial methanol 6
concentration, both in plasma alone and with the catalytic reactor. The methanol initial 7
concentration was varied from 25 to 200 ppmv and in post plasma catalytic configuration, 4 g 8
of the reference catalyst SI-5Cu-5Mn was used. 9
The results are gathered in Figures 7, 8 and on Tables 6 and 7. 10
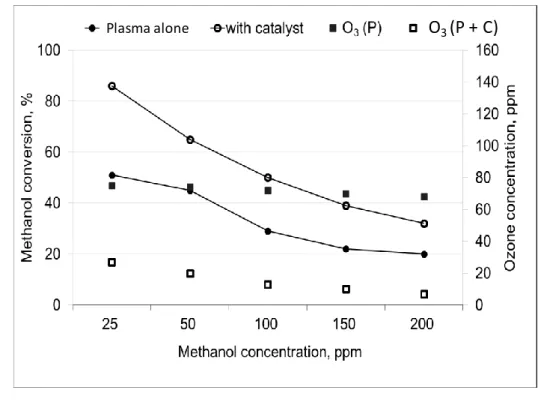
24 1
Figure 7: Effect of methanol initial concentration on methanol conversion and ozone 2
concentration in single plasma and with 4g of SI5Cu-5Mn catalyst in post plasma. 3
4
Table 6: Methanol conversion and concentration after plasma alone (P), plasma + catalyst (P 5
+ C) and catalyst alone (C) with ozone consumption (experimental and calculated from 6
observed products formation). 7 [MeOH]° (ppmv) (1) [MeOH] After plasma (ppmv) (2) MeOH transformed by plasma (ppmv) (3) [MeOH] After catalyst (ppmv) (4) MeOH transformed (P + C) (ppmv) (5) Conv. MeOH (P) (%) (6) Conv. MeOH (C) (%) (7) Conv. MeOH (P+C) (%) (8) [O3]° After plasma (ppmv) (9) [O3] After catalyst (ppmv) (10) O3 (exp.) consumption on catalyst (ppmv) (11) O3 (th.) consumption on catalyst (ppmv) (12) 25 12.3 12.7 3.5 21.5 51 71 86 75 27 48 31 50 27.5 22.5 17.5 32.5 45 36 65 74 20 54 39 100 71 29 50 50 29 30 50 72 13 59 68 150 117 33 91.5 58.5 22 22 39 70 10 60 70 200 160 40 136 64 20 15 32 68 7 61 67 8 9 10 Plasma alone O3 (P + C)
25 Table 7: Methanol and products transformation on the catalyst SI-5Cu-5Mn as a function of the 1
methanol concentration at the entrance of the catalytic reactor. 2 (1) MeOH at the entrance of the catalyst (ppmv) (2) MeOH transformed on the catalyst (ppmv) (3) CO2 formation on the catalyst (ppmv) (4) CO transformed on the catalyst (ppmv) (5) CO2 from total oxidation of MeOH and HCOH (ppmv) (6) HCOH transformed on the catalyst (ppmv) (7) Selectivity to CO2 for MeOH and HCOH oxidation (%) (8) Carbon balance defect (ppmv) (9) Ratio . [O3]° . ([MeOH]+[HCOH]) 12.3 8.8 10.8 0.7 10.1 2.4 90 1.1 5.1 27.5 10.0 13.8 2.7 11.1 4.5 77 3.6 2.3 71 21.0 18.1 3.2 14.9 8.4 51 14.0 0.9 117 25.5 11.9 3.5 8.4 8.6 25 24.6 0.5 160 24.0 7.2 6.4 0.8 11.6 2 33.9 0.4 3
In plasma alone and at constant input specific energy (20 J.L-1) the methanol conversion
4
decreases with the increase of initial concentration, as already observed. Nevertheless the total 5
amount of methanol transformed increases with the methanol initial concentration and the 6
formaldehyde formation increases to the detriment of CO2 formation (Figure 8).
7 8 9 10 11 12
Figure 8: Effect of methanol initial concentration on carbon balance and selectivities to 13
secondary products: CO, CO2, HCOH; ML: methylal; MF: methyl formate a) in plasma alone
14
and b) with 4g of SI-5Cu-5Mn in post plasma. Conditions: 20J.L-1, 35% humidity. 15
16
On the catalyst, the amount of methanol transformed (Table 7 (2)) increases with the 17
concentration of methanol at the entrance of catalyst reactor and seems to reach a plateau for 18
26 a concentration higher than 71 ppmv, similarly to ozone consumption (Table 6 (11)).
1
Regarding the CO2 formation (Table 7 (3)), it goes through a maximum and then decreases
2
for methanol initial concentration higher than 71 ppmv. From the data collected at the 3
entrance and at the exit of the catalytic reactor, it is possible to estimate the amount of the 4
products (CO and HCOH) transformed on the catalyst. Additionally, it is possible to estimate 5
the concentration of CO2 formed on the catalyst coming from methanol and formaldehyde
6
total oxidation. The results obtained by subtracting the CO transformed on the catalyst (the 7
only oxidation product of CO being CO2) to the CO2 formed on the catalyst (column (3) –
8
column (4)) are plotted on column (5) of the Table 7. It shows that the amount of CO2 from
9
the total oxidation of methanol and formaldehyde (VOC products) depends of the ratio 10
between VOC products and ozone (Table 7 column (9)). The selectivity to CO2 from total
11
oxidation of methanol and formaldehyde decreases from 90% to only 2% when the ratio 12
between VOC and ozone decreases from 5.1 to 0.4. Simultaneously, the carbon balance 13
defect (Table 7 (8)), which indicates the formation of undetected product, expected to be 14
formic acid, [34, 35], increases from 1.1 to 33.9 ppmv. This behavior is consistent with the 15
usual reaction mechanism of partial methanol oxidation involving successive reaction [34, 16
35]: 17
18
19
Scheme 1: Partial oxidation of methanol. 20
21
In dry conditions, the higher ozone concentration on the catalyst could favor the 22
formaldehyde and formic acid oxidation to carbon oxides, whereas in presence of water, 23
CH
3OH CH
2O
(HCOOH)
CO
2H2O2or O* H2O2or O* H2O2or O*
27 either the lower ozone concentration or the presence of hydrogen peroxide resulting of the 1
reaction of activated oxygen species from ozone with water could favor the formation of 2
formic acid instead of the total oxidation of formaldehyde. 3
4
5. Conclusion 5
Under humid conditions (37 % RH), close to ambient air concentrations, and at low energy 6
density (20J.L-1), non thermal plasma treatment of methanol affects the conversion rate 7
compared to dry air but improves largely the CO2 selectivity in presence of a CuO-MnO2
8
based catalyst in post plasma configuration. Additionally, selectivities to secondary products 9
are reduced (CO and HCOH) and no methylal, nor methyl formate are yielded at low 10
concentrations (≤ 50ppm). The presence of humidity in the discharge leads to a reduction of 11
ozone concentration which contribute to the partial methanol oxidation. These results could be 12
explained by a reaction between ozone and adsorbed water leading to the formation of 13
hydroperoxide species and/or adsorbed H2O2 more selective to CO2 formation. The presence
14
of these species and a low O3 concentration would favor the formation of formic acid instead
15
of the total oxidation of formaldehyde to CO2. We could also expect that these reactions block
16
partially the cycle of ozone decomposition, therefore explaining the leftover ozone detected at 17
the exit of the plasma catalyst reactor. The impregnation method and metal oxide ratios 18
showed a little effect on the conversion rate of methanol, a 5 % MnO2 /5 % CuO / Al2O3
19
catalyst prepared by successive impregnations results in the best conversion rates and CO2
20 selectivity. 21 22 Acknowledgment 23
The authors are thankful to the ANRT for the financial support. 24
28 References
1
[1] A.M. Vandenbroucke, R. Morent, N. De Geyter, C. Leys, Non-thermal plasmas for 2
non-catalytic and catalytic VOC abatement, J Hazard Mater. 195 (2011) 30-54 3
[2] G. Xiao, W. Xu, R. Wu, M. Ni, C. Du, X. Gao, Z. Luo, K. Cen, Non-Thermal Plasmas 4
for VOCs Abatement, Plasma Chem Plasma Process, 34 (2014) 1033–1065 5
[3] M. Schiavon, V. Torretta, A. Casazza, M. Ragazzi, Non-thermal Plasma as an 6
Innovative Option for the Abatement of Volatile Organic Compounds: a Review, Water 7
Air Soil Pollut. 228 (2017) 388-408 8
[4] J. Van Durme, J. Dewulf, W. Sysmans, C. Leys, H. Van Langenhove, Abatement and 9
degradation pathways of toluene in indoor air by positive corona discharge, Chemosphere. 10
68 (2007) 1821–1829 11
[5] J. Van Durme, J. Dewulf, W. Sysmans, C. Leys, H. Van Langenhove, Efficient 12
toluene abatement in indoor air by a plasma catalytic hybrid system, Appl. Catal. B 13
Environ. 74 (2007) 161–169. 14
[6] A.M. Vandenbroucke, M.T. Nguyen Dinh, N. Nuns, J.-M. Giraudon, N. De Geyter, C. 15
Leys, J.-F. Lamonier, R. Morent, Combination of non-thermal plasma and Pd/LaMnO3 16
for dilute trichloroethylene abatement, Chem. Eng. J. 283 (2016) 668–675 17
[7] O. Karatum, M.A. Deshusses, A comparative study of dilute VOCs treatment in a non-18
thermal plasma reactor, Chem. Eng. J. 294 (2016) 308–315 19
[8] L. Sivachandiran, F. Thevenet, P. Gravejat, A. Rousseau, Isopropanol saturated TiO2 20
surface regeneration by non-thermal plasma: Influence of air relative humidity, Chem. 21
Eng. J. 214 (2013) 17–26 22
29 [9] M. Sugasawa, T. Terasawa, S. Futamura, Additive Effect of Water on the
1
Decomposition of VOCs in Nonthermal Plasma, IEEE Trans. Ind. Appl. 46 (2010) 1692– 2
1698. 3
[10] J. Van Durme, J. Dewulf, K. Demeestere, C. Leys, H. Van Langenhove, Post-plasma 4
catalytic technology for the removal of toluene from indoor air: Effect of humidity, Appl. 5
Catal. B Environ. 87 (2009) 78–83 6
[11] S. Futamura, M. Sugasawa, Additive Effect on Energy Efficiency and Byproduct 7
Distribution in VOC Decomposition with Nonthermal Plasma, IEEE Trans. Ind. Appl. 44 8
(2008) 40–45. 9
[12] E.H. Lock, A.V. Saveliev, L.A. Kennedy, Methanol and Dimethyl Sulfide Removal 10
by Pulsed Corona Part I: Experiment, Plasma Chem. Plasma Process. 26 (2006) 527–542 11
[13] G. Yu-fang, Y. Dai-qi, T. Ya-feng, C. Ke-fu, Humidity Effect on Toluene 12
Decomposition in a Wire-plate Dielectric Barrier Discharge Reactor, Plasma Chem. 13
Plasma Process. 26 (2006) 237–249. 14
[14] Z. Falkenstein, J.J. Coogan, Microdischarge behaviour in the silent discharge of 15
nitrogen-oxygen and water-air mixtures, J. Phys. Appl. Phys. 30 (1997) 817. 16
[15] R. Ono, T. Oda, Measurement of hydroxyl radicals in pulsed corona discharge, 17
J. Electrost. 55 (2002) 333–342. 18
[16] L. Fouad, S. Elhazek, Effect of humidity on positive corona discharge in a three 19
electrode system, J. Electrost. 35 (1995) 21–30. 20
[17] S. Lovascio, N. Blin-Simiand, L. Magne, F. Jorand, S. Pasquiers, Experimental Study 21
and Kinetic Modeling for Ethanol Treatment by Air Dielectric Barrier Discharges, Plasma 22
Chem Plasma Process. 35 (2015) 279-301 23
30 [18] T. Zhu, J. Li, Y. Jin, Y. Liang, G. Ma, Decomposition of benzene by non-thermal 1
plasma processing: Photocatalyst and ozone effect, Int. J. Environ. Sci. Technol. 5 (2008) 2
375–384. 3
[19] M.T.N. Dinh, J.-M. Giraudon, J.-F. Lamonier, A. Vandenbroucke, N. De Geyter, C. 4
Leys, R. Morent, Plasma-catalysis of low TCE concentration in air using LaMnO3+δ as 5
catalyst, Appl. Catal. B Environ. 147 (2014) 904–911 6
[20] H. Einaga, M. Harada, S. Futamura, Structural changes in alumina-supported 7
manganese oxides during ozone decomposition, Chem. Phys. Lett. 408 (2005) 377–380. 8
[21] B.-D. Yan, S. Meilink, G. Warren, P. Wynblatt, Water Adsorption and Surface 9
Conductivity Measurements on alpha Alumina Substrates, IEEE Trans. Compon. Hybrids 10
Manuf. Technol. 10 (1987) 247–251. 11
[22] C. Norsic, J.-M. Tatibouët, C. Batiot-Dupeyrat, E. Fourré, Non thermal plasma 12
assisted catalysis of methanol oxidation on Mn, Ce and Cu oxides supported on γ-Al2O3, 13
Chem. Eng. J., 304 (2016) 563-572 14
[23] T.C. Manley, The Electric Characteristics of the Ozonator Discharge, Trans. 15
Electrochem. Soc. 84 (1943) 83–96 16
[24] I. Biganzoli, R. Barni, A. Gurioli, R. Pertile, C. Riccardi, Experimental investigation 17
of Lissajous figure shapes in planar and surface dielectric barrier discharges, J. Phys. 18
Conf. Ser. 550 (2014) 12039 19
[25] Z. Ye, J.-M. Giraudon, N. Nuns, P. Simon, N. De Geyter, R. Morent, J.-F. Lamonier, 20
Influence of the preparation method on the activity of copper-manganese oxides for 21
toluene total oxidation, Appl. Cat. B: Env. 223 (2018) 154–166 22
31 [26] I. Spassova, M. Khristova, D. Panayotov, D. Mehandjiev, Coprecipitated CuO– 1
MnOx Catalysts for Low-Temperature CO–NO and CO–NO–O2 Reactions, J. Catal. 185 2
(1999) 43–57 3
[27] J. Jarrige, P. Vervisch, Plasma-enhanced catalysis of propane and isopropyl alcohol 4
at ambient temperature on a MnO2-based catalyst, Appl. Cat B: Environ. 90 (2009) 74–82 5
[28] S.M. Saqer, D.I. Kondarides, X.E. Verykios, Catalytic oxidation of toluene over 6
binary mixtures of copper, manganese and cerium oxides supported on γ-Al2O3, Appl. 7
Catal. B Environ. 103 (2011) 275–286 8
[29] K. Qian, Z. Qian, Q. Hua, Z. Jiang, W. Huang, Structure–activity relationship of 9
CuO/MnO2 catalysts in CO oxidation, Appl. Surf. Sci. 273 (2013) 357–363 10
[30] W. Li, G. V. Gibbs, S. T. Oyama, Mechanism of Ozone Decomposition on a 11
Manganese Oxide Catalyst. 1. In Situ Raman Spectroscopy and Ab Initio Molecular 12
Orbital Calculations, J. Am. Chem. Soc., 120 (1998) 9041-9046, 25 B. 13
[31] Catalytic oxidation of phenol by hydrogen peroxide over a pillared clay containing 14
iron. Active species and pH effect, J. M. Tatibouët, E. Guélou et J. Fournier, Topics 15
Catal., 33 (2005) 225-229 16
[32] J. Jia, W. Yang, P. Zhang, J. Zhang, Facile synthesis of Fe-modified manganese 17
oxide with high content of oxygen vacancies for efficient airborne ozone destruction, 18
Appl. Catal. A: Gen., 546 (2017) 79-86 19
[33] G. Zhu, J. Zhu, W. Jiang, Z. Zhang, J. Wang, Y. Zhu, Q. Zhang, Surface oxygen 20
vacancy induced -MnO2 nanofiber for highly efficient ozone elimination, Appl. Catal. B:
21
Env., 209 (2017) 729-737 22
32 [34] B. Dhandapani, S.T. Oyama, Gas phase ozone decomposition catalysts, Appl. Catal. 1
B Environ. 11 (1997) 129–166 2
[35] J.M. Tatibouët, Methanol oxidation as a catalytic surface probe, Appl. Catal. A: Gen., 3 148 (1997) 213-252 4 5 6 7 8 9 10 11 12