HAL Id: hal-00317266
https://hal.archives-ouvertes.fr/hal-00317266
Submitted on 19 Mar 2004
HAL is a multi-disciplinary open access
archive for the deposit and dissemination of
sci-entific research documents, whether they are
pub-lished or not. The documents may come from
teaching and research institutions in France or
abroad, or from public or private research centers.
L’archive ouverte pluridisciplinaire HAL, est
destinée au dépôt et à la diffusion de documents
scientifiques de niveau recherche, publiés ou non,
émanant des établissements d’enseignement et de
recherche français ou étrangers, des laboratoires
publics ou privés.
meridionalwinds II: combined FPI, radar and model
Climatologies
E. M. Griffin, A. Aruliah, I. C. F. Müller-Wodarg, A. Aylward
To cite this version:
E. M. Griffin, A. Aruliah, I. C. F. Müller-Wodarg, A. Aylward. Comparison of high-latitude
ther-mospheric meridionalwinds II: combined FPI, radar and model Climatologies. Annales Geophysicae,
European Geosciences Union, 2004, 22 (3), pp.863-876. �hal-00317266�
SRef-ID: 1432-0576/ag/2004-22-863 © European Geosciences Union 2004
Annales
Geophysicae
Comparison of high-latitude thermospheric meridional winds II:
combined FPI, radar and model Climatologies
E. M. Griffin, A. Aruliah, I. C. F. M ¨uller-Wodarg, and A. Aylward
Atmospheric Physics Laboratory, University College London, 67-73 Riding House Street, London W1W 7EJ, UK Received: 03 September 2002 – Revised: 25 July 2003 – Accepted: 29 July 2003 – Published: 19 March 2004
Abstract. The climatological behaviour of the thermo-spheric meridional wind above Kiruna, Sweden (67.4◦N, 20.4◦E) has been investigated for seasonal and solar cycle dependence using six different techniques, comprising both model and experimental sources. Model output from both the empirical Horizontal Wind Model (HWM) (Hedin et al., 1988) and the numerical Coupled Thermosphere and Iono-sphere Model (CTIM) are compared to the measured be-haviour at Kiruna, as a single site example. The empirical International Reference Ionosphere (IRI) model is used as input to an implementation of servo theory, to provide an-other climatology combining empirical input with a theo-retical framework. The experimental techniques have been introduced in a companion paper in this issue and provide climatologies from direct measurements, using Fabry-Perot Interferometers (FPI), together with 2 separate techniques applied to the European Incoherent Scatter radar (EISCAT) database to derive neutral winds. One of these techniques uses the same implementation of servo theory as has been used with the IRI model. Detailed comparisons for each sea-son and solar activity category allow for conclusions to be drawn as to the major influences on the climatological be-haviour of the wind at this latitude. Comparison of the in-coherent scatter radar (ISR) derived neutral winds with FPI, empirical model and numerical model winds is important to our understanding and judgement of the validity of the tech-niques used to derive thermospheric wind databases. The comparisons also test model performance and indicate pos-sible reasons for differences found between the models. In turn, the conclusions point to possible improvements in their formulation. In particular it is found that the empirical mod-els are over-reliant on mid-latitude data in their formulation, and fail to provide accurate estimates of the winds at high-latitudes.
Key words. Meteorology and atmospheric dynamics
(ther-mospheric dynamics), Ionosphere (ionosphere-atmosphere interactions, auroral ionosphere)
Correspondence to: E. M. Griffin
(eoghan@apl.ucl.ac.uk)
1 Introduction
The companion paper has presented an introduction to short-term comparisons and neutral wind climatologies using FPI and ISR databases from several sites (Griffin et al., 2004). Comparisons of experimental results with models have also been undertaken by other authors, in some cases at the Kiruna/Tromsø region used in this study. Titheridge (1991) compared winds derived from EISCAT ISR CP-1 experi-ments to HWM87 model winds to point out the limitations of the HWM model at high-latitudes. The results showed that the overall mean winds in HWM87 are about 50% greater than those calculated from the EISCAT incoherent scatter data. The amplitude of the diurnal variation was nearly 100% too large in the model. In order to resolve these discrepan-cies, some EISCAT and high-latitude FPI data were included in the later HWM90 model. More recently, Buonsanto et al. (1997a) have compared meridional neutral wind results from four first principle models with results from the Mill-stone Hill ISR, using the line-of-sight ion velocities, and FPI measurements taken during 24–26 January 1993, a period which included a minor geomagnetic storm. The authors speculate that an underestimate of the high-latitude Joule heating could be the cause of this difference between the winds derived from the radar and the winds from the cou-pled models, including CTIM, used in the comparison.
Titheridge (1995b), in a review of empirical wind mod-els, finds that for Northern Hemisphere studies the HWM90 version of the model appears to give the best estimate of mean winds. For the Southern Hemisphere, best results were generally obtained by using a mean of the theoretical Vector Spherical Harmonic (VSH) model (Killeen et al., 1987) and the HWM90 winds. Titheridge (1995b) suggests that in the “worst case” scenarios the HWM90 winds may have errors of 50–100 ms−1when compared with data derived from iono-spheric parameters for time periods when the model is used to extrapolate to regions with little data coverage. Note that typical wind magnitudes are 100–200 ms−1at high-latitudes and less than 100 ms−1at lower latitudes. The model winds for Kiruna may be expected to have smaller errors than this,
however, since several nearby sites, such as the EISCAT radar at Tromsø, contributed to the HWM data set.
The improved performance of the HWM90 winds is con-firmed by Witasse et al. (1998) in their comparisons with a climatology of neutral winds derived from EISCAT radar experiments. Their analysis of sixty-five ISR experiments represents 119 days between January 1984 and March 1995, which covers a full solar cycle. This has extended the Titheridge (1991) study by permitting an analysis of the influence of solar activity on the meridional winds. The Witasse et al. (1998) database is included for comparison in this study, which combines their results with other experi-mental and model climatologies.
Theoretical predictions of thermospheric neutral winds can be tested by looking at long-term data trends and sen-sitivity to different conditions, to establish whether the theo-retical results are demonstrating the correct range of variation and behaviour. Satellites, such as Dynamics Explorer 2, can provide global verification of circulation patterns, but long-term spatially localised databases are needed to test theoret-ical climatologies. In these cases sufficient data need to be gathered to allow for confidence in the comparisons. One of the aims of this paper is to use one of the largest local experimental data sets available, to test both theoretical and empirical model predictions of the neutral winds at a specific location. Anderson et al. (1998) have tested a number of nu-merical models against ISR data using standard model runs with no allowance for adjusting uncertain input parameters. With this procedure, they intended to show how differences in the physical formulations affect the model output, which may lead to identification of the strengths and weaknesses associated with each model. They, however, use HWM to provide model neutral winds to supplement the purely iono-spheric models. In this study we will compare the numerical CTIM neutral wind output with actual observed winds.
2 Techniques
2.1 Introduction
The companion paper describes direct measurements of the meridional wind by FPI and 2 techniques applied to EISCAT radar data that derive the meridional wind from plasma pa-rameters. The FPI technique uses direct measurements of the 630 nm atomic oxygen emission, attributed to a peak emis-sion altitude of 240 km, to deduce thermospheric winds from observed Doppler shifts, and the data used to derive the re-sults covers November 1982 to March 1998. The EISCAT-ISR technique represents the Witasse et al. (1998) applica-tion of the standard Salah and Holt (1974) wind derivaapplica-tion for EISCAT experiments from January 1984 to March 1995. The Meridional Wind Model (MWM) (Miller et al., 1997) is used in the EISCAT-MWM technique, which applies servo theory to deduce winds by using hmF2 values derived from EISCAT experiments as input to the MWM, and uses the same exper-imental data set as the EISCAT-ISR technique.
This paper adds 3 further techniques to present a unique comparison of the thermospheric meridional component of the neutral winds as observed in a localised region. The 3 extra techniques are (1) output from the HWM, an empiri-cal model constructed from both satellite and ground-based measurements: (2) output from CTIM (Fuller-Rowell et al., 1988), which is a first principles theoretical model; (3) a climatology produced by using data from the empirical IRI model as input to the Meridional Wind Model (MWM, Miller et al., 1997). The climatologies described in the following sections extend the scope and depth of the experimental cli-matologies presented in the companion paper, as well as pro-vide a critique of the success of the individual techniques.
2.2 HWM
The HWM has been the source most often used to provide model thermospheric winds when measurements are unavail-able. This model has been developed from its original ver-sion HWM87 (Hedin et al., 1988) through HWM90 (Hedin et al., 1991) and HWM93 (Hedin et al., 1996), giving progres-sively increased coverage of conditions and altitudes. The meridional winds used in the earliest version of the model are based on FPI measurements made in the early 1980s, i.e. around solar maximum, with the polar orbiting satellite DE-2, mostly at heights of 300–500 km, together with winds de-rived from a few incoherent scatter radars. Global variations are represented by an expansion in vector spherical harmon-ics, with each expansion coefficient including annual, 24-h, 12-h and 8-h components.
As mentioned in the Introduction, an important improve-ment of HWM87 is the inclusion of high-latitude ground-based input from both FPI and EISCAT data. The data set was also extended to include full solar cycle coverage, thus allowing for solar cycle variations to be investigated. There is no differentiation between the equinoxes, however, with autumn and spring being treated as the same season. In the later HWM93 version of the model, the upper thermospheric winds are identical to those in HWM90, with the revisions aimed at the lower thermosphere and an extension of the model to the mesosphere, stratosphere and troposphere.
2.3 MWM-IRI
The MWM, described in the companion paper, has been con-structed so as to allow for the IRI model to be used as a source of hmF2 when no measurements are available for a given location and time. The IRI model uses a set of em-pirical coefficients to derive the peak height and maximum electron density of the F2 layer. The coefficients are derived from several years of ionosonde data, from a wide range of geographic locations, and their values agree closely with the median values measured each month by ionosondes. Using the IRI model as a source of hmF2 makes possible the gener-ation of a global description of the meridional winds that is not limited by the geographic distribution of instruments.
As the IRI is an empirically derived model, we can re-gard the MWM-IRI as an empirically derived climatology, to the same extent that the HWM climatology may be regarded as empirical. However, since both depend on extrapolation of data sets from other locations, they will inevitably dif-fer from the climatologies based purely on the Kiruna FPI and EISCAT databases. This has already been demonstrated by the differences shown by Miller et al. (1997), where they compare HWM90 winds to those derived using the IRI as an input source to MWM. Both the HWM90 and IRI are based on sets of global mathematical functions that have been fitted to data. While the satellite data set used in the development of the HWM90 is global, the ground-based data are predom-inantly from the radar chain near 290◦longitude. The IRI database is from ionosonde stations that are also concentrated in a few geographical regions. The result is that both models are extrapolated to regions and geomagnetic conditions that are not well represented in the data. Miller et al. (1997) find that, on a global scale, the variation of the winds from the HWM90 model is similar to those of the MWM when us-ing IRI hmF2 input. One limitation is usus-ing the Field Line Interhemispheric Plasma model (FLIP, Richards, 1991) to calculate the “balance heights” for the MWM. This is the height at which hmF2 would occur in the absence of an ap-plied zonal electric field or meridional neutral wind. Using FLIP to calculate these balance heights generally restricts the MWM winds to magnetic latitudes that are more than 20◦ from the magnetic poles and equator.
Miller et al. (1997) also state that both models show the mean meridional wind on a global scale to be more south-ward at the June solstice and northsouth-ward at the December sol-stice, as expected based on the direction of the thermal gra-dient. However, they point out that the difference in wind magnitudes at specific locations can be quite large. They also conclude that the major differences in all cases is in the strength of the winds at the higher latitudes, with the high-latitude HWM90 model winds stronger, especially near the solstice.
2.4 CTIM
In the companion paper the CTIM model was used to demon-strate the forces acting to produce the diurnal wind pattern at this latitude and their sensitivity to geomagnetic activity. It is important to note that all the other climatologies presented in this study will be based on empirical databases or models de-rived from empirical databases. The Coupled Thermosphere Ionosphere Model (CTIM) is a theoretical, self-consistent model that is derived from first principles. The CTIM clima-tologies have been obtained from standard simulations from the model in which parameters are computed at 15 pressure levels spaced at vertical intervals of one scale height. This corresponds to altitudes from around 80 km to over 400 km, with the wind results presented here being taken from pres-sure level 12, which corresponds to an altitude of around 240 km. The model output is available globally on a grid with spacing 2◦ in latitude and 18◦ in longitude. For this
study coordinates of 70◦N and 18◦E were used to match as
closely as possible with the EISCAT transmitter site, which is at 69.6◦N and 19.2◦E. In the case of the low solar
activ-ity results the F10.7level was set at 100, with the high solar
activity simulations having an F10.7level of 180. Fairly quiet
geomagnetic conditions with Kp=2+were used in both solar
activity cases, as this was the lowest level of Kp for which
there were model runs available at all seasons. The autumn and spring equinoxes are treated as the same season in this model, in much the same way as with HWM90.
3 Results
3.1 Introduction
The climatological comparisons included in the companion paper were based on classifications introduced in the Aru-liah et al. (1996) and Witasse et al. (1998) studies, and all of the techniques introduced here have been classified using the same scheme. This scheme uses F10.7=120 as the cutoff
between high and low solar activity, and the seasons are sepa-rated using the solstices and equinoxes +/−45 days, e.g. win-ter season covers the December solstice +/−45 days. Each seasonal and solar activity classification is presented sepa-rately in the following sections where the results from the different climatological techniques are compared and con-trasted. The features of interest in each are discussed along with the important points to be noted when taking the indi-vidual classifications in combination, thereby contrasting the seasonal and solar activity influences. For each set of diurnal wind values from each technique in each category a harmonic fit to the diurnal wind pattern was performed using diurnal, semidiurnal and terdiurnal terms in the following form:
u(t ) = hui + A24(ω24(t − φ24))+
A12(ω12(t − φ12)) + A8(ω8(t − φ8)), (1)
where u is the fitted wind, Anare the amplitudes for the
har-monic terms and the angular frequency ωn=2π/n. The
re-sults of these fits are shown in Tables 1–8 and will be dis-cussed, together with the comparative plots for each season. In each table the values of hui (the mean), A24 (diurnal
am-plitude), A12(semidiurnal amplitude) and A8(terdiurnal
am-plitude) fitted for each of the techniques are presented. Un-fortunately, the lack of a long enough diurnal coverage pre-cludes the FPI data from being fitted, but the average winds are included in the figures for comparison.
3.2 Spring season, low solar activity
Figures 1–8 show the behaviour of the meridional neutral winds as described by each of the 6 techniques introduced in Sect. 2 for each of the climatological categories. Winds are positive northward with the y-axis representing wind speed in metres per second and the x-axis representing Universal
Fig. 1. The diurnal pattern of northward thermospheric meridional
winds for spring season, low solar activity comparing the six tech-niques.
Table 1. Spring season, low solar activity thermospheric meridional
winds: a comparison of the mean, diurnal, semidiurnal and terdiur-nal components for five of the techniques producing thermospheric meridional neutral winds at Kiruna.
Spring – low Mean Diurnal Semi- Ter-solar activity diurnal diurnal EIS-MWM −58.4 83 22.5 11.5 EISCAT-ISR −60 127 11 20 MWM-IRI −50.0 87.5 18.9 4.6 CTIM −40.0 123.2 52.6 15.0 HWM −55.4 122.8 26.3 9.4
Time (UT) in hours. There are eight categories, correspond-ing to the four seasons centred on the equinoxes and sol-stices, and for two solar activity levels. The first set is for the spring season at low solar activity. In Fig. 1 the basic diurnal pattern is evident from all the techniques with weak daytime northward winds and stronger reverse flows at night, leading to southward winds. There are a number of features to be taken note of in terms of the comparison of the differ-ent techniques. Both implemdiffer-entations using MWM, i.e. with
Fig. 2. As for Fig. 1 but for summer season, low solar activity.
Table 2. As for Table 1 but for summer season, low solar activity.
Summer – low Mean Diurnal Semi- Ter-solar activity diurnal diurnal EIS-MWM −26.5 39.0 17.0 4.6 EISCAT-ISR −78 99 23 4 MWM-IRI −23.75 51.5 8.2 8.1 CTIM −50.0 162.1 60.2 29.3 HWM −69.8 109.5 19.1 5.8
EISCAT hmF2 values (EISCAT-MWM) and IRI hmF2 val-ues (MWM-IRI), are in good agreement with each other and also with the FPI data for the first half of the day. Later on, however, the EISCAT-MWM winds become more southward until midnight. The CTIM climatology displays values that are in marked disagreement with the other methods early in the day, producing greater northward winds than any other technique. Towards midnight the CTIM winds become the most southward, giving an overall diurnal amplitude much higher than any of the other techniques. Both the CTIM and HWM models display an abatement in the positive northward daytime winds just before noon. There is no clear evidence
of this feature in any of the other techniques. For ease of assessment we will term this feature the PNA, to denote a pre-noon abatement in northward daytime winds. Witasse et al. (1998) noted a similar feature in their high solar activ-ity winds from 257 km and attribute it to a semidiurnal tide, and as can be seen from Table 1 the semidiurnal components in the CTIM and HWM winds are indeed higher than those from the other techniques.
3.3 Summer season, low solar activity
Figure 2 presents the low solar activity results for the sum-mer season in which a wide variation in the nighttime wind amplitudes is evident between the techniques. There are no FPI winds for the summer season at this latitude due to the lack of appreciable periods of darkness at nighttime. To-wards noon the techniques merge together, displaying good agreement around the 12:00 to 15:00 UT period, however ap-proaching 24:00 UT, there is a clear divergence with the two MWM techniques producing approximately half the equator-ward wind magnitude of the HWM or EISCAT-ISR winds. The biggest differences seen between the MWM derived val-ues are in the second half of the day (12:00–24:00 UT). For both spring and summer the EISCAT-MWM winds are more southward than the MWM-IRI winds. The EISCAT-MWM winds display a smaller diurnal variation by comparison with the spring. The MWM-IRI winds display a very small over-all diurnal amplitude which is significantly smover-aller than that seen for the spring season and produces a much lower south-ward maximum midnight amplitude. Daytime MWM-IRI winds are similar in the two seasons.
The CTIM model winds turn northward too early in the day by comparison with all of the other techniques and then become the most southward towards midnight. These winds have by far the largest diurnal amplitude, and are larger than for the spring season. There is no evidence of the PNA in the CTIM winds, which was seen in the spring season, even though the semidiurnal component of the wind from CTIM has increased (Table 2). The HWM winds display less pronounced daytime northward winds in this season than for spring and also show very little evidence for the PNA compared to the spring season. This is, however, consistent with the finding that the semidiurnal component of the HWM wind has decreased compared to spring (Table 2).
None of the other techniques displays any evidence of the PNA for either spring or summer. The amplitudes and shape of the EISCAT derived winds are similar to spring, apart from a pronounced decrease in the daytime northward wind ampli-tude. Using low solar activity EISCAT CP-1 data Titheridge (1991) also found a large southward shift near noon and mid-night, and a smaller southward shift at 06:00 and 18:00 UT in summer compared to spring. However, about half the nights from his sample showed a large surge in southward wind be-tween 21:00 UT and 22:00 UT that may be unrepresentative of the average behaviour and exaggerate this effect.
While the daytime shift to more southward winds is repro-duced in the EISCAT-ISR winds there is no similar shift seen
in the midnight wind speeds. This could be caused by the exclusion criteria used by Witasse et al. (1998), as Titheridge used the mean Ap for individual days to exclude disturbed
times from his data set. Witasse et al. (1998) actually used the electric field values measured by the CP-1 experiments as the primary criteria for rejection of disturbed times. The difference in results may indicate the shortcomings of using the mean daily Ap index as a measure of geomagnetic
dis-turbance for the whole day and the consequent failure to take into account the geomagnetic history.
3.4 Autumn season, low solar activity
For the autumn equinox results, shown in Fig. 3, the compar-ison with both the spring equinox and summer solstice reveal interesting differences. Both implementations using MWM are in good agreement after around 18:00 UT, but for the earlier part of the day the EISCAT-MWM winds are much less northward, barely reaching positive northward winds and even then only for a short period. The MWM-IRI winds appear to be in better agreement with the FPI winds as well. CTIM winds in the autumn are identical to spring, as there is no equinoctial difference built into the model, a feature which will also be seen in the high solar activity climatolo-gies. Therefore, the CTIM climatology again displays val-ues that are in marked disagreement with the other methods early in the day, producing much greater northward winds than the others, and toward midnight the CTIM winds be-come the most southward. Mirroring the situation in spring equinox, only the CTIM and HWM models display a pro-nounced PNA in the northward daytime winds. As with CTIM, the HWM winds are identical to spring due to the model having no equinoctial separation, and have the largest semidiurnal components of any of the techniques (Table 3).
The MWM-IRI winds show a similar diurnal amplitude to the spring season, but an overall shift to more north-ward values. The FPI winds also display an overall shift to more northward winds than in the spring season, with the equinoctial asymmetry in midnight southward winds appar-ent. For the EISCAT-MWM winds there is an increase in di-urnal amplitude by comparison with the spring season owing to more southward winds around midnight and more north-ward winds in daytime. In the case of the EISCAT-ISR winds the major difference compared to the spring results is a de-crease in the southward midnight winds, matching the FPI observed equinoctial asymmetry, with the daytime behaviour being similar in both seasons.
3.5 Winter season, low solar activity
The most confused picture of any of the seasons so far is seen in the winter results shown in Fig. 4 with wide discrepancies between the techniques. The implementations using MWM are not in good agreement for any part of the day, of which the EISCAT-MWM winds are significantly less southward at most times than those from MWM-IRI. The EISCAT-MWM winds appear to be in better agreement with the apparent
Fig. 3. As for Figure 1 but for autumn season, low solar activity.
Table 3. As for Table 1 but for autumn season, low solar activity.
Autumn – low Mean Diurnal Semi- Ter-solar activity diurnal diurnal EIS-MWM −54.9 58.5 14.2 9.3 EISCAT-ISR −55 113 22 13 MWM-IRI −24.9 83.7 9.8 10.5 CTIM −40.0 123.2 52.6 15.0 HWM −56.3 122.2 25.1 9.3
FPI wind diurnal variation amplitude than any of the other techniques. However, the phase of the EISCAT-MWM vari-ation is very different and also differs by comparison with the phase of all the EISCAT-MWM results in the other sea-sons. While this season produces the least consistent set of phases when comparing the techniques, the EISCAT-MWM results are the most idiosyncratic. There is a smaller diurnal amplitude than either of the equinox seasons but about the same as that of the summer season. The MWM-IRI winds display the largest diurnal amplitude in winter, compared to the other seasons, and also the greatest southward amplitude
Fig. 4. As for Fig. 1 but for winter season, low solar activity.
Table 4. As for Table 1 but for winter season, low solar activity.
Winter – low Mean Diurnal Semi- Ter-solar activity diurnal diurnal EIS-MWM −24.7 46.2 7.0 8.4 EISCAT-ISR −48 111 10 14 MWM-IRI −84.1 106.0 6.6 5.9 CTIM −25.3 99.8 41.2 20.3 HWM −42.8 105.9 27.3 13.3
at midnight. The FPI winds in winter have a smaller south-ward midnight amplitude than either of the equinox seasons.
The CTIM winds show a smaller diurnal amplitude than for the equinox or summer seasons (Table 4). The PNA is seen more clearly here in the winter season than in any of the other seasons at low solar activity, even though the semidi-urnal component of the CTIM winter winds has the smallest value. The CTIM climatology displays values that are more northward than the other techniques early in the day, but from about 15:00 UT until 23:00 UT the CTIM, HWM,
EISCAT-Fig. 5. As for EISCAT-Fig. 1 but for spring season, high solar activity.
Table 5. As for Table 1 but for spring season, high solar activity.
Spring – high Mean Diurnal Semi- Ter-solar activity diurnal diurnal EIS-MWM −88.4 184.7 58.7 6.6 EISCAT-ISR −54 123 50 14 MWM-IRI 15.5 81.2 6.8 2.6 CTIM −28.8 98.5 65.0 13.3 HWM −44.9 138.7 31.9 10.3
ISR and MWM-IRI winds are all in very close agreement. Again, only the CTIM and HWM models display a PNA from northward winds with little evidence of a similar fea-ture in any of the other climatologies. There is no great dif-ference in the HWM amplitude in winter by comparison with the other seasons but there is a much more pronounced PNA than in the other seasons. While the CTIM semidiurnal com-ponent is the lowest of any season, it is still higher than any of the other techniques in winter. The HWM semidiurnal component is actually the highest of any of its seasons.
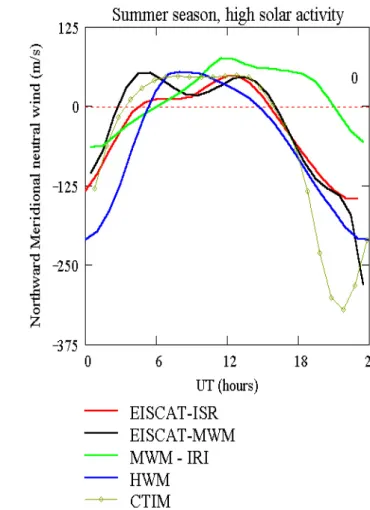
Fig. 6. As for Fig. 1 but for summer season, high solar activity.
Table 6. As for Table 1 but for summer season, high solar activity.
Summer – high Mean Diurnal Semi- Ter-solar activity diurnal diurnal EIS-MWM −27.4 97.5 47.5 25.5 EISCAT-ISR −34 88 25 10 MWM-IRI 15.6 63.1 11.1 10.9 CTIM −53.5 156.2 72.9 25.3 HWM −58.6 128.2 30.5 7.8
The EISCAT-ISR winds for winter have a similar midnight southward amplitude to the summer season but have higher amplitude northward daytime winds. As noted by Hagan (1993) for mid-latitudes, the daytime northward winds are strongest as well as most persistent during the winter because although the subsolar point is in the Southern Hemisphere, the Northern Hemisphere aurorally driven circulation is weak due to the lower ionospheric densities associated with ex-tended darkness. Again, there is little evidence of any PNA in the EISCAT-ISR winds, which is consistent with the other seasons.
3.6 Spring season, high solar activity
In the first of the results at high solar activity (Fig. 5) we see that most techniques display pronounced evidence for the PNA for the spring season. Table 5 shows that the semidiurnal components of all but the MWM-IRI technique are larger than for low solar activity. These MWM-IRI de-rived winds are significantly more northward than all the other techniques, from midday to early in the morning, and in significant disagreement with the EISCAT-MWM derived winds. EISCAT-MWM winds are the most southward of the techniques from 18:00 UT to 03:00 UT. Both HWM and the EISCAT-ISR winds appear in good agreement with the FPI winds. CTIM is the most northward technique from around 23:00 UT to 06:00 UT, and the winds appear to reverse from southward to northward during the night earlier than any of the other techniques.
3.7 Summer season, high solar activity
Figure 6 shows the results for the summer season at high so-lar activity and we see that simiso-lar to the spring season most techniques display pronounced evidence of the PNA. Table 6 shows that all of the techniques also show larger semidiur-nal components than for summer at low solar activity. Also repeating the trend seen in the spring season, the MWM-IRI derived winds are significantly more northward than all the other techniques, from midday to early in the morning, and noticeably the least consistent compared to the other tech-niques. The EISCAT-MWM and EISCAT-ISR techniques appear to agree quite well apart from a discrepancy in the EISCAT-MWM winds approaching midnight when there is a marked southward peak. The MWM-IRI winds show a sum-mer diurnal amplitude similar to the spring winds and also a similarly small degree of evidence for the PNA. From Table 6 we see that this is associated with the smallest semidiurnal component of any of the techniques. The EISCAT-MWM winds show a much reduced diurnal amplitude in summer compared to the spring winds (Table 6) and more pronounced evidence of the PNA, even though the semidiurnal compo-nent is smaller. There are no FPI winds for the summer sea-son at this latitude, as was the case for low solar activity.
Repeating the trend seen for spring, the CTIM winds ap-pear to reach their maximum southward winds during the night 1–2 h earlier than all the other techniques and are the most southward winds from 18:00 UT to near 24:00 UT. Ta-ble 6 shows that there is a much larger diurnal amplitude in the CTIM summer winds than for spring but also less evi-dence of the PNA than in spring, even though the semidiur-nal component is larger. Examining the HWM winds reveals little evidence of a PNA in the summer winds even though the semidiurnal component appears to be similar to spring. Finally, the EISCAT-ISR winds display a much smaller diur-nal amplitude in summer compared to spring but still show clear evidence of the PNA.
3.8 Autumn season, high solar activity
The autumn season at high solar activity results, presented in Fig. 7, show that in common with all the high activ-ity seasons most techniques display pronounced evidence of the PNA. Table 7 indicates that again, the semidiurnal components from this season are all higher than its low so-lar activity equivalent. The MWM-IRI derived winds are again significantly more northward than all the other tech-niques, from midday to early in the morning, and also most in disagreement with the EISCAT-MWM derived winds. EISCAT-MWM is the most equatorward of the techniques from 18:00 UT to 04:00 UT. Both HWM and the EISCAT-ISR winds appear in good agreement with the FPI winds.
The CTIM autumn winds are exactly the same as for spring due to the model formulation, as was explained in the low solar activity case. CTIM produces the most poleward winds, from around 24:00 UT to 06:00 UT and appears to reverse from southward to northward winds during the night, earlier than any of the other techniques. The autumn HWM winds are identical to those at spring, as was the case for the low solar activity regime, and only differ slightly from sum-mer by displaying the larger degree of the PNA that was also seen in the spring winds, even though Table 7 shows that the semidiurnal components are virtually identical.
A prominent feature of the previously reported equinoctial asymmetry was that the effect was clearer during periods of high solar activity than for low solar activity. For the FPI winds we see a smaller southward midnight amplitude than is displayed in the spring winds, confirming the existence of the equinoctial asymmetry in both solar activity regimes. The EISCAT-MWM winds display a larger post-midnight south-ward amplitude than those at spring and also a more pro-nounced example of the PNA, but are similar in diurnal am-plitude, being much larger than at summer. The EISCAT-ISR winds have a similar diurnal amplitude in autumn compared to spring but a smaller midnight maximum southward wind. There is also less evidence of the PNA than was seen in either spring or summer, despite the semidiurnal component being intermediate between the values for spring and summer. 3.9 Winter season, high solar activity
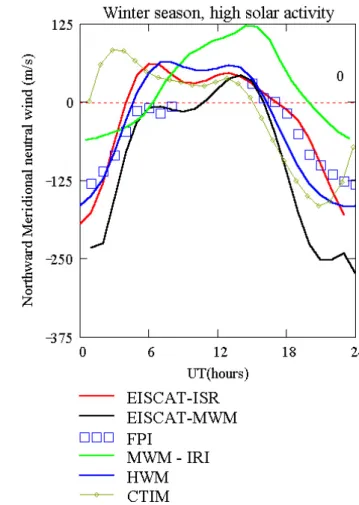
The final set of comparisons for the winter season at high solar activity, shown in Fig. 8, demonstrates the repeated feature that MWM-IRI derived winds are more northward than all the other techniques, from midday on to early in the morning. Also, as for all of the high solar activity seasons, apart from summer, they are most in disagreement with the EISCAT-MWM derived winds. There is clear evidence of the PNA in all the other techniques with full diurnal cover-age, and also much larger semidiurnal components as shown in Table 8. EISCAT-MWM is the most southward of the techniques from 18:00 UT to 04:00 UT. Both HWM and the EISCAT-ISR winds appear in good agreement with the FPI winds from 00:00 UT until 06:00 UT when there is a better fit between the FPI and EISCAT-MWM winds.
Fig. 7. As for Figure 1 but for autumn season, high solar activity.
Table 7. As for Table 1 but for autumn season, high solar activity.
Autumn – high Mean Diurnal Semi- Ter-solar activity diurnal diurnal EIS-MWM −122.5 194.9 64.9 17.8 EISCAT-ISR −41 118 34 10 MWM-IRI 12.2 74.9 17.8 3.1 CTIM −28.8 98.5 65.0 13.3 HWM −44.9 138.7 31.9 10.3
The CTIM winds have a slightly smaller diurnal amplitude than is seen in any of the other seasons and also display a more pronounced PNA feature than any of the other seasons, although the semidiurnal component is the smallest of any of the CTIM seasons at high solar activity. CTIM is also the technique producing the most poleward winds, from around 23:00 UT to 06:00 UT, and the wind appears to reverse from southward to northward during the night, around 3–6 h ear-lier than any of the other techniques.
The FPI winds have smaller midnight southward winds than either of the equinox seasons. The HWM winds in
win-Fig. 8. As for Figure 1 but for winter season, high solar activity.
Table 8. As for Table 1 but for winter season, high solar activity.
Winter – high Mean Diurnal Semi- Ter-solar activity diurnal diurnal EIS-MWM −91.5 145.8 43.0 8.0 EISCAT-ISR −25 102 51 23 MWM-IRI 25.2 90.1 7.0 7.0 CTIM −15.0 96.0 56.8 12.5 HWM −32.4 120.4 26.0 13.4
ter display similar diurnal amplitudes to those in the other seasons and possibly the most prominent evidence of the PNA of any of the seasons. For the EISCAT-MWM winds there is a smaller diurnal amplitude than at equinox but larger than that at summer. The mean wind is, however, more south-ward than is the case in summer. Finally, the EISCAT-ISR winds have a larger diurnal amplitude than in summer but smaller than at equinox. Midnight southward winds are sim-ilar to those at autumn, being smaller than those in spring but greater than those in summer.
4 Combined Results
4.1 Summary of the low solar activity comparisons A number of clear trends and features are worth noting from the collection of low solar activity climatologies with respect to each of the individual techniques. The EISCAT-MWM winds display similar diurnal amplitudes for summer and winter, although the winter winds have a pronounced phase shift by comparison with the other seasons so that northward winds appear approximately 6 hours later. The spring winds have the highest diurnal amplitudes while the autumn wind amplitudes are similar to both solstices. None of the seasons has any clear signature of the PNA feature.
There is only a small seasonal variation in the diurnal amplitude of the EISCAT-ISR winds, of which the summer winds have the smallest daytime northward amplitude and winter winds the largest. There is very little evidence in the EISCAT-ISR winds of any PNA feature for any of the sea-sons. For the MWM-IRI winds there is a trend of decreas-ing diurnal amplitude from winter through the equinoxes and into summer. No evidence of the PNA feature is seen in any season. There is also a noticeable difference in the equinoxes in that there is a shift to more southward winds in spring com-pared to those in autumn.
The HWM winds display consistent midnight southward amplitudes through all the seasons. The diurnal amplitudes are also similar, although slightly higher at equinox com-pared to solstice. The evidence of the PNA feature, how-ever, increases from summer through the equinoxes to win-ter, mirroring the increase in the semidiurnal component of the winds. The model contains no separate consideration of the spring and autumn equinoxes. There is a consistent in-crease in the diurnal amplitude of the CTIM winds from the winter season through the equinoxes to the summer season which has the largest amplitude. The evidence of the PNA grows in the opposite direction to the amplitudes with the least evidence in the summer winds and the winter winds having the most evident feature, similar to the progression in the HWM winds. However, unlike the HWM winds, the CTIM semidiurnal components follow the opposite trend.
A number of clear trends emerge when examining the dif-ferent climatologies together in the low solar activity regime. Clearest is that all of the techniques show that there is an equinoctial asymmetry in the midnight southward winds with autumn winds having smaller amplitudes than the spring winds, except for CTIM and HWM, which do not separate the equinoxes. While there are no daylight observations to establish evidence for the PNA in the FPI winds it is clear that the EISCAT based techniques and MWM-IRI do not show any evidence of it, whereas the CTIM and HWM results do. With neither of the experimental techniques indicating the feature is present at low solar activity this must be seen as a failure of the models.
Using two of the techniques compared here at mid-latitudes Khachikjan et al. (1997) find that the IRI-86 diur-nal variations vary more strongly with season than those
pre-dicted by the HWM, which is certainly in keeping with the results presented here. At low solar activity there should be less influence of auroral forcing at mid-latitudes than at high solar activity. The diurnal variation in the winds should then be larger at a higher latitude site, such as Tromsø/Kiruna, than for the mid-latitudes. This would indicate that the HWM daily mean wind and diurnal amplitude variations are proba-bly not large enough and that the MWM-IRI diurnal ampli-tudes should have greater variation as well. These empirical models may be averaging out such variations or lacking suf-ficient data coverage to model them.
Another mid-latitude study by Igi et al. (1999) finds that there is a strong seasonal variation in diurnal amplitude at low solar activity, with the maxima one month after solstice and the minima one month after equinox. These mid-latitude results match those found from previous work for diurnal am-plitude at other mid-latitude sites (Buonsanto 1990, 1991; Duboin and Lafeuille, 1992), the wide longitudinal cover-age provided by these studies giving confidence to the find-ings. The opposite trend is found here in the results from the EISCAT-MWM technique. The MWM-IRI winds have maximum diurnal amplitude in winter but minimum ampli-tude in summer which is not only different from the other
hmF2 technique, i.e. EISCAT-MWM, but also different from
the previous studies at mid-latitudes using other techniques. In the companion paper the experimental techniques were examined for evidence of more southward winds at equinox than solstice, owing to the semi-annual variation of geomag-netic activity and consequently, auroral heating, as suggested by Lal (1996). None of the model techniques introduced here show any evidence of this effect.
4.2 Summary of the high solar activity comparisons Similar to the low solar activity case, a number of clear trends and features are worth noting from the collected high so-lar activity climatologies. The EISCAT-MWM winds dis-play similar diurnal amplitudes for spring and autumn, with smaller amplitudes in winter and especially summer. There is clear evidence of the PNA in all of the seasons, together with high semidiurnal components.
Summer and winter diurnal amplitudes for the EISCAT-ISR winds are very similar, both smaller than the equinox amplitudes which are also similar to each other. There is some evidence of the PNA in all of the seasons, with the most evidence possibly in the summer and winter seasons, although the largest semidiurnal components are in spring and winter. For the MWM-IRI winds there is a small trend of decreasing diurnal amplitude from winter through the equinoxes and into summer. There is also evidence of the PNA in all of the seasons, with a small trend of increas-ing evidence from summer through the equinoxes to winter, although the semidiurnal components are generally small. There is no significant difference between the equinox sea-sons.
The HWM winds display consistent midnight southward amplitudes through all the seasons. The diurnal amplitudes
are slightly larger at equinox compared to solstice. The evi-dence of the PNA, however, increases from summer through the equinoxes to winter, although there is little seasonal vari-ation in the semidiurnal components. As with the low so-lar activity results the model produces no equinoctial differ-ences. For the CTIM winds we see that there is a consis-tent increase in the diurnal amplitude of the winds from the winter season through the equinoxes to the summer season which has the largest amplitude. The evidence of the PNA grows in the opposite direction with the least evidence in the summer winds and the winter season having the most evi-dent abatement. This progression is opposite to the growth in strength of the semidiurnal component. None of the mod-elled winds shows clear evidence of more southward winds at equinox compared to solstice, as suggested by Lal (1996), which matches the scenario at low solar activity.
In one of the earliest seasonal analyses of ISR derived winds Emery (1978) used solar maximum data at 43◦N to
show a large seasonal change in mean southward wind from about +70 ms−1in summer to 30 ms−1in winter. On com-parison with the data presented here it is interesting to note that neither of the measurement based climatologies, i.e. EISCAT-ISR and EISCAT-MWM, exhibit such a consistent trend, while all of the modelled winds match the trend. This may again indicate an over-reliance on mid-latitude results influencing the model output.
4.3 Combined high and low solar cycle regimes
There are many consistencies between the two sets of clima-tologies for each technique, with similar trends seen both in low and high solar activity. The CTIM winds show the same trends of increasing diurnal amplitude from winter through equinox to summer and the increasing evidence of the PNA from summer through equinox to winter. The HWM diurnal amplitudes are slightly higher at equinox than at solstice and have increased evidence of the PNA from summer through equinox to winter. There are also a number of clear dif-ferences when the low and high solar activity regimes are compared. In the MWM-IRI data there are greater midnight southward winds in spring compared to autumn for the low solar activity case, whereas no such clear evidence is avail-able for high solar activity. For the HWM winds the winter season shows lower midnight southward winds than the other seasons at high solar activity, an effect which is not evident at low solar activity. For both the MWM and EISCAT-MWM winds there is clear evidence of the PNA in high solar activity for all seasons, whereas no such evidence is found for the low solar activity case.
Hedin et al. (1994) also found that most of the data near midnight showed that the typically southward winds weaken with increasing solar activity in all seasons except summer, when results were mixed. Miller et al. (1997) found that the global picture showed a strong inverse dependence on solar activity as measured by the F10.7index for nighttime winds.
However, no dependence on F10.7 was found for daytime
winds. In comparison with the winds found in the present
study only the MWM-IRI winds support this finding with EISCAT-MWM, FPI and EISCAT-ISR winds all showing an opposite trend of greater southward winds at higher solar ac-tivity.
5 Discussion
Six different techniques have been used to investigate the cli-matological behaviour of the thermospheric neutral wind at a single location. Two techniques derive winds from iono-spheric parameters (EISCAT-MWM and EISCAT-ISR), and one uses directly measured FPI winds. Previously similar comparisons have been performed either without FPI winds (Buonsanto et al., 1997b) or with FPI winds when these tech-niques are limited to a shorter period, not looking at climato-logical effects (Buonsanto et al., 1997a). We have also tested the abilities of the CTIM, HWM and IRI models to simu-late the most important features shown by the measurement-based techniques.
The comparisons made here between the EISCAT-ISR winds and the MWM winds, derived using EISCAT hmF2 values, are particularly important, as both climatologies use the same database of CP-1 experiments. The HWM is a global model mostly derived from mid-latitude measure-ments so differences between HWM climatologies and other models are to be expected to a certain extent. Yet this model is the most often used for neutral winds at high-latitudes when measurements are not available. The climatologies derived using MWM with IRI hmF2 values provide another global empirical model to be evaluated at a specific latitude. The CTIM climatologies provide a test of a purely theoret-ical model. As such the CTIM winds may be expected to be less well matched due to the lack of any constraints from actual measurements either at the site or extrapolated from elsewhere. It is important to identify and address these dis-crepancies, however, to establish how the model may be im-proved.
At high solar activity, as has been shown earlier, there is more evidence of the PNA for most techniques in combina-tion with significantly higher semidiurnal components. For mid-latitude sites the most likely cause of the PNA has been identified as the influence of the semidiurnal tide (Buonsanto, 1991; Hagan, 1993). While in general the results presented here confirm a correspondence between the PNA and semid-iurnal components, it is clear that the detail reveals contra-dictions. In particular, the CTIM results show that the in-crease in evidence of the PNA is matched by a dein-crease in semidiurnal component. The prominence of the PNA there-fore appears to be not just controlled by solar activity, but also the balance between the diurnal and semidiurnal compo-nents in the winds. The apparently anomalous CTIM results then reflect a predicted balance of forces not repeated in the empirical climatologies.
There is also a clear phase shift in the CTIM winds com-pared with all of the other climatologies in most seasons. Northward winds are seen earlier in the day and the midnight
maximum appears earlier. This again is likely to be due to a poor representation of the momentum forcing terms by the average electric field model, as was explained in Sect. 4.1 of the companion paper. This would then produce a balance in the forces that is unrepresentative of the actual balance at this location, resulting in winds that are shifted in phase by respect to the actual winds.
Despite these limitations to the realistic modelling of the upper atmosphere, the ability to extract the individual forc-ing terms from CTIM allows for tests of the fundamental physics controlling the thermosphere as represented in the model. In this manner the ways in which the model may be improved can be addressed. For example, the representation of the high-latitude energy inputs and also the ion drag calcu-lations can be addressed by taking into account the work of Codrescu et al. (2000), who have parameterized the random electric field fluctuations to increase the Joule heating appro-priately. Updated model output will then be compared to the measured climatologies presented here. While the model is not intended to be a perfect match for the measurements, this should produce a more realistic representation of the changes in the high-latitude thermosphere to the level of geomagnetic activity, and hence, the representation of the neutral winds.
Miller et al. (1997) found that the HWM winds were nearly independent of the F10.7 values, except at high
mag-netic latitudes. The small variation between the HWM winds at high and low solar activities shown in this study contrasts with a sizeable variation seen in the majority of the other cli-matologies, including all of the experimentally derived ones (EISCAT-ISR, EISCAT-MWM, FPI). The HWM results can be explained in this context by reference to the data which have been included in the model formulation. For the high-latitude European longitudinal sector the only contributing winds come from EISCAT and an FPI at Svalbard. However, the EISCAT data only covers the region from 100 to 120 km in the lower thermosphere. The Svalbard data is from peri-ods of moderate to high solar activity and only for the winter season. Thus, the similarity of HWM winds at high and low solar activity points to a lack of coverage of low solar activ-ity conditions in the data set for this location. Further, the strongest seasonal response is seen in winter at high solar activity when the results are closest to this contributing data set. There is also clear evidence that the variations in di-urnal amplitudes produced by HWM are not large enough to match those found in the results from the measurement-based techniques. Khachikjan et al. (1997) found that even at mid-latitudes HWM winds produce diurnal amplitude variations which were too small in comparison to winds derived using IRI model results.
Miller et al. (1997) also suggest that, although the lati-tude dependence of the HWM winds and those derived from ionosonde data are similar, there are large differences in ab-solute values that could be caused by the dominance of the American sector in the HWM data set. They also find large differences between HWM winds and those derived from ionosonde winds at high magnetic latitude in both hemi-spheres. This study shows that the MWM-IRI climatologies
are consistent with HWM, but the measured climatologies and the theoretical CTIM climatologies do not follow the same trend as these global models.
A possible source of systematic discrepancies when us-ing the MWM may be in the application of the FLIP model at this latitude. The intended range for the MWM is from 15◦ to 70◦ in geomagnetic latitude and so Tromsø (CGM latitude=67◦) is right at the edge of the intended application of the model. The balance heights chosen by the MWM, based on the parameterised FLIP output and the various in-put parameters, may be considered as the most likely factor to suffer from errors in this regard. However, examination of the climatologies derived using the MWM from two dif-ferent sources, i.e. the EISCAT hmF2 and IRI hmF2 values, shows large differences in an individual season and activity level (Figs. 1–8). These differences are evident in both am-plitude and phase, and lead to the conclusion that any influ-ence of the FLIP model outputs in shaping the climatologies artificially is much less than the difference arising from the use of different input data sets. Hence, there is no evidence from the climatologies presented here (EISCAT-MWM and MWM-IRI) that the use of the FLIP model introduces any systematic influence on the derived winds when using the MWM.
In the companion paper the EISCAT-MWM winds were examined for evidence of overestimated northward winds at sunrise and morning, which have been suggested as a con-sequence of implementing servo theory by Titheridge (1993, 1995a). There was no consistent evidence of this effect found in the EISCAT-MWM winds. Interestingly, however, the MWM-IRI derived winds do show a consistent post-sunrise increase in northward winds to higher northward values than is evident in the EISCAT-ISR winds. This is true for all but the winter season, high solar activity case for which the winds in this period are similar. This indicates that while the IRI modelled hmF2 values seem to suffer from the problems identified by Titheridge when deriving neutral winds, the ef-fects are not apparent when using measured values of hmF2.
6 Conclusions
In gathering the conclusions from both this paper and its companion some important results have been found regard-ing the comparison of these techniques. There are clear dif-ferences at this high-latitude site between the solar activity dependencies of the diurnal amplitude and mean, and also the amplitude of nighttime equatorward winds as derived by the various techniques. Larger semidiurnal components at high solar activity than at low solar activity are seen in both EISCAT-ISR and EISCAT-MWM winds. These results will be used to investigate the energetic sources of these compo-nents, in conjunction with the CTIM model.
The HWM model, which is the most often used model when measured neutral winds are unavailable, has been shown to lack sensitivity to both the seasonal and solar ac-tivity conditions at high-latitudes. In order to address this
failing it is apparent that further revisions of this model should include contributions both from the FPI database of direct measurements and that available from the EISCAT thermospheric measurements, to complete the diurnal and seasonal coverage.
The CTIM winds presented here from standard runs of the model have shown systematic differences to the measured techniques. While the model output is not intended to be a simulation of the upper atmosphere in terms of matching all empirical measurements in all conditions, the differences in the trends with season and solar activity need to be addressed. One of the problems contributing to these differences has been identified as the use of average electric field models that produce systematic over-or underestimations in the ion drag and pressure gradient terms. When these issues are ad-dressed by, for instance, the inclusion of new electric field implementations that allow for the rapid variation of plasma flow, as suggested by the work of Codrescu et al. (2000), the results may be tested again by reference to the other results presented here.
The MWM-IRI technique agrees well with previous stud-ies at mid-latitudes by Hedin et al. (1994) and the more global study of Miller et al. (1997), but these findings are contradicted by all of the climatologies based on local mea-surements (EISCAT-ISR, EISCAT-MWM and FPI), except for the diurnal mean, where EISCAT-ISR also agree with the MWM-IRI. This leads to the conclusion that this model is overly dominated by mid-latitude measurements and cannot be used as a reliable source of hmF2 from which to derive winds for high-latitudes.
Acknowledgements. This work has been financially supported by a
number of UK Particle Physics and Astronomy Research Council grants. EISCAT is supported by funding bodies in the UK, Finland, Norway, Sweden, France, Germany and Japan. The authors would like to thank Kent Miller for providing the MWM program, Chris Davis at Rutherford Appleton Laboratory (RAL) for providing the routines used to run the INDI analysis and part of the EISCAT data analysis, Richard Stamper of the WDC C1 at RAL for providing the Kiruna digisonde data and the staff of the IRF at Kiruna for their years of support of the Kiruna FPI.
Topical Editor U.-P. Hoppe thanks M. Kosch and two other ref-erees for their help in evaluating this paper.
References
Anderson, D. N., Buonsanto, M. J., Codrescu, M., Decker, D., Fe-sen, C. G., Fuller-Rowell, T. J., Reinisch, B. W., Richards, P. G., Roble, R. G., Schunk, R. W., and Sojka, J. J.: Intercomparison of physical models and observations of the ionosphere, J. Geophys. Res., 103, 2179–2192, 1998.
Aruliah, A. L., Farmer, A. D., Rees, D., Brandstrom, U.: The Sea-sonal Behaviour of High-Latitude Thermospheric Winds and Ion Velocities Observed Over One Solar Cycle, J.Geophys.Res., 101, 15 701–15 711, 1996.
Buonsanto, M. J.: Observed and calculated F2 peak heights and derived meridional winds at mid-latitudes over a full solar cycle, J. Atmos. Terr. Phys., 52, 223–240, 1990.
Buonsanto, M. J.: Neutral winds in the thermosphere at mid-latitudes over a full solar cycle: A tidal decomposition, J. Geo-phys. Res., 96, 3711–3724, 1991.
Buonsanto, M. J., Codrescu, M., Emery, B. A., Fesen, C. G., Fuller-Rowell, T. J., Melendez-Alvira, D. J., and Sipler, D. P.: Com-parison of models and measurements at Millstone Hill during the January 24–26, 1993, minor storm interval, J. Geophys. Res., 102, 7267–7277, 1997a.
Buonsanto, M. J., Starks, M. J., Titheridge, J. E., Richards, P. G., and Miller, K. L.: Comparison of techniques for derivation of neutral meridional winds from ionospheric data, J. Geophys. Res., 102, 14 477–14 484, 1997b.
Codrescu, M. V., Fuller-Rowell, T. J., Foster, J. C., Holt, J. M., and Cariglia, S. J.: Electric field variability associated with the Millstone Hill electric field model, J. Geophys. Res., 105, 5265– 5273, 2000.
Duboin, M.-L. and Lafueille, M.: Thermospheric dynamics above Saint-Santin: statistical study of the data set, J. Geophys. Res., 97, 8661–8671, 1992.
Emery, B. A.: Neutral thermospheric winds deduced above Mill-stone Hill, 2, Seasonal wind variations, 1970–1971, J. Geophys. Res., 83, 5704–5716, 1978.
Fuller-Rowell, T. J., Rees, D., Quegan, S., Moffett, R. J., Bailey, G. J.: Simulations of the seasonal and UT variations of the ther-mosphere and ionosphere using a coupled, three-dimensional, global model, Pur. A. Geoph., 127, 189–217, 1988.
Griffin, E. M., Aruliah, A. L., M¨uller-Wodarg, I. C. F., Aylward, A. D.: Comparison of high-latitude Thermospheric Meridional Winds I: Optical and radar experimental comparisons with theo-retical forcings, Ann. Geophys., 3, 849–862, 2004.
Hagan, M. E.: Quiet time upper thermospheric winds over Mill-stone Hill between 1984 and 1990, J. Geophys. Res., 98, 3731– 3739, 1993.
Hedin, A. E., Spencer, N. W., and Killeen, T. K.: Empirical global model of upper thermosphere winds based on Atmosphere and Dynamics Explorer satellite data, J. Geophys. Res., 93, 9959– 9978, 1988.
Hedin, A. E., Biondi, M. A., Burnside, R. G., Hernandez, G., John-son, R. M., Killeen, T. L., Mazaudier, C., Meriwether, J. W., Salah, J. E., Sica, R. J., Smith, R. W., Spencer, N. W., Wick-war, V. B., Virdi, T. S.: Revised Global Model of Thermospheric Winds Using Satellite and Ground-Based Observations, J. Geo-phys. Res., 96, 7657–7688, 1991.
Hedin, A. E., Buonsanto,M. J., Codrescu, M., Duboin, M.-L., Fe-sen, C. G., Hagan, M. E., Miller, K. L., and Sipler, D. P.: So-lar activity variations in midlatitude thermospheric meridional winds, J. Geophys. Res., 99, 17 601–17 608, 1994.
Hedin, A. E., Fleming, E. L., Manson, A. H., Schmidlin, F. J., Av-ery, S. K., Clark, R. R., Franke, G., Fraser, J., Tsuda, T., Vial, F., and Vincent, R. A.: Empirical wind model for the upper, mid-dle and lower atmosphere, J. Atmos. Terr. Phys., 58, 1391–1403, 1996.
Igi, S., Olive, W. L., and Ogawa, T.: Solar cycle variations of the thermospheric meridional wind over Japan derived from mea-surements of hmF2 , J. Geophys. Res., 104, 22 427–22 431, 1999. Khachikjan, G. Ja., Pogoreltsev, A. I., and Drobjeva, Ja. V.: Mean thermospheric winds at middle latitudes of the Northern Hemi-sphere derived from longitudinal variations of the F2-layer peak height, J. Atmos. Solar-Terr. Phys., 59, 1391–1403, 1997. Killeen, T. L., Roble, R. G., and Spencer, N. W.: A computer model
of global thermospheric winds and temperatures, Adv. Space Res., 7, 207, 1987.
Lal, C.: Seasonal trend of geomagnetic activity derived from solar-terrestrial geometry confirms an axial-equinoctial theory and re-veals deficiency in planetary indices, J. Atmos. Terr. Phys., 58, 1497–1506, 1996.
Miller, K. L., Lemon, M., and Richards, P. G.: A meridional wind climatology from a fast model for the derivation of meridional winds from the height of the ionospheric F2 region, J. Atmos. Terr. Phys., 59, 1805–1822, 1997.
Richards, P. G.: An improved algorithm for determining neutral winds from the height of the F2 peak electron density, J. Geo-phys. Res., 96, 17 839–17 846, 1991.
Salah, J. E. and Holt, J. M.: Midlatitude thermospheric winds from incoherent scatter radar and theory, Radio Sci., 9, 301–313, 1974.
Titheridge, J. E.: Mean meridional winds in the ionosphere at 70◦N, Planet. Space Sci., 39, 657–669, 1991.
Titheridge, J. E.: Atmospheric winds calculated from diurnal changes in the mid-latitude ionosphere, J. Atmos. Terr. Phys., 55, 1637–1659, 1993.
Titheridge, J. E.: The calculation of neutral winds from ionosphere data, J. Atmos. Terr. Phys., 57, 1015–1036, 1995a.
Titheridge, J. E., Winds in the ionosphere – a review, J. Atmos. Terr. Phys., 57, 1681–1714, 1995b.
Witasse, O., Lilensten, J., Lathuillere, C., and Pibaret, B.: Merid-ional thermospheric neutral wind at high-latitude over a full solar cycle, Ann. Geophysicae , 16, 1400–1409, 1998.