HAL Id: tel-03198755
https://tel.archives-ouvertes.fr/tel-03198755
Submitted on 15 Apr 2021HAL is a multi-disciplinary open access
archive for the deposit and dissemination of sci-entific research documents, whether they are pub-lished or not. The documents may come from teaching and research institutions in France or abroad, or from public or private research centers.
L’archive ouverte pluridisciplinaire HAL, est destinée au dépôt et à la diffusion de documents scientifiques de niveau recherche, publiés ou non, émanant des établissements d’enseignement et de recherche français ou étrangers, des laboratoires publics ou privés.
Tuning forks in photoacoustic spectroscopy :
Comparative study and new developments
Maxime Duquesnoy
To cite this version:
Maxime Duquesnoy. Tuning forks in photoacoustic spectroscopy : Comparative study and new devel-opments. General Physics [physics.gen-ph]. Université Paris-Saclay, 2021. English. �NNT : 2021UP-ASP022�. �tel-03198755�
Thè
se de
doctorat
: 2021UP ASP022Mise en œuvre de diapasons en
spectroscopie photoacoustique
: Étude comparative et
nouveaux développements
Tuning forks in photoacoustic spectroscopy:
Comparative study and new developments
Thèse de doctorat de l’université Paris-Saclay
École doctorale n◦ 572, Ondes et Matière (EDOM) Spécialité de doctorat : Physique Unité de recherche : Université Paris-Saclay, ONERA, Physique, Instrumentation, Environnement, Espace, 92322, Châtillon, France. Référent : Faculté des sciences
Thèse présentée et soutenue à Paris-Saclay, le 30/03/2021, par
Maxime Duquesnoy
Composition du jury :
Delphine Marris-Morini Présidente
Professeur, C2N Paris-Saclay
Aurore Vicet Rapporteur & Examinatrice Maître de conférence, IES Montpellier
Virginie Zéninari Rapporteur & Examinatrice Professeur, GSMA Reims
Guillaume Aoust Examinateur & tuteur entreprise Ingénieur-chercheur, Mirsense
Wolfgang Schade Examinateur
Professeur, IEPT Clausthal University of Technology & Fraunhofer HHI
Antoine Godard Directeur de thèse
Maître de recherche, ONERA
Jean-Michel Melkonian Co-Encadrant
Maître de recherche, ONERA
Tuning forks in photoacoustic
spectroscopy: Comparative study and new
developments
PhD Thesis Paris-Saclay University
Maxime DUQUESNOY
Résumé en Français
(French summary)
La spectroscopie photoacoustique est une technique offrant un fort potentiel de détection multi-gaz. La détection est effectuée dans le domaine acoustique au moyen de microphones plutôt que dans le domaine optique à l’aide de photodétecteurs, rendant la détection indépendante de la longeur d’onde optique. En vue d’améliorer la détection acoustique, des résonateurs mécaniques de géométries très diverses peuvent être couplés à des résonateurs acoustiques. Le but de cette thèse est d’étudier l’utilisation de ces résonateurs en vue de comprendre les phénomènes physiques mis en jeu. Plus particulièrement, l’objectif est d’estimer la limite de sensibilité de diapasons en quartz seuls ou couplés à des résonateurs acoustiques et de les comparer aux autres capteurs photoacoustiques existants.
Dans ce manuscrit, un état de l’art exhaustif des différentes techniques photoacoustiques est mené, incluant les travaux ayant déjà été effectués à l’ONERA : la MPAS (Microphone based PhotoAcoustic Spectroscopy) qui utilise des microphones pour la détection, la CEPAS (Cantilever-Enhanced PhotoAcoustic Spectrocopy) qui utilise des poutres et la QEPAS (Quartz-Enhanced PhotoAcoustic Spectrocopy) qui utilise des diapasons en Quartz. Les limites de détection rapportées dans la litérature sont calculées et comparées. La technique QEPAS y est présentée de manière plus détaillée à travers une description des différents diapasons, résonateurs acoustiques et méthodes de détection utilisés dans la litérature.
Un modèle analytique et éléments finis pouvant décrire les différents résonateurs acoustiques ou mécaniques est présenté. Ce modèle est validé expérimentalement pour les différentes techniques (MPAS, CEPAS et QEPAS). Notamment, pour chacune, les systèmes présentant une sensibilité à l’état de l’art sont analysés. Ainsi, en MPAS et CEPAS, les constantes de cellule sont dérivées ainsi que le rapport signal-à-bruit normalisé des détecteurs. En QEPAS, la sensibilité de plusieurs diapasons est évaluée et comparée expérimentalement. Pour chaque système les modèles analytiques et éléments finis démontrent un bon accord sur les nombreux systèmes évalués. Cependant, les phénomènes menant à la sensibilité de chaque technique restent peu clairs. Notamment, la sensibilité ultime de la QEPAS est dégradée d’un ordre de grandeur par rapport aux autres techniques. Afin de comprendre cette limitation, un nouveau modèle unifié est décrit. Ce modèle introduit différents facteurs tels que la chaleur généréé, le recouvrement de l’onde de pression sur le détecteur ou le rapport signal-à-bruit normalisé.
Grâce à l’évaluation des ces facteurs, nous avons déterminé l’origine des limitations de sensibilité actuelles de chaque technique. Pour la MPAS, les microphones sont sensibles au fond ambiant, qui varie et empêche sa suppresion. Pour la CEPAS, les cellules utilisées dans la litérature sont non-résonnantes entraînant une pression plus basse qu’en MPAS avec des cellules similaires. Pour la QEPAS enfin, le recouvrement de l’onde de pression acoustique sur le diapason est en général mauvais, de plus le couplage de cellules de faible facteur de qualité à des diapasons possédant un fort facteur de qualité induit une réduction intrinsèque du rapport signal-à-bruit normalisé. Afin de compenser ces limitations en QEPAS, deux nouveaux développements sont présentés. Le premier est la configuration "in-plane" permettant de maximiser le recouvrement acoustique-mécanique. Cette configuration est testée à l’aide d’un diapason ONERA en double passage dans l’interbranche et démontre une sensibilité de l’ordre de l’état de l’art. Le deuxième est l’utilisation d’un résonateur radial couplé à un diapason, améliorant le recouvrement acoustique-mécanique. Ce système démontre une sensibilité similaire à l’état de l’art
avec des contraintes de mises en oeuvre fortement réduites. Enfin, à l’aune de ces nouveaux développements, un positionnement des techniques photoacoustiques est extrait, permettant de déterminer l’intérêt respectif de chaque technique et les perspectives d’améliorations.
Pour terminer, un schéma de détection innovant en boucle fermée est décrit et modélisé. Le diapason est mis en oscillation à l’aide d’un circuit électrique. La force photoacoustique appliquée sur le diapason engendre un décalage de la fréquence de l’oscillateur que l’on mesure. Un déphasage contrôlé dans la boucle oscillatrice permet la mise en place d’une mesure différentielle en un temps nettement inférieur aux schémas conventionnels. Ce différentiel serait alors utile pour réduire les fonds sonores et vibratoires ambients ainsi que pour compenser les dérives du capteur. Les performances de cette nouvelle méthode sont mesurées expérimentalement : facteur d’échelle, linéarité, et sensibilité. Nous avons alors démontré que aa sensibilité n’était pas dégradée par rapport à la mesure traditionnelle. Cette méthode devra par la suite être étudiée plus en profondeur pour l’intégrer au sein de capteurs industriels. On devra notamment démontrer l’amélioration de la compensation des dérives, de la réduction des fonds et la possibilité de calibrage du capteur en temps réel.
Remerciements
(Acknowledgments)
Un peu plus de trois années de travail se sont enfin concrétisées. Mon travail n’aurait pas été possible sans beaucoup de personnes ni aussi agréable sans beaucoup d’autres. Je tenais donc à tous vous remercier !
Tout d’abord merci à toi Antoine pour avoir toujours suivi l’avancement de mes travaux et les avoir réori-entés au besoin. Tu m’as aidé à m’améliorer grâce à ta grande rigueur et ta vision plus générale de directeur scientifique. Je réalise avoir eu beaucoup de chance de t’avoir eu comme directeur de thèse. Tu t’es vraiment impliqué dans ma thèse et toujours avec le sourire.
Je tenais également à remercier l’équipe de mes encadrants qui était une véritable famille recomposée.
Tout d’abord Jean-Michel, tu m’as aidé dès le début pendant mon stage à comprendre les choses et à mettre les mains dans les expériences. Dès que j’avais le moindre soucis je venais te voir et tu laissais tout tomber pour venir m’aider ou m’expliquer quelque chose et encore une fois j’étais chanceux de t’avoir comme encadrant. Tes capacités de bricoleur ont bien servi, même si parfois j’avais peur que tu démontes tout quand tu arrivais avec tes tournevis ! Je me souviendrai aussi t’avoir rendu malade avec des fraises Tagada®, du coup je te ferai moins
de gâteaux cette année !
Ensuite merci à Raphaël, tu m’as expliqué beaucoup de choses au tableau malgré la malédiction des feutres qui ne fonctionnent jamais. A chaque fois que je venais à Châtillon tu avais de nouvelles idées de brevets. Bon il y en a très peu qui ont abouti mais on voit bien que tu t’es beaucoup impliqué dans la photoacoustique et que tu sais même faire toutes les simulations maintenant. Merci aussi de m’avoir aidé en électronique et d’avoir ensemble démontré et étudié le principe de la détection active. Merci aussi pour les nombreux fous rires nerveux à chaque fois que tu m’expliquais quelque chose. Enfin je tiens à te féliciter pour ta fibre écologique, puisque tu finis toujours les gâteaux qui traînent en salle de pause et ça empêche le gâchis !
Enfin, merci à toi Guillaume de m’avoir acceuilli chez Mirsense. Tu m’as poussé à me dépasser à chaque fois pour améliorer ma rigueur scientifique et je pense avoir progressé même si ça n’a pas toujours été facile. Tu as égale-ment dès le début eu de bonnes idées pour comprendre la photoacoustique, ce qui a permis à la fin l’obtention des supers résultats présentés dans cette thèse. Enfin merci pour m’avoir fait découvrir la MPAS et j’espère que tu te souviendras du jour où je t’ai fais entendre à l’oreille l’effet photoacoustique avec la cellule Mirsense ! J’ai aussi beaucoup appris à bricoler chez Mirsense avec toi, le scotch double face et la perçeuse sont nos amis. Je tenais également à remercier mes deux rapporteurs Aurore Vicet et Virginie Zéninari. C’était un plaisir d’avoir votre avis sur mon travail à travers vos rapports très détaillés et nos discussions. J’espère que nous pourrons de nouveau nous rencontrer pour échanger sur la photoacoustique !
Merci également aux autres membres du jury qui ont accepté d’évaluer mon travail. Merci à Delphine Marris-Morini d’avoir présidé mon jury et d’avoir été si agréable. Special thanks to Wolfgang Schade as well as to Ulrike Willer for agreeing to review my work. Your participation was important for us. I hope we will have the pleasure to talk again together.
mentions spéciales.
Merci à Olivier Le Traon, pour l’intérêt que tu as mis dans mes travaux et mes présentations aussi longues soit elles. Merci aussi d’avoir voulu me garder et de m’avoir soutenu dans la création de mon projet SATT. Tu es notre gourou des résonateurs en quartz et plus particulièrement des gyros, j’attends donc avec impatience tes nouveaux résultats.
Merci à Svetlana et toute l’équipe de la SATT Paris-Saclay pour m’avoir accompagné dans la création de mon dossier jusqu’à son acceptation !
Merci à Weidong pour votre gentillesse et pour nos discussions.
Merci également à Roman Rousseau, nous avons passé nos thèses en même temps sur le même sujet et c’était très agréable de pouvoir discuter avec toi. Tu possèdes une grande rigueur scientifique et je te souhaite tout le meilleur pour la suite.
Merci également à tous ceux qui sont venus assister à ma soutenance. De Dunkerque, Reims, Paris, Grenoble et Montpellier, la France a de la chance de possèder tant d’experts dans ce domaine ! J’espère que nous nous croiserons plus tard et bon courage à tous les doctorants qui fournirez, j’en suis sûr, des travaux très intéressants. Enfin merci à ma famille qui m’a soutenu pendant tout ce temps et ces périodes plus ou moins difficiles et à mon chien qui me rend toujours de bonne humeur.
Passons dorénavant à mes collègues de Mirsense ! Merci à Françoise qui est la première personne a m’avoir acceuilli et qui était notre maman à tous. Merci à Mathieu d’avoir suivi ma thèse et de m’avoir soutenu dans ma démarche de projet SATT. Je tiens également à remercier Greg, c’était vraiment très agréable de travailler avec toi. Merci Ali, tu m’as vraiment bien aidé dès le moment où j’ai dû manipuler des lasers. Ta grande expérience en industrie optique m’a permis de réapprendre les bases pour construire des beaux bancs bien alignés, et aussi les bases du taraudage et de la mécanique. Ca me servira très longtemps ! Merci à Maxime G. Faire nos thèses en parallèle était une bonne occasion pour nous de discuter et c’était agréable de pouvoir partager nos expériences à la pause café. Merci à tous les autres, Matthieu pour tes bières même si j’aime pas vraiment ça, Laureline pour avoir illuminé le labo dès ton arrivée, Johan pour ta gentillesse, Viktoriya pour ton aide, Adrien pour tes blagues pas toujours drôles, Ludo pour ton incroyable sympathie et beaucoup d’autres que j’ai peut être moins côtoyé ; Fahem, Mickael, Florian, Paula, David, Pierre, Zheng, Bilal, Olivier, Sullivan ainsi que les très nombreux stagiaires que j’ai vu passer. Enfin, je retiendrai les activités de groupes ! Le karting et les quelques bleus, l’accrobranche que je n’aurais jamais fait tout seul et où j’ai battu mon vertige. Enfin et surtout le laser game qui était génial ainsi que le restaurant après dans lequel j’ai réussi à manger pour la première fois depuis très longtemps.
Au tour de mes collègues de l’ONERA à Palaiseau. Merci à Myriam pour avoir suivi mes travaux et avoir cherché des idées novatrices. Merci à Alex, notre chef sympa qui rigole tout le temps, c’est à chaque fois un plaisir de venir te voir. Jean-Pierre, que dire ? Je ne vais pas t’envoyer un mail pour te remercier, j’aurais trop peur de déclencher des virus sur ton pc ! Merci pour m’avoir aidé pour la mécanique et les bouteilles de gaz (ouf nous sommes toujours vivants). C’était très agréable de pouvoir discuter avec toi tous les jours, tu es un peu devenu mon papi. Ca y est, j’ai passé ma thèse tu peux prendre ta retraite si tu veux. Merci à mes quelques stagiaires, Guillaume, Hugo et Julien qui m’avez aidé. Il y a encore beaucoup de personnes à remercier; JB, Nelly, Quentin, Rosa, Christophe, Cedric, Philippe, Hélène, Gautier, Alexis, Nassim, Mickael, Yannick, Sylvain, Marie, Florence... mais j’aurais encore le temps de vous le dire en personne ! Enfin mention spéciale aux doc-torants. Les anciens ; Julie et les éléments perturbateurs Thomas, Vincent, Jérèmy et Guillaume qui mangeait des sandwichs beurre harrissa tous les midis, quelle horreur. Et les nouveaux doctorants plus sympas les uns que les autres (il ne faut pas se faire d’ennemis) ; Jonas, Elodie, Jeanne, Pier-Henri et la ptite dernière Eve-Line, je vous soutiendrai pendant vos années de thèse restantes.
On en vient enfin à mes collègues de l’ONERA à Châtillon. Les meilleurs pour la fin ? Merci à Thomas, tu es le grand frère que je n’ai jamais eu. Derrière tes apparences ronchonnes tu es un nounours. Tu m’as bien
aidé pour les simulations, pour les scripts Python, et beaucoup d’autres choses alors merci encore. J’espère te voir un peu plus malgré le confinement et aussi que tu iras mieux, je pense à qui tu sais. Merci à Marc, Claude et Vincent pour avoir réalisé les résonateurs que j’ai utilisé pendant ma thèse, de l’usinage au cablage. Votre travail est la base de nos résultats et vous le faites toujours dans la bonne humeur ! Merci également à Andrea et Jean d’avoir travaillé avec nous sur la programmation FPGA. Pour terminer avec les permanents, je n’oublierai pas Paul, le maître patissier de l’unité, Pierre, le jumeau maléfique de Raphaël finisseur de gâteaux, Amandine qui nous illumine tous par son sourire et Béatrice qui m’a aidé au début de ma thèse. Je me souviendrai des anciens doctorants, Lucas, Léopold et Amina, j’espère que vous trouverez un emploi qui vous convienne. Pour terminer, les plus jeunes, les cyclistes Vincent et Charles que j’apprécie beaucoup même si je ne vous vois pas souvent et Margot qui je l’espère m’apprendra des choses sur le HF2LI. Tout cela sans compter les nombreux stagiaires avec qui j’ai pu travailler et Lucie qui je l’espère appréciera son stage.
Voilà je pense n’avoir oublié personne ! J’espère que vous avez apprécié ma companie durant tout ce temps et mes gâteaux. Je suis bien content de rester avec des équipes aussi sympathiques pendant encore un an. Nous ferons, je l’espère, des choses formidables. Alors à très bientôt !
Contents
Introduction 1
1 Photoacoustic state of the art 17
1.1 Microphone based photoacoustic spectroscopy: MPAS . . . 17
1.1.1 Microphones . . . 17
1.1.2 Acoustic amplification cells . . . 19
1.1.2.1 Simple cylindrical cells . . . 19
1.1.2.2 Differential cells. . . 21
1.2 Cantilever enhanced photoacoustic spectroscopy: CEPAS . . . 23
1.2.1 Cantilevers . . . 23
1.2.2 Acoustic amplification cells . . . 24
1.3 Quartz enhanced photoacoustic spectroscopy: QEPAS. . . 25
1.3.1 Watch tuning forks . . . 25
1.3.2 Custom tuning forks . . . 26
1.3.3 Coupling of acoustic resonators with QTFs. . . 29
1.4 Different signal processing methods. . . 32
1.4.1 Background compensation: MOCAM. . . 32
1.4.2 Electrical excitation for calibration and gas relaxation measurement . . . 33
1.4.3 Beat-frequency QEPAS . . . 34
1.5 In the industry . . . 35
1.6 State of the art at ONERA . . . 36
1.6.1 Modelling . . . 36
1.6.2 Custom QTFs . . . 37
1.6.3 Acoustic resonators . . . 38
2 Photoacoustic analytical and finite element modelling 39 2.1 Analytical model description . . . 39
2.1.1 Laser excitation . . . 40
2.1.2 Absorption by the gas and heat generation. . . 41
2.1.2.1 Gas absorption . . . 41
2.1.2.2 Molecular relaxation . . . 42
2.1.2.3 Heat source modulation . . . 42
2.1.3 Acoustic pressure generation . . . 44
2.1.3.1 In free space . . . 45
2.1.3.2 In acoustic resonators. . . 46
Pressure distribution . . . 46
Resonance frequency . . . 46
Acoustic quality factors . . . 47
Cell constant . . . 49
2.1.4 Acoustic pressure detection with mechanical resonators . . . 50
2.1.4.2 Quality factors . . . 51
2.1.4.3 Beam displacement . . . 53
2.1.4.4 Photoacoustic force. . . 54
2.1.4.5 Vibroacoustic coupling of acoustical and mechanical resonators . . . 55
2.1.4.6 Brownian motion and SNR . . . 56
2.1.5 The particular case of microphones . . . 56
2.1.5.1 Microphone sensitivity . . . 56
2.1.5.2 Microphone noise and SNR. . . 57
2.1.6 Signal processing . . . 58
2.1.6.1 Equivalent electric model . . . 58
2.1.6.2 Signal amplification . . . 58
2.1.6.3 Lock-in detection . . . 59
2.1.7 NNEA . . . 60
2.2 Modelling photoacoustics by FEM . . . 61
2.2.1 Mechanical resonator modelling. . . 61
2.2.1.1 Modal analysis . . . 61
2.2.1.2 Harmonic analysis. . . 62
2.2.2 Acoustic modelling . . . 62
2.2.2.1 Acoustic source . . . 62
2.2.2.2 Acoustic boundaries. . . 63
2.2.2.3 Acoustic resonator quality factor . . . 63
2.2.3 Vibroacoustic interaction modelling. . . 64
2.2.4 Conclusion . . . 64
2.3 Definition of a new unified modelling . . . 65
2.3.1 Heat source H. . . 65
2.3.2 Pressure generation: laser constant CL . . . 65
2.3.3 Pressure amplification and cell constant: amplification factor As . . . 66
2.3.4 Acoustic-mechanic overlap ηs . . . 67
2.3.5 Vibroacoustic efficiency εva . . . 67
2.3.6 Normalised signal to noise ratio SNR1Pa . . . 68
2.3.7 SNR . . . 68
2.4 Conclusion . . . 69
3 Comparison through experiments for representative cases 71 3.1 Study of typical MPAS and CEPAS setups . . . 71
3.1.1 Microphones and cantilevers analytical signal-to-noise ratio . . . 71
3.1.1.1 Determination of the SNR at 1 Pa of commercial microphones. . . 71
3.1.1.2 Determination of the SNR at 1 Pa of cantilevers . . . 72
3.1.2 Analytical cell constant and sensitivity using simple cylinder shaped resonators . . . 74
3.1.3 Comparison to experimental results. . . 75
3.1.3.1 MPAS sensors from the literature . . . 75
3.1.3.2 CEPAS sensors from the literature . . . 77
3.1.4 Study of differential MPAS setups . . . 79
3.1.4.1 Study cases parameters . . . 79
3.1.4.2 Analytical cell constant and sensitivity . . . 79
3.1.4.3 Comparison to experimental results . . . 80
In the literature . . . 80
Study of Mirsense’s differential cell . . . 82
3.2 Study of QEPAS setups . . . 86
3.2.1 The case of bare QTFs . . . 86
3.2.1.1 QTFs characteristics . . . 86
3.2.1.2 Analytical and FEM results. . . 87
Analytical determination of the frequency and quality factor . . . 87
Determination of the sensitivity. . . 90
3.2.1.3 Experimental comparison . . . 90
Experimental setup . . . 90
Modulation scheme . . . 92
Determination of the system limiting noise. . . 93
Experimental results for the on-beam configuration . . . 94
3.2.2 The case of QTFs coupled with acoustic resonators . . . 95
3.2.2.1 Watch QTF with longitudinal dual-tube microresonators . . . 95
Problem definition. . . 95
Theoretical study of the resonators coupling . . . 96
Experimental validation . . . 99
3.2.2.2 Custom QTF C2 with an acoustic recovery cavity . . . 101
Problem definition. . . 101
Recovery of the acoustic waves . . . 102
Determination of the sensitivity with the recovery cavity . . . 103
Sensitivity enhancement with dual tube resonators . . . 105
3.3 Conclusion . . . 110
4 Comparison of photoacoustic technologies through an unified modelling 113 4.1 Determination of the model factors for the three photoacoustic techniques. . . 113
4.1.1 Determination of the model factors for MPAS and CEPAS . . . 113
4.1.2 Determination of the model factors for QEPAS . . . 115
4.1.2.1 Bare QTFs . . . 115
Validation of ηs values for limiting cases . . . 115
Model factors for bare QTFs . . . 116
FEM modelling in static operation . . . 118
FEM modelling of the vibroacoustic interaction and discussion on εva . . 119
4.1.2.2 QTF coupling with acoustic resonators . . . 121
Computation of the normalised SNR at 1 Pa . . . 122
Watch QTF with dual tubes microresonators . . . 122
C2 with acoustic resonators. . . 124
4.2 New developments for QEPAS sensors . . . 125
4.2.1 In-plane configuration . . . 125
4.2.1.1 Analytical study. . . 125
4.2.1.2 In-plane double pass inside a custom QTF prong space . . . 126
4.2.2 A new radial resonator for QEPAS with C2 . . . 128
4.2.2.1 Design and analytical results . . . 128
Problem definition. . . 128
Theoretical study of the resonators coupling . . . 128
Computation of the model factors . . . 131
4.2.2.2 Experimental study of the system . . . 132
Measurement of the acoustic resonator quality factor . . . 132
Determination of the system limiting noise. . . 133
4.2.3 Conclusion . . . 135
4.3 Comparison of existing photoacoustic techniques . . . 136
4.3.1 Study of the limit of sensitivity . . . 136
4.3.1.1 Ultimate sensitivity of the mechanical pressure detector . . . 137
4.3.1.2 Sensitivity enhancement with acoustic resonators . . . 137
4.3.1.3 Overall sensitivity enhancement . . . 138
4.3.1.4 Perspectives. . . 139
MPAS sensors . . . 139
CEPAS sensors . . . 139
QEPAS sensors . . . 140
4.3.2 Frequency . . . 141
4.3.3 Sensitivity to the environment . . . 141
4.3.4 Compactness . . . 143
4.4 Conclusion . . . 144
5 Study of a new signal processing method for time stable and background-free photoacoustic measurements 147 5.1 Motivation and principle. . . 147
5.1.1 Motivation . . . 147
5.1.2 Principle . . . 148
5.2 Theoretical analysis of the method . . . 149
5.2.1 Signal generation . . . 149
5.2.1.1 Variation of frequency with phase . . . 149
5.2.1.2 Phase variation induced by force application. . . 151
5.2.1.3 Frequency variation induced by force application . . . 152
5.2.2 Frequency noise description using Leeson’s equation. . . 153
5.3 Experimental validation of the analytical model . . . 155
5.3.1 Implementation . . . 155
5.3.1.1 Proximity electronics . . . 155
5.3.1.2 Oscillator . . . 156
5.3.2 Noise measurements. . . 156
5.3.2.1 Experimental setup . . . 156
5.3.2.2 Determination of the limiting noise . . . 157
5.3.2.3 Influence of excitation voltage . . . 158
5.3.2.4 Influence of motional resistance . . . 159
5.3.3 Photoacoustic measurements . . . 160
5.3.3.1 Experimental setup . . . 160
5.3.3.2 Principle validation . . . 161
5.3.3.3 Influence of excitation voltage . . . 163
5.3.3.4 Influence of motional resistance . . . 165
5.3.3.5 Linearity with gas concentration . . . 165
5.3.3.6 Comparison with open loop detection . . . 166
Conclusion 169
Bibliography 185
List of publications 187
Appendices 195
A Material parameters 196
B Determination of microphone parameters from datasheets 199
Introduction
After two centuries of constant development and industrialisation, needs to control and regulate the impact of Human activity on the environment have emerged. As market studies suggest, sales of gas detection systems are increasing, representing several billion dollars a year (Frost and Sullivan 2013). Whilst technologies such as absorption spectroscopy have spread across the industry, none has yet demonstrated a good compromise, in terms of cost, sensitivity, size, etc., enabling to address the consumer market. This thesis aims at studying photoacoustic technologies that, through unique advantages, could spread over the entire gas detection market. More particularly we will focus our interest on quartz enhanced photoacoustic spectroscopy.
Needs and applications
Applications and needs for gas detection
From the industrial use to the consumer market, the range of applications is wide. However, the requirements are quite similar: a sensitive detection to quantify chemical species at the state of trace in a gas matrix. Needs and typical applications are presented in Figure 1.
Figure 1: Needs for gas detection in the main areas.
The main areas requiring gas detection are the industry and the environment. Typical applications are: atmospheric monitoring [1,2] (emissions from factories, cars, etc.), process optimisation, in which quantifying a gas resulting from a chemical reaction allows to adjust and increase the yields (surveillance of fruit maturation [3], etc.) or also the detection of leaks from electric power generators cooling systems [4].
prevent terrorist attempts in a tense international environment (airports, train stations surveillance, etc.). One could also quote the necessity for detecting gas warfare agents [5,6], although their use was prohibited in 1997 by the Chemical Weapons Convention. The need to protect infantry and populations is still present as it is necessary to detect and to prove the use of these chemical agents, as it was recently the case in Syria in 2013 and 2017 according to the United Nations.
Ultimately, very promising applications are foreseen in the medical area. In breath analysis, detection of bio-markers such as ethylene or nitrous oxide can lead to the early diagnosis of lung cancer, asthma or diabetes [1,7]. The use of photoacoustics in medicine, not only for gases but also for liquids and solids, such as blood analysis, tumor detection [8] and vascular imaging, will undoubtedly rise in the years to come, as the tremendous number of publications on the subject indicates.
Market requirements
In order to access the actual market, our aim is to study the most generic and simplest sensors. In this context, the instruments will have to satisfy as many of the following requirements as possible:
- ability to measure simultaneously several gases
- sensitivity, in the order of the part per billion range for most molecules
- excellent selectivity, so as to increase the sensor accuracy and decrease false alarms rates - reduced volume
- affordability
- assembly simplicity, to allow for mass production and cost reductions
As such, good compromises will have to be found and are part of the present work philosophy.
After having summed up all of the requirements for the actual gas detection market, we now have to choose the most adapted technology.
Existing technologies
In order to meet the global market demands, a lot of technologies are used nowadays.
However, to clarify our speech we need to make some distinctions. Let us specify that we distinguish laboratory instruments from embedded ones. Indeed, while laboratory instruments such as mass spectrometers present the highest sensitivities, they are, in contrast, completely inconsistent with field deployment because of their lack of compactness and their high cost. Furthermore, a distinction can be made between standoff and local detection. In this manuscript we focus on local detection only, through the use of embedded systems.
The most common embedded and local detection instruments rest upon different technologies, the main ones being:
- Tunable diode laser absorption spectroscopy (TDLAS) is the most straightforward laser absorption tech-nique. After passing through the sample once, the laser power is measured. Beer-Lambert-Bouguer’s law then allows to identify the sample by analysing the light extinction over wavelength and quantifying its concentration [9,10].
- Non dispersive infrared spectroscopy (NDIR) is similar to TDLAS. Instead of using a tunable laser, a wide band light source is used and filtered to select the desired wavelength, for which the absorption is measured [11].
- Cavity enhanced absorption spectroscopy (CEAS) [12], cavity ring-down spectroscopy (CRDS) [13], and multipass absorption spectroscopy [14], which relate to a family of laser spectroscopy techniques where an optical cavity or a multipass cell is used to enhance the absorption of a laser light by the sample. Beer-Lambert-Bouguer’s law or more specifically the optical cavity decay time for CRDS enable to analyse the sample.
- Fourier transform infrared spectroscopy (FT-IR) which is similar to the above mentioned techniques, however the source is usually not a laser, and the analysis is made through a Fourier transform of the sample absorption [15].
- Chemical sensors, using electrochemistry are the most widespread. One example of the future genera-tion of these is Graphene sensors [16]. Gas composition is then determined by measuring conductivity modifications of an atomic size film specialised to adsorb specific molecules.
- Flame spectrophotometry, which consists in the analysis of the sample combustion emitted light [17]. - Ion mobility spectroscopy (IMS), consisting in the ionisation and separation of gas components [18]. The
gas identification is then made by measuring the ions mobility in a carrier buffer gas.
- Gas chromatography, which uses the elution time of the gas components in a column [19,20].
- Photoacoustics based on microphone photoacoustic spectroscopy (MPAS) [21]. It is the most widespread photoacoustic technique in the industry, that we will extensively describe and investigate in this manuscript.
A comparison of these technologies over criteria of sensitivity, selectivity, multi-gas capacity, compactness and cost is presented in Table1. Concerning the sensitivity, a more complete study can be found in [22].
Technology Sensitivity Selectivity Multi-gas capacity Compactness Cost
Chemical Good Very bad Bad Very good Very Low
Flame spectrophotometry Very good Very bad Very good Good Average
IMS Very good Average Bad Average Average
Gas chromatography Very good Good Very good Bad High
TDLAS Good Very good Average Average Average
NDIR Average Average Good Very good Very low
CRDS Very good Good Bad Bad High
FT-IR Good Average Very good Average High
Photoacoustics Good Very good Very good Good Low
Table 1: Qualitative comparison of different gas detection methods for embedded instruments over criteria of sensitivity, selectivity, multi-gas measurement capacity, compactness and cost.
While these technologies are able to demonstrate very good sensitivities, only laser based techniques allow for good selectivity. Even fewer techniques enable good compactness and low cost applications. Among them, we take particular interest in laser based spectroscopy, especially photoacoustic spectroscopy (PAS) which, as we prove in this manuscript, is capable of meeting good compromises between the previously stated criteria.
Laser spectroscopy
Laser based spectroscopy relies on the principle of energy quantification. Each and every molecular species can be described by its spectrum, i.e. the quantization of its energy transitions distributed over an energy scale. One is then able to identify species in a molecular mix by analysing their energy distribution. These transitions can be achieved by the absorption of an external source of matching energy, such as a laser photon. Lasers are coherent electromagnetic sources that enable the change of their emission spectrum with a high precision, given their narrow emission bandwidth in wavelength. The most common method for quantification is direct absorption spectroscopy such as TDLAS. The principle is to measure the difference of laser power before and after the sample to be analysed. The identification of the molecular species is accomplished by sweeping the laser wavelength. The absorbed power is directly linked to the line strength of the targeted transition.
The molecular fingerprint region
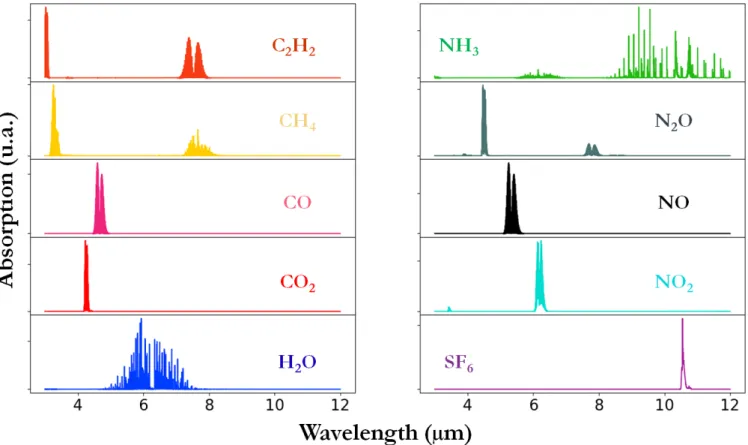
Most molecular species present strong absorption lines in the infrared region of the spectrum, reason why it is called the "molecular fingerprint region". In particular, in the mid-infrared, the region from 3 to 12 µm is very interesting. Indeed, many species present rovibrationnal transitions in this region as shown in Figure 2.
Figure 2: Absorption spectra for different target molecules in the mid-infrared region.
Available sources
To widely access the MIR several technologies exist, among which: quantum cascade lasers (QCL) and optical parametric oscillators (OPO), which principles are presented in Figure3.
Figure 3: Schematic principle of QCLs (left) and of a single signal-resonant OPO (right).
QCLs are semiconductor lasers using intersubband transitions. When a current is applied, electrons from the conduction band pass from one internal band to another, generating photons of matched energy. To increase the laser emission, this transition is repeated by design and so the electrons pass from one quantum well to another, provoking the "cascade effect". Their main advantages are their compactness, robustness and possibility to be produced at a large scale.
OPOs use optical non linearity allowing transformation of a wavelength into two complementary ones. A pump laser beam is introduced inside a cavity containing a non linear crystal. When the condition of quasi-phase-matching is met, the pump laser is partly converted into two coherent radiations, referred as signal and idler, satisfying the energy conservation principle. OPOs allow for a continuous tuning of the wavelength to access a wide spectral band.
The principle of photoacoustics
Part of the laser spectroscopy techniques, photoacoustics is the one we investigate in this manuscript.
In 1880, A.G. Bells discovers the photoacoustic effect in solids by exciting a Selenium sheet with the sun modulated light and by listening to the generated sound with his very ears [23]. Later on, the experiment was extended to liquids and gases. Five years after the telephone, the photophone was born, which Bell considered far greater. From this invention, Bell considered the selective detection of chemical species. It is only one century later, with the maturation of microphones and the invention of lasers in 1960 that the photoacoustic effect truly began to be exploited [24].
Principle
The principle of photoacoustics is presented in Figure 4.
First, a light source is time modulated, in amplitude or wavelength, at a frequency f. Then, the source passes through the gas to be analysed. Molecular species possessing an absorption line matching the light energy will absorb the light radiation leading to an unstable state. The excited molecules return into their fundamental level of energy after a rotation, translation or vibration. When working in the infrared at low pressure, the desexcitation through translations is the most probable [25, 26]. The periodic relaxation through translations then induces the creation of a periodic heating of the medium, at the frequency f, giving rise to acoustic waves of same period. A detector, such as a microphone, a cantilever beam or a tuning fork, will be set into vibration by the acoustic waves and operate the transduction towards an electric signal. Finally, this signal is processed, usually by demodulating it at the excitation modulation frequency.
Figure 4: Principle of photoacoustics.
While the firsts historically developed photoacoustic instruments used microphone enhanced technology (MPAS), new techniques based on the use of cantilevers (CEPAS) [27] and quartz tuning forks (QEPAS) [28] arose, leading to new possibilities in the area.
Advantages and drawbacks of this method
Photoacoustic spectroscopy benefits from several advantages: a very good selectivity, the possibility to enhance the signal by increasing laser mean power or the light-gas interaction path. Also, because we detect the sound and not the light, the method is totally achromatic, allowing to use any laser source with the same detector, whatever the light spectral range.
Other benefits are the wide linearity range of the signal with the gas concentration and a wide dynamic range from parts per billion to percents. Also, the technique is said to be a background-free technique, meaning that the signal must not be extracted from an existing background as in direct absorption spectroscopy. Lastly, the sensitivity does not depend on the volume, as first approximation, rendering possible compromises between sensitivity and compactness of the sensor.
However, PAS presents drawbacks such as the dependence to the gas matrix. The sound is generated thanks to the gas relaxation which in turn depends on the gas matrix (collision partners, pressure, etc...). Another draw-back is its sensitivity to external acoustic and vibratory draw-background noises, even though methods are developed to reduce it.
Problematic
Recently, quartz tuning forks have been introduced in PAS with the promise of enabling smaller and more sensitive sensors. While many research teams worked with watch tuning forks, fewer, including ONERA, focused
their research on the modelling and design of custom QTFs. The sensitivities of custom QTFs and watch QTFs are heterogeneous and hard to read. Besides, both present similar sensitivities which may suggest a physical limitation.
Also, to enhance their sensitivities, QTFs have been coupled to acoustic resonators. These resonators are usually tubes of small radius in which the laser beam passes, making the alignment difficult. Very few variations are found in the literature and the analysis of such coupled resonators is complex. It is thus difficult to determine if the design of more convenient or more sensitive resonators is possible.
Finally, a question resides, which is the one of the interest of using tuning forks in PAS or spectroscopy in general. Often, the use of QTFs is promoted over other detectors such as microphones but we will show through the literature that there is no clear evidence of their superiority.
Based on these observations we propose to study the use of quartz tuning forks in photoacoustic spectroscopy and possible improvements.
Context
Since 2013 ONERA showed its interest towards photoacoustic spectroscopy. A previous PhD thesis focused on the development of infrared laser sources and quartz tuning forks for photoacoustics, leading to founding material in the field [26]. Results of the previous work are detailed in Section1.6.
In the dynamic, my PhD thesis was held thanks to a special PhD convention allowing shared time between a company and a laboratory. This thesis was held at Mirsense and at ONERA.
Mirsense is a company born in 2015, composed of a team of nearly 20 persons, including 9 doctors and 3 PhD students. Mirsense’s business plan rests upon two main areas. First, the production and driving of custom QCLs for spectroscopy [29], emitting from 3 to 20 µm, or Defense applications [30]. Second, the development of custom photoacoustic solutions based on QCL photoacoustic spectroscopy. These products are shown in the following figure.
Figure 5: Mirsense’s products. Packaged QCL for power application with its driving solution (left). Photoa-coustic QCL based gas analyser called "Multisense V1" that we will use in this manuscript. A new version is now commercialised. (Middle). Miniature photoacoustic gas analyser "Mirchip" (Right).
ONERA is a laboratory working under the supervision of the French Ministry of the Armed Forces, whose researches are focused on aeronautics and aerospace. This work took place between two research teams, "Sensors and Micro/Nano technologies" and "Laser sources and metrology". The first one is specialised in the development of quartz based resonators for applications such as accelerometry [31], gyrometry [32], magnetometry [33], etc. The second one is specialised in the development of infrared sources, mainly OPOs [34], and advanced instrumentation for field spectroscopy using light detection and ranging (LIDAR) technologies [35].
This context was favorable to research on photoacoustic spectroscopy while understanding the constraints of field applications and market requirements.
Approach
To answer the different problems we highlighted, our study revolves around different axis.
To have a good overview of the many systems used in PAS, we first describe the state-of-the-art of photoacous-tic spectroscopy, in parphotoacous-ticular by investigating the reported performances of the three main variants: MPAS, CEPAS and QEPAS.
Secondly, a complete modelling of photoacoustics, from the light source to the detector and signal processing, is detailed. It has been developed to lay common foundations for the comparison between MPAS, CEPAS and QEPAS. Hypotheses, upon which the analytical and finite element simulations are based, are explained. The third chapter is dedicated to the model validation through photoacoustic measurements. Experiments implementing the different photoacoustic techniques from literature are analysed. We also present our results using different setups and detectors. We first study Mirsense’s first differential acoustic cell with one of their QCLs. Secondly, we present experiments on ONERA’s quartz tuning forks and acoustic resonators.
The fourth chapter presents a comparison of the different photoacoustic techniques. Using a new unified mod-elling, a sensitivity comparison is achieved, with associated advantages and drawbacks.
The last chapter focuses on a promising new signal processing method for quartz tuning fork based photoacoustic sensors. The first part focuses on the theory behind this method while the second part presents experimental results and interpretation.
Eventually, we conclude on the interest of using the different photoacoustic techniques, with a focus on the interest of using quartz tuning forks in photoacoustic spectroscopy. Outlooks are drawn for possible future improvements.
Abbreviations
AFM atomic force microscopy AM amplitude modulation
BF-QEPAS beat-frequency quartz enhanced photoacoustic spectroscopy CAD computer aided design
CEAS cavity enhanced absorption spectroscopy CEPAS cantilever enhanced photoacoustic spectroscopy CRDS cavity ring down spectroscopy
CW continuous wavelength DFB distributed feedback EIN equivalent input noise ENBW equivalent noise bandwidth FEM finite element method FFT fast Fourier transform
FPGA field programmable gate array
FTIR Fourier transform infrared spectrometer FWHM full width at half maximum
ICL interband cascade laser IMS ion mobility spectrometry
LASER light amplification by stimulated emission of radiation LED light-emitting diode
LIA lock-in amplifier
LIDAR light detection and ranging LOD limit of detection
MEMS micro electro mechanical systems MOCAM modulation cancellation method
MPAS microphone based photoacoustic spectroscopy
MIR mid-infrared
NEA noise equivalent absorption
NDIR non-dispersive infrared absorption spectroscopy NEC noise equivalent concentration
NEP noise equivalent power
NNEA normalised noise equivalent absorption OPO optical parametric oscillator
PAS photoacoustic spectroscopy
PID proportional–integral–derivative controller PLL phase-locked loop
PML perfectly matched layer PPBV part per billion in volume PPMV part per million in volume PSD power spectral density
PYRATS Python resonators analytical simulator QCL quantum cascade laser
QCW quasi continuous wavelength
QEPAS quartz enhanced photoacoustic spectroscopy QTF quartz tuning fork
RMS root mean square SNR signal-to-noise ratio SPL standard pressure level
TDLAS tunable diode laser absorption spectroscopy VCO voltage control oscillator
List of Symbols
General
Symbol Description Unit
kB Boltzmann constant J.K-1
T Temperature K
Optics
Symbol Description Unit
IL Laser intensity W.m-2
r Distance to laser axis m
PL Laser mean power before modulation W
wL Laser waist m
λL Wavelength m
σL Wavenumber cm-1
δ Wavelength modulation amplitude cm-1
Lsource Laser source length in FEM m
Fluid
Symbol Description Unit
ρf Gas volumetric mass density kg.m-3
αG Gas maximal linear absorption cm-1
αmin Gas minimal detectable linear absorption cm-1
FWHM Absorption line full width at half maximum cm-1
τV-T Vibrational-translational relaxation rate s
γ Heat capacity ratio
-µ Dynamic viscosity Pa.s
κ Thermal conductivity W.m-1.K-1
Acoustics
Symbol Description Unit
λac Acoustic wavelength m
kac Acoustic wave vector m-1
A Pressure mode amplitude
-P Pressure Pa
v Sound speed m.s-1
Lc Cell length m
Leff Cell effective length m
Rc Cell radius m
Vc Cell volume m3
C Cell constant Pa.W-1.cm
Lcha Differential cell chamber length m
Lcap Differential cell capillary length m
Rcha Differential cell chamber radius m
Rcap Differential cell capillary radius m
A0 Differential cell capillary area m2
Aeff Differential cell effective capillary area m2
V1/2 Differential cell chamber volume m3
Veff Differential cell effective volume m3
Lmr Acoustic micro resonator length m
RI Acoustic micro resonator internal radius m
RO Acoustic micro resonator external radius m
hmr Acoustic micro resonator height compared to QTF stem m emr Acoustic micro resonator penetration depth to QTF face m
lµ Viscous characteristic length m
lκ Thermal characteristic length m
dµ Viscous boundary layer length m
dκ Thermal boundary layer length m
Qac Acoustic total quality factor
-Qac,radiation Acoustic radiative quality factor -Qac,viscous Acoustic viscous quality factor -Qac,thermal Acoustic thermal quality factor -Qac,volume Acoustic volumic quality factor
-Mechanics
Symbol Description Unit
W Beam displacement m
ξ Damping ratio
-E Young modulus Pa
ρq Quartz volumetric mass density kg.m-3
α Linear thermal expansion K-1
e Beam vibrating width m
l Beam vibrating thickness m
L Beam length m
g QTF gap m
f0 Resonance frequency Hz
ω0 Resonance pulsation rad.Hz
K Stiffness kg.s-2 η Damping ratio kg.s-1 M Equivalent mass kg Φ Beam deformation -Rm Motional resistance Ω Lm Motional inductance H Cm Motional capacitance F C0 Parasitic capacitance F Q Quality factor
-Qthermo Thermoelastic quality factor
-Qstruct Structural quality factor
-Qelectrode Electrode quality factor
-Qvac Vacuum quality factor
-Qviscousfrontal Frontal viscous quality factor
-Qviscouslateral Lateral viscous quality factor
-Qsqueeze Squeeze damping quality factor -QCouette Couette damping quality factor -Qacoustic Acoustic radiation quality factor of a QTF
-Q* Coupled system quality factor
-FB Noise equivalent force N
d Distance to the wall for squeeze damping m
Electronics
General
Symbol Description Unit
φ Phase rad
Δf Bandwidth Hz
τLIA Lock-in amplifier integration time s
RM Microphone sensitivity mV.Pa-1
S Photoacoustic signal mV
Sdiff Differential photoacoustic signal mV
Oscillator
Symbol Description Unit
φ Phase rad
φlaser Phase shift due to laser propagation rad
φPA Photoacoustic phase shift rad
φelec Electronic phase shift rad
φPS Varying phase shift rad
φPS,min/max Phase shift minimising/maximising the frequency shift rad
Δφ Phase shift variation rad
Δf0 Frequency shift around resonance Hz
Δf0,diff Differential frequency shift around resonance Hz
FX Piezoelectric force N
d Distance between laser and tuning fork m
SΦ Phase noise spectral density rad
2.Hz-1
SF Frequency noise spectral density Hz2.Hz-1
F Oscillator noise factor
-fc Flicker corner frequency Hz
fL Leeson frequency Hz
P0 Oscillator power W
δf Distance from carrier Hz
fH High corner frequency Hz
σ Allan deviation
-σF Allan frequency deviation Hz
VX Excitation voltage V
cX Piezoelectric actuation force equivalent voltage N.V-1
Photoacoustics
Symbol Description Unit
FPA Photoacoustic force N
H Heat deposition W.cm-1
CL Maximal generated pressure amplitude Pa.W-1.cm
As Static pressure amplification
-ηs Static acoustical-mechanical overlap
-εva Vibroacoustic efficiency
-SNR Signal-to-noise ratio
-SNR1Pa Signal-to-noise ratio for 1 Pa pressure on one face dB.Pa-1 NNEA Normalised noise equivalent absorption W.cm-1.Hz-1/2
Chapter 1
Photoacoustic state of the art
Objectives:
The aim of this first chapter is to describe the main technologies and techniques used in photoacoustic spectroscopy. A state-of-the-art review is presented concerning the different sensors employed in PAS with a special focus on quartz enhanced photoacoustic spectroscopy. In particular, a summary of the previous PhD student’s work at ONERA on photoacoustics is provided. A review of different industrial sensors is also provided, describing the maturity of these technologies in the area of gas detection.
1.1
Microphone based photoacoustic spectroscopy: MPAS
We choose to call microphone based photoacoustic spectroscopy (MPAS) the photoacoustic technique developed in the late forties [36]. It historically takes advantage of the development of microphones as quantitative acoustic detectors which was a huge improvement in comparison with the previously used human hearing.
1.1.1 Microphones
The basic principle of a microphone consists in the movement of a membrane, excited by acoustic waves, and the reading of this membrane displacement. One can distinguish several types of microphones: carbon, ribbon, piezoelectric or more recently laser based optoacoustic microphones. However, we will describe here the most common type of microphone which is the condenser microphone.
Condenser microphones rely on the same principle as other microphones, a thin film membrane, usually made of gold coated Mylar®, Silicon or stainless steel, is forced into oscillation by an external acoustic force.
The reading of its displacement is based on the principle of condensers, as its name suggests. The condenser consists of two conductor plates (here the membrane and the backplate) separated by a dielectric medium (in our case air or gas). For this purpose, the backplate is polarised by an electrical circuit or can be permanently magnetised, we then talk about "electret microphones". Its capacitance changes with the modification of the distance between the conductor plates. The sensitivity depends mainly on the area of the plates and the dis-tance from each other as well as the membrane material and thickness. Capacidis-tance value is converted into an analog or digital signal through proximity electronics, giving the measured pressure. A schematic diagram of a condenser microphone is presented in Figure 1.1.
From the acoustical point of view, the microphone is made of two gas volumes separated by the membrane. The membrane is usually perforated in order to balance the low frequency pressure waves between the two
volumes. In addition, a vent is sometimes made in the back volume of the microphone to equalise pressure with ambient air. By carefully designing the microphone it is possible to reduce acoustic damping due to the existence of the back volume [37,38].
Figure 1.1: Schematic of a condenser microphone.
A further distinction has to be made, between the different condenser microphones. Indeed, with the development of the Internet of Things and the need for compact solutions, Microelectromechanical systems (MEMS) were developed. In comparison with classical microphones these are smaller and adapted to the use in portable applications, such as audio systems for smartphones, through low power consumption, low cost, and durability. An example of state-of-the-art MEMS and classic microphones is presented in Figure 1.2.
Figure 1.2: Examples of condenser microphones. On the left: Infineon digital IM69D130 MEMS microphone [39,40]. On the right: Bruel&Kjaer BK4144 1 inch microphone and its preamplifier [41].
Microphones used in PAS are usually designed for the human hearing audio band from 20 Hz to 20 kHz. Therefore their first mode of resonance is generally beyond 20 kHz in order to present a flat response over the audio band. In photoacoustics they are generally used in that spectral band because of the limitations due to molecular relaxation rates as we will see in Section 2.1.2. However, they could also be used at their resonance frequency so as to make sure that the noise of the microphone is limiting compared to the electronic noise of the signal processing unit (preamplifier and lock-in detection). It can be noted that microphones working at higher frequencies exist, for example for non-destructive control in the industry or for medical applications.
In photoacoustics, only a part of their spectral response is used and selected by employing a lock-in detection scheme (which principle is detailed in Section 2.1.6) in order to reduce the system noise.
Even though developments are still in progress, particularly for piezoelectric MEMS microphones, these technologies have already reached their fundamental limits in terms of material losses and SNR. Indeed, the membrane losses are well known, the thermal noise is usually limiting [42], and the acoustic design is controlled to limit membrane damping [38,37]. Nevertheless, using a microphone alone does not allow for meeting the needs required for most gas detection applications in terms of sensitivity. That is why they are generally used with acoustic resonators as we describe in the next paragraph.
1.1.2 Acoustic amplification cells
In order to increase the acoustic pressure detected by the microphone, acoustic resonators are used. They consist in acoustic cavities containing the gas to be detected and inside which the laser beam passes. The microphone is placed where pressure amplitude is the highest.
In order to compare cells, their capacity to amplify acoustic pressure waves is evaluated. The figure of merit giving the pressure generated for a normalised heat deposition in the medium is called the cell constant C and is expressed in Pa.W-1.cm. Also, a figure of merit called normalised noise equivalent absorption (NNEA) is
used so as to compare sensors sensitivity. NNEA is directly related to the cell constant but additionally takes into account the microphone sensitivity. It is the sensor signal-to-noise ratio normalised by the laser power, gas absorption and measurement bandwidth expressed in W.cm-1.Hz-1/2. These figures of merit are presented
extensively in Chapter 2.
Main cell geometries employed in laboratories are presented in the next paragraphs as well as reached perfor-mances.
1.1.2.1 Simple cylindrical cells
Cells used in photoacoustic spectroscopy generally present a simple cylinder shaped geometry resonating at their first longitudinal, radial or azimuthal eigenmode as illustrated in Figure 1.3. Several groups demonstrated the use of acoustic resonators since approximately 1940 [43,44,45]. Amongst them, Dewey et al. demonstrated an enhancement of a factor 100 of the generated pressure compared to free space absorption when detecting n-butane by means of a radial resonator [44].
Figure 1.3: First pressure modes of a cylindrical acoustic resonator. The positive relative pressure is represented in red, the negative in blue.
The cell constant mainly depends on its geometry, quality factor, and on the overlap integral between the acoustic mode and the laser beam intensity distribution. Analytical models exist in order to predict the cell resonance frequency, quality factor and constant [21,46] for simple cell geometries (see Section 2.1.3.2). As such, cells have been designed to have quality factors as high as 1,000 up to 10,000 [47, 48]. However, it has been shown that the optimal cell constant is obtained for cells with increased interaction length between the laser beam and the gas while keeping a small volume [21]. As a result, the optimal cell reported to date for
photoacoustics, in terms of sensitivity, is a cylinder of small radius and long length to maximise the pressure, even though its quality factor is low (Figure1.4(a)). For example, while a high quality factor cell demonstrated a cell constant of 200 Pa.W-1.cm [21], a 30 quality factor cylinder of 3 mm radius and 170 mm length demonstrated
a cell constant of 8,615 Pa.W-1.cm [49].
A consequence of the use of cylindrical geometry and the need for low frequencies, due to photoacoustic relax-ation processes, is the common use of the first longitudinal mode. However, radial and azimuthal resonators also demonstrate good performances [50].
It should be noted that cells used in PAS are usually not simple cylinders. Actually, by using laser amplitude modulation (AM), a part of the laser power is absorbed by the cell windows or by the cell walls, generating an acoustic signal background at the same frequency as the detection [21]. The presence of this signal background is undesirable because it could degrade the dynamic range of the lock-in detection. So usually cells are equipped with buffer volumes as can be seen in Figure1.4(b). These additional volumes act as acoustic filters attenuating the sound background detected by the microphone [51].
Figure 1.4: Slice view schematic of simple cylinder shaped resonators used in photacoustic gas spectroscopy (a). Used with acoustic buffers (b). Schematic of a multipass cell (c).
Such carefully designed cells equipped with state-of-the-art microphones can reach NNEA ranging from 10-9
W.cm-1.Hz-1/2 [52, 53] to 10-11 W.cm-1.Hz-1/2 [54]. The NNEA can be further improved by increasing the
optical path through using multipass absorption cells (Figure 1.4(c)), such as a Herriott cell. The cylinder cell is then closed by two mirrors carefully designed so as to generate the maximal number of laser passes while avoiding beam interference. Typically, the number of passes generated by such cells is close to 30 [55]. Zhang et al. reported a NNEA of 1.4 10-9 W.cm-1.Hz-1/2 by using such a cell with 17 passes [56].
However, the use of the NNEA may be questionable for such systems because laser power absorption may not be linear anymore due to the long path lengths (the linear approximation of Beer-Lambert-Bouguer’s law may no longer hold). In these cases, the NNEA should be computed in the linear mode of the sensor, otherwise, other figures of merit should be used1.
One could expect that the increase of sensitivity generated by the multipass technique could benefit to state-of-the-art single pass cells. However, the limits of detection for multipass techniques reach the same order of magnitude as single-pass cells ones. This can be explained by the technical constraints needed to set multipass cavities. In order for the reflected beams not to interfere, the cavity radius should be increased, degrading both the acoustic pressure generation (inversely proportional to the squared cell radius (see Section2.1.3.2)) and the overlap of the acoustic waves with the microphone. A compromise may be found between the number of passes and the cell constant by reducing the multipass cell radius. It is also possible to keep a small cell radius (some
1
In the case in which Beer-Lambert-Bouguer’s law linear approximation does not hold it is preferable to use the NEA (noise equivalent absorption). It is defined in the same way as the NNEA except that it is not normalised by laser power. A NEA of 2.1
millimeters) and to employ right angle prisms to increase up to 4 times the number of passes [57,58].
In order to improve the cell constant a minimal radius should be chosen, however this radius cannot be infinitely decreased. The optimal radius should be chosen as the minimal radius allowing for the laser beam not to touch the cell walls, otherwise a signal background will be generated (especially at high wavelengths such as in the mid-infrared).
Although photoacoustic spectroscopy is an optical background free technique it is very sensitive to acoustic background which cannot always be avoided [54], especially out of the lab. As we have seen, background signal can be generated by the laser beam absorption, but it can also come from the acoustic or electromagnetic environment, vibrations or gas flow. A solution to reduce these backgrounds consists in the use of differential measurement as we will describe in the next paragraph.
1.1.2.2 Differential cells
The first differential cell was presented in 1975 [45], it consists in the use of two cylinder volumes, in which the laser beam passes. In each volume a microphone measures the acoustic pressure and a differential signal is obtained allowing to reduce signal background. This configuration was improved later on by adding buffer volumes [21], and by carefully placing the gas inlet and outlet (Figure1.5(a,b)), achieving a NNEA of the order of 10-9 W.cm-1.Hz-1/2 [59].
Figure 1.5: Schematic of differential resonators used in photoacoustic spectroscopy. (a) is similar to classic cells presented before with an additional microphone. (b) Differential cell with supplementary buffers to shield from signal background coming from the gas circuit.
Another possibility is to make the entire differential cell resonant as shown in Figure 1.6. The resonator is then composed of two chambers in which the laser beam passes and of two capillaries connecting them. The resonator can be assimilated as a mass-spring system with the chambers being the masses and the air volume in the capillaries being the spring. At the first anti-symmetric acoustic mode, pressure amplitude oscillates in time between the two chambers while the middle of the capillaries presents a pressure amplitude node. Placing the gas connectors in the capillaries allows for reducing the sound background coming from the gas circuit seen by the microphones.
State-of-the-art sensitivity of such cells has reached 2.4 10-10 W.cm-1.Hz-1/2 [46] employing Helmholtz
resonance. Miniaturised cells based on the same kind of resonators have also been designed [60] reaching a NNEA of 4.3 10-9W.cm-1.Hz-1/2.
Figure 1.6: Schematic of Helmholtz type differential resonators used in photoacoustic spectroscopy. (a) Helmholtz type resonator. (b) Resonator anti-symmetric acoustic mode. The positive relative pressure is represented in red, the negative in blue.
A sum up of the detection limits reached by MPAS type sensors is given in Table 1.1.
Wavenumber Laser power Integration LOD αmin NNEA
Gas (cm-1) (mW) time (s) (1σ) (cm-1) (W.cm-1.Hz-1/2) Ref. CO2 O2 6,362.5 13,091.71 23 60 114 ppmv100 ppmv 2 10 -7 1.3 10-7 3.1 10 -9 [52] C2H2 6,529.17 15.1 100 8.4 ppbv 9.6 10-9 1.4 10-9 [56] NO2 22,371.36 1,300 1 54 pptv 6 10-10 1.58 10-9 [59] CH4 6,046 6,046 6,056 0.7 0.7 2 1 5 ppmv 1 ppmv 0.3 ppmv 1.8 10-6 3.4 10-7 1.2 10-7 1.3 10-9 2.4 10-10 2.4 10-10 [46] CH4 2,979 2.2 1 92 ppbv 1.7 10-6 4.3 10-9 [60] NO 1,857.27 2.8 1 20 ppbv 2.6 10-7 3.3 10-10 [61] DMMP 1,053 12 1 3 ppbv 1.8 10-7 4.2 10-9 [62] NO2 N2O 1,614.7 1,254.5 105 2 80 ppbv84 ppbv 2.5 10 -6 5 10-7 2.5 10-8 1 10-8 [63] NH3 6,528.7 1,000 40 6 ppbv 1.4 10-9 1.5 10-9 [53] CH4 6,057.1 10 4 0.5 ppmv 2.2 10-7 4.4 10-9 [49] C2H4 949.49 2,000 2 6 pptv 2.5 10-10 6.7 10-11 [54]
1.2
Cantilever enhanced photoacoustic spectroscopy: CEPAS
The second technique, called cantilever enhanced photoacoustic spectroscopy (CEPAS), was introduced in 2003 [64,65]. In a very similar way to MPAS, CEPAS uses a cantilever beam to detect the acoustic pressure waves generated inside an acoustic cavity.
1.2.1 Cantilevers
In order to enhance the sensitivity of photoacoustic detectors, cantilevers were designed to replace microphones [64]. While microphones are designed to present a resonance frequency near 20 kHz, allowing their use in a wide audio band (usually 20 Hz - 20 kHz), cantilevers are designed to present lower resonance frequencies (usually below 1 kHz). They take advantage of the higher pressure amplitude at lower frequencies in acoustic resonators. Moreover, working at low frequencies also allows for detecting gases with slower relaxation rates. Another benefit of working at a detection frequency close to the detector resonance frequency is to take advantage from the higher level of the Brownian noise in order to raise this noise out of the system other noises.
Different types of cantilevers have been used. The main ones are machined from Silicon wafers [66, 67] or from stainless steel films [68] (Figure 1.7). They usually present low quality factors inferior to 100, and a resonance frequency below 1 kHz. Their thickness is chosen to be as thin as possible in order to enhance their stiffness and displacement and thus to facilitate the detection. As a consequence, the modelling of these detectors needs to take into account the influence of the gas on the beam displacement [66].
Figure 1.7: Examples of cantilevers from literature. (a) Photography of a Silicon wafer with cantilevers of typical dimensions 5 mm long, 2 mm wide and 10 µm thickness [66]. (b) Photography of a cantilever laser cut from a stainless steel sheet with dimensions 3 mm long, 1 mm wide and 100 µm thickness [68].
Detection of the displacement is mainly carried out optically through the use of an optical interferometer (such as a Michelson one) (Figure 1.8(a)). This method is generally sufficient to detect the Brownian noise of the cantilever [66]. Another method is to detect the stress generated by the beam displacement through the use of nano-gauges [69] (Figure 1.8(b)). Yet another method consists in using piezoelectricity by depositing a thin film on the cantilever and collecting the generated charges [70] (Figure1.8(c)). One could also use quartz cantilever beams, although we have no example of a CEPAS sensor using these in the literature.

![Figure 1.11: Scaled photography of custom quartz tuning forks reported in literature. QTFs 1-6 [81], QTF 5 bis [83, 84], QTF 7 [82], QTF 8 [85]](https://thumb-eu.123doks.com/thumbv2/123doknet/15039594.691284/48.892.107.781.130.378/figure-scaled-photography-custom-quartz-tuning-reported-literature.webp)
![Figure 1.12: Comparison of the beam displacement in fundamental and overtone mode (left) [83]](https://thumb-eu.123doks.com/thumbv2/123doknet/15039594.691284/49.892.163.744.442.742/figure-comparison-beam-displacement-fundamental-overtone-mode-left.webp)
![Figure 1.16: Schematic of the MOCAM technique balancing the optical background by employing an anti-phase modulated second laser [112].](https://thumb-eu.123doks.com/thumbv2/123doknet/15039594.691284/54.892.276.622.122.424/figure-schematic-technique-balancing-optical-background-employing-modulated.webp)
![Figure 1.17: Schematic of the alternate electrical excitation [115]. Changing the photoacoustic modulation phase modifies the decay time of the tuning fork response, allowing for measurement of the gas concentration, gas relaxation time, QTF quality factor](https://thumb-eu.123doks.com/thumbv2/123doknet/15039594.691284/55.892.76.815.160.452/schematic-electrical-excitation-photoacoustic-modulation-measurement-concentration-relaxation.webp)