HAL Id: tel-03259909
https://tel.archives-ouvertes.fr/tel-03259909
Submitted on 14 Jun 2021
HAL is a multi-disciplinary open access archive for the deposit and dissemination of sci-entific research documents, whether they are pub-lished or not. The documents may come from teaching and research institutions in France or abroad, or from public or private research centers.
L’archive ouverte pluridisciplinaire HAL, est destinée au dépôt et à la diffusion de documents scientifiques de niveau recherche, publiés ou non, émanant des établissements d’enseignement et de recherche français ou étrangers, des laboratoires publics ou privés.
Comovements
Tristan Jourde
To cite this version:
Tristan Jourde. The Long-Term Evolution of International Stock Return Comovements. Economics and Finance. Université Paris sciences et lettres, 2020. English. �NNT : 2020UPSLD023�. �tel-03259909�
Composition du jury :
Florence LEGROS
Directrice Générale, ICN Business School Présidente Bertrand CANDELON
Professeur,
Université catholique de Louvain Rapporteur Olivier DARNE
Professeur, Université de Nantes Rapporteur Sébastien CABROL
Portfolio Manager & Head of Research,
Longchamp Asset Management Examinateur Martine CARRE-TALLON
Professeure, Université Paris-Dauphine Examinatrice Sanvi AVOUYI-DOVI
Conseiller scientifique, Banque de France
Professeur, ICN Business School Directeur de thèse
The Long-Term Evolution
of International Stock Return Comovements
Soutenue par
Tristan JOURDE
Le 23 novembre 2020
Ecole doctorale n° ED 543
Ecole doctorale
de Dauphine
Spécialité
Sciences économiques
This thesis was carried out under an Industrial Agreement of Training through Research (CIFRE) between Paris-Dauphine University and Longchamp Asset Management. The opinions expressed in this document are those of the author and do not necessarily reflect the views of Paris-Dauphine University or Longchamp Asset Management.
“My ventures are not in one bottom trusted, Nor to one place; nor is my whole estate Upon the fortune of this present year; Therefore my merchandise makes me not sad.” William Shakespeare, The Merchant of Venice (1598)
Acknowledgments
First and foremost, I warmly thank my thesis advisor, Prof. Sanvi Avouyi-Dovi, for agreeing to supervise my research and for guiding me throughout these years. His always very valuable comments have greatly contributed to improving and shaping this thesis.
I am particularly indebted to Dr. Sébastien Cabrol, my supervisor at Longchamp Asset Management, who has supported me from the beginning and provided me with priceless en-couragement and guidance in both academic and applied research. Special thanks also go to Prof. Martine Carré-Tallon for her many constructive remarks over the last few years. Finally, I would like to express my gratitude to Prof. Bertrand Candelon, Prof. Olivier Darné, and Prof. Florence Legros for agreeing to join my thesis committee. Thank you for your comments and discussions on my work.
All my gratitude goes to my colleagues, professors, and the administrative team at Paris-Dauphine University for providing me with a top-quality environment and research assistance. I am indebted to Prof. Eve Caroli, Prof. Elise Huillery, and Prof. Bertrand Villeneuve for their respective contribution to the successful completion of my thesis. I joined Paris-Dauphine Uni-versity as an undergraduate student and have had the privilege of meeting inspiring friends over the years. Thank you, Arnold, Edouard, Etienne, Julie, Ghita, Guilhem, Lisa, Louis, Pas-cal, Paula, Pierre, Quentin, Roland, Thomas, and Xavier for helping me to make the most of this (long) journey!
I am much obliged to the organizers and participants of the seminars, conferences, and lec-tures I attended. These have been friendly and rewarding experiences, helping me to improve my research and giving me the desire to keep working in this field. Special thanks go to Prof. Lieven Baele, Prof. Söhnke Bartram, Prof. Sylvain Benoit, Dr. Maxime Bonelli, Prof. Marie Brière, Prof. Anouk Claes, Dr. Svetoslav Covachev, Prof. Anne-Laure Delatte, Prof. Jan Ditzen, and Prof. Paul Ehling for their valuable comments, suggestions, and discussions.
I am very thankful to Longchamp Asset Management and its directors, David Armstrong and Sarah Alfandari, for allowing me to complete my Ph.D. in the best possible conditions. I also gratefully acknowledge the funding provided by the National Association for Research and Technology. Finally, I would like to thank all my colleagues, in particular Adam, Alix,
An-toine, Hugo, Isabelle, Lorenc, Nicolas, and Youssef, for sharing my daily work life, making me smile every day, and integrating me into the company’s projects.
I am infinitely grateful to my family and my parents for their open mind, steadfast love, and constant encouragement in all my projects. I also have a particular thought for amazing friends who have supported me since high school and bring so much fun into my life: Benjamin, Ca-mille, Céline, Léopold, Lisa, Olivier, and Victor.
Last but not least, thank you, Marie, for your patience, love (and jokes) through the ups and downs of this unique experience. You have been the best ear, advisor, and proofreader an-yone could imagine.
Contents
Acknowledgments ... v
List of Figures ... x
List of Tables ... xi
Introduction A. Stock market interdependencies ... 14
B. Interests and applications ... 16
B.1. International diversification benefits ... 16
B.2. Financial stability ... 17
References ... 20
Chapter 1. The Bright Side of the Decline in the Benefits of International Portfolio Diversification 1.1. Introduction ... 23
1.2. Related literature ... 26
1.3. Methodology ... 29
1.3.a. Correlation-based measure: a simplified approach of diversification ... 30
1.3.b. The relative and absolute benefits of international diversification ... 32
1.3.c. A ratio-based IDB measure ... 33
1.3.d. A spread-based IDB measure ... 35
1.4. Empirical application ... 36 1.4.a. Data ... 37 1.4.b. Estimation procedure ... 39 1.4.c. Results ... 40 1.5. Robustness tests ... 51 1.6. Conclusion ... 53 References ... 54 Appendices ... 58
Chapter 2. The Long-Term Effect of Globalization on International Stock Return Comovements 2.1. Introduction ... 70
2.2. Related literature ... 72
2.3. Methodology ... 75
2.4. Data ... 77
2.4.a. Sample ... 77
2.4.b. Comovement measures ... 79
2.4.c. Trade and financial openness measures ... 82
2.5. Results ... 87
2.5.a. Variables pre-selection ... 87
2.5.b. The determinants of the rise in stock market comovements ... 90
2.6. Robustness tests ... 96
2.6.a. Reverse causality ... 96
2.6.b. Alternative measures of stock market comovements ... 98
2.6.c. Alternative estimators ... 99
2.6.d. Univariate regressions for advanced and emerging markets ...100
2.6.e. Eliminate tax havens ...100
2.7. Contributions of the chapter... 101
2.8. Conclusion ... 104
References ... 104
Appendices ... 109
Chapter 3. Interconnectedness of the Insurance Sector: a Long-Term Perspective 3.1. Introduction ... 128
3.2. Related literature ... 132
3.3. Methodology ... 134
3.3.a. Interconnectedness measure ...134
3.3.b. Estimation procedure ...137
3.3.c. Data ...139
3.4. Empirical results ... 141
3.4.a. Interconnectedness of the entire insurance sector ...141
3.4.b. Interconnectedness of the largest companies ...145
3.5. Robustness tests ... 150
3.5.a. Estimation procedure ...151
3.5.c. Factor model ...152
3.6. Conclusion ... 154
References ... 155
Appendices ... 160 Conclusion
List of Figures
Chapter 1. The Bright Side of the Decline in the Benefits of International Portfolio Diversification
Figure 1.1. European diversification benefits based on the standard IDB measure ... 42
Figure 1.2. European and domestic diversification benefits in absolute terms ... 47
Figure 1.3. European diversification benefits using the spread-based IDB measure ... 49
Figure 1.4. Empirical test of the equal variance hypothesis... 58
Figure 1.5. European diversification benefits using the ratio-based IDB measure ... 64
Figure 1.6. European diversification benefits based on various portfolio-weighting schemes . 64 Figure 1.7. Factor influence based on a variance ratio ... 65
Figure 1.8. Sectors’ weights within European portfolios ... 66
Chapter 2. The Long-Term Effect of Globalization on International Stock Return Comovements Figure 2.1. Indicators of stock market comovements ... 111
Figure 2.2. Trade and financial openness indicators ... 112
Figure 2.3. Equity holdings and de jure financial openness ... 113
Figure 2.4. Openness indicator vs. stock market comovements: cross-sectional analysis ... 114
Figure 2.5. Openness indicator vs. stock market comovements: time-series analysis ... 114
Chapter 3. Interconnectedness of the Insurance Sector: a Long-Term Perspective Figure 3.1. Breakdown of the interconnectedness (VR) of the average insurance sector ... 142
Figure 3.2. Interdependencies (VR) of the largest insurers, banks, and non-financial firms 147 Figure 3.3. Mapping insurers based on interconnectedness (VR) and volatility ... 150
Figure 3.4. Interdependencies (VR) of insurers, banks, and non-financial sectors ... 172
List of Tables
Chapter 1. The Bright Side of the Decline in the Benefits of International Portfolio Diversification
Table 1.1. Literature review ... 29
Table 1.2. Description of the data ... 38
Table 1.3. Descriptive statistics and diagnostic tests based on return series ... 60
Table 1.4. Descriptive statistics and diagnostic tests based on the measures of diversification ... 61
Table 1.5. Linear and non-linear trend tests ... 62
Table 1.6. Comparison with other studies ... 63
Table 1.7. Structural breaks in trends ... 63
Table 1.8. Domestic holdings in the equity portfolios (by country, in %) ... 66
Table 1.9. Excluding countries ... 67
Table 1.10. Alternative specifications ... 68
Chapter 2. The Long-Term Effect of Globalization on International Stock Return Comovements Table 2.1. Description of the data ... 78
Table 2.2. Description of the explanatory variables ... 86
Table 2.3. Determinants of the comovements among advanced markets ... 92
Table 2.4. Determinants of the comovements among emerging markets ... 94
Table 2.5. Determinants of the comovements between emerging and advanced markets ... 96
Table 2.6. Testing for reverse causality between stock market comovements and equity holdings... 98
Table 2.7. Trends in comovement measures ... 109
Table 2.8. Descriptive statistics and diagnostic tests ... 115
Table 2.9. Trade links—Univariate regressions (all countries)... 116
Table 2.10. Financial links—Univariate regressions (all countries) ... 117
Table 2.11. Alternative dependent variables—Univariate regressions (all countries) ... 118
Table 2.13. MG estimator with outlier-robust averages of the individual estimates ... 121
Table 2.14. Pooled mean group (PMG) and dynamic fixed effects (DFE) estimators ... 122
Table 2.15. Trade links—Univariate regressions (CS-DL)—Details by groups ... 123
Table 2.16. Financial links—Univariate regressions (CS-DL)—Details by groups ... 124
Table 2.17. Equity openness—Univariate regressions (CS-DL)—Details by groups ... 125
Table 2.18. Excluding tax-haven countries—Advanced markets ... 126
Chapter 3. Interconnectedness of the Insurance Sector: a Long-Term Perspective Table 3.1. Description of the selected domestic insurance indices ... 140
Table 3.2. Typology of the sectors (Industry/Supersector/Sector) ... 162
Table 3.3. Component list of the domestic insurance indices... 163
Table 3.4. List of the largest companies of each sector ... 164
Table 3.5. Descriptive statistics and diagnostic tests based on return series ... 165
Table 3.6. Interconnectedness measures (VR)—Breakdown by risk factors ... 166
Table 3.7. Comparing interconnectedness levels (VR & VL)—Insurers, banks, and non-financial firms... 167
Table 3.8. Interconnectedness levels (VR & VL)—Details by countries and sectors ... 168
Table 3.9. Comparing interconnectedness levels (VR & VL)—Insurers vs. non-financial sectors ... 169
Table 3.10. Interconnectedness levels (VR & VL)—Details by firms ... 170
Table 3.11. Time-varying parameters and structural breaks ... 171
Table 3.12. Comparing interconnectedness levels (VR)—Details by insurer types ... 171
Table 3.13. Alternative specifications ... 173
Table 3.14. Factor loadings ... 174
Table 3.15. Factor significance ... 175
Introduction
Stock markets enable (i) households to invest their savings and to benefit from companies’ ex-pansion and (ii) firms to raise funds in order to develop their activities. Over the last decades, this role has considerably grown, along with the financialization and liberalization of the global economy. Between 1980 and 2018, the ratio of the world market capitalization to GDP tripled, from 31% to 93%. The number of listed companies more than doubled over the same period, from 17,273 to 43,342 (World Bank database, WDI).
Besides, the gradual liberalization of stock markets has led to increased cross-border equity flows, providing new sources of financing for companies and additional investment opportuni-ties for investors. From 1995 to 2015, the purchases of domestic stocks by foreign shareholders grew fivefold in advanced markets, from 16% to 87% of GDP, and fourfold in emerging mar-kets, from 4% to 16% (Lane and Milesi-Ferretti, 2018). At the same time, cross-border trade and financial links between companies have increased.
The liberalization of equity markets and the strengthening of international trade and finan-cial links are likely to have led to rising interdependencies among stock markets (e.g., Quinn and Voth, 2008). These developments represent an essential matter for both investors and regulators, as rising stock market comovements may lessen the benefits of international portfo-lio diversification and undermine financial stability. This thesis thus explores the determinants and the consequences of the long-term evolution of international stock return comovements.
The remainder of this introduction is organized as follows: Section A describes the concept
inter-dependencies; Section B discusses the interests of studying stock market comovements for in-vestors and regulators.
A. Stock market interdependencies
We use the terms “interdependencies” and “comovements” indifferently. Comovements is a technical term that does not exist in standard dictionaries. According to Baur (2003), the con-cept of comovements shall be understood as con-movements, which means “moving with” or “sharing movement.” Barberis et al. (2005) also describe the notion of comovements as “a pat-tern of positive correlation.” Forbes and Rigobon (2002) use the term interdependencies to des-ignate a context in which markets exhibit a high level of comovements. Without further speci-fication, the terms interdependencies and comovements describe the relationship between two variables, in both normal and crisis times, and assume no causal link between them. These general concepts should be distinguished from more specific notions, such as “contagion” or “spillovers.” The literature uses the term contagion to describe an extreme adverse event in one market that affects others (Forbes, 2012). The notion of spillovers refers to the direction of shock transmission between markets, which implies the existence of dominating markets—net givers of shocks—and dominated markets—net receivers of shocks.
The theoretical literature proposes several hypotheses on the origins of stock market inter-dependencies. The first hypothesis states that stock market interdependencies reflect the exist-ence of trade and financial links between countries. This idea stems from the work of Williams (1938) on firms’ intrinsic value. While the prevailing view in the 1930s was that financial mar-kets behaved like casinos, Williams argued that the price of a stock should be equal to the pre-sent value of its future cash flows. Williams’ work found a wide resonance in the 1960s, with the emergence of the efficient market hypothesis. Under this hypothesis, stock prices are sup-posed to reflect rational investor expectations regarding firms’ intrinsic values.
The intrinsic values of firms are unlikely to be independent due to the existence of trade and financial links between countries and companies. A simultaneous adjustment in the intrinsic values of several firms should lead to common changes in stock prices. If this adjustment takes place at the international level, it can generate international stock return comovements. Based
on this principle, the theoretical literature describes several channels that might be at the root of the correlation among equity markets. The first channel refers to common shocks that might hit several economies at once (“monsoonal effect,” Masson, 1998). In addition, direct trade links might act as a channel for shock transmission between countries. A shock in one economy can reduce the demand for imports, affecting its main trading partners. Finally, shocks might spread across countries through direct financial linkages. A financial shock in one country can impact other countries through a reduction in loans, trade credits, or foreign direct invest-ments, reinforcing stock market comovements.
Other studies assume that the interdependencies among equity markets can arise from the actions of irrational, uninformed, or constrained investors, even in the absence of trade and financial links between countries. Supporters of this second approach argue that the dynamics of stock prices cannot be comprehended without considering the human factor. Keynes de-scribes investor behavior using an analogy based on a beauty contest. According to him, a fi-nancial analyst should not recommend the stock he or she believes is the best, but the stock he or she thinks other analysts will recommend. Therefore, variations in stock prices could depend
more on speculation than on firms’ intrinsic value. In the 1980s, and especially after the 1987
stock market crash, researchers began to consider that stock prices are not always the best estimate of firms’ intrinsic value. If stock prices can significantly deviate from their fundamen-tal values, stock market comovements can arise from investor behavior. Thus, previous papers have proposed new arguments based on investor behavior to explain these seemingly excessive stock market comovements.
First, shocks can spread across markets due to investor risk and liquidity constraints. A negative shock in a domestic equity market can force (i) risk-constrained investors to reduce their overall risk by selling their positions in other countries, (ii) leveraged investors to cut their exposures to pay for margin calls, and (iii) investment funds to liquidate some assets to
cover redemptions (e.g., Kodres and Pritsker, 2002). Through these channels, an adverse
idio-syncratic shock can be transmitted to other markets, leading to a synchronized decline in stock prices. Non-fundamental interdependencies might also stem from the existence of information asymmetry and coordination problems among investors (e.g., Brennann and Cao, 1997). With limited information on economic fundamentals, some investors may overestimate the expected
economic impact of an idiosyncratic shock in one country on neighboring economies. As a re-sult, stock market comovements may depend more on investor’s limited knowledge than on the true fundamental linkages between countries. Finally, some scholars discuss the existence of multiple equilibria that may lead to sudden and simultaneous changes in investor expectations and confidence. This phenomenon, which is related to herding behavior, can also affect the degree of stock market comovements.
Over the past four decades, both international trade and financial links and cross-border eq-uity holdings have intensified. These developments might help to explain the rise in eqeq-uity market interdependencies over the past decades. We empirically test these hypotheses in Chap-ter 2.
B. Interests and applications
B.1. International diversification benefits
The concept of comovements is intrinsically linked to the notion of diversification. The benefits of portfolio diversification are long-established. For example, Lowenfeld (1909) notes that: “It is significant to see how entirely all the rest of the geographically distributed stocks differ in their price movements from the British stocks. This individuality of movement on the part of each security, included in a well-distributed investment list, ensures the first great essential of suc-cessful investment, namely, capital stability” (as cited in Goetzmann et al., 2005).
The work of Markowitz (1952) marks a turning point in the world of asset management by proposing a formal framework to understand the link between correlation and diversification. Markowitz (1952)’s breakthrough is to demonstrate that investing in stock markets that exhib-it low comovements wexhib-ith the rest of the world improves the return-to-risk profile of portfolios. More specifically, he shows that the variance of a diversified portfolio is lower than the average variance of its components. The reduction of risk depends on the comovements among the
as-sets of the portfolio. Chapter 1 describes the mathematical formulas associated with this
con-cept.
However, Markowitz’s approach has limitations. First, the results of his model are sensitive to the input parameters. This shortcoming is exacerbated by the fact that it is difficult to
es-timate expected returns with precision. More importantly, Markowitz’s framework is a static approach. The model assumes that the comovements among equity markets are constant, alt-hough many scholars argue that stock market comovements are not stable over time (e.g., Goetzmann et al., 2005, among others).
Changes in stock market interdependencies impact the benefits of portfolio diversification and can lead to significant losses for investors. Hence, the benefits of diversification tend to change over time, and optimally diversified portfolios may not be the same at different periods. Moreover, if the interdependencies among equity markets have increased over the past four decades, investors need to consider the possibility that the benefits of international portfolio diversification might not exceed its costs anymore. Therefore, in Chapter 1, we study the evo-lution of the benefits of global diversification based on the simplified framework introduced by Christoffersen et al. (2014). This approach circumvents the main limitations of Markowitz’s methodology by focusing on the evolution of stock market comovements.
While many studies show that the comovements among equity markets have increased over time, others find less conclusive evidence (e.g., Bekaert et al., 2009). These contradictory re-sults can be due to: (i) different methods of estimating comovements and testing for trends, (ii) diverse samples and periods of analysis, and (iii) distinct granularities of base assets—or data granularity. Our first contribution to the literature is to examine the impact of data granulari-ty (i.e., country indices, local industry portfolios, or individual securities) on the long-term evo-lution of stock market comovements. We also show that the granularity of base assets affects the interpretation of the measures of international diversification. Consequently, Chapter 1 proposes two alternative correlation-based measures that help reconcile some of the contradic-tory findings in the literature and shed new light on the evolution of the benefits of interna-tional diversification.
B.2. Financial stability
Equity markets can impact financial stability and economic activity through several channels. First, stock markets influence the propensity to consume and save, particularly in countries where households invest a large share of their wealth in equity. Second, equity markets have an impact on the propensity to invest, since firms can raise more capital when stock prices are
high. Finally, stock markets can affect financial stability through their influence on the earn-ings of financial institutions. As the most interdependent stock markets are more exposed to external shocks, they are likely to pose a higher risk to financial stability (Berger and Pukthu-anthong, 2012). Moreover, the rapid diffusion of the recent financial crises suggests that market interdependencies can accelerate and amplify the spread of shocks across countries (e.g., Forbes, 2012). Hence, growing comovements among equity markets might threaten the stability of the financial system, which is a crucial concern for regulators. In this respect, understanding the mechanisms behind stock market interdependencies is essential for designing proper policy measures.
The appropriate regulatory measures would differ whether stock market comovements arise from (i) trade links, (ii) financial linkages, or (iii) the irrational action of international share-holders. Moreover, the benefits and drawbacks of mitigating stock market comovements depend on the determinants of increasing interdependencies. If the rise in stock market comovements results from increased trade links, any attempt to reduce the degree of equity market interde-pendencies by implementing additional trade barriers could have higher economic costs than benefits. If growing interdependencies between stock markets are associated with increased fi-nancial links, such as bank loans, specific measures targeting bank leverage and imposing larger capital requirements might help mitigate stock market comovements without limiting the bene-fits of financial liberalization (Forbes, 2012). Finally, if the increase in equity market comove-ments arises from non-fundamental investor-based linkages, some policies targeting short-term equity flows in both source and receiving countries might prove useful (Ostry and Ghosh, 2013).
Mitigating stock market comovements arising from non-fundamental linkages is a more pressing issue than reducing fundamental interdependencies. Even in the absence of stock mar-ket comovements, a shock in one economy would ultimately impact the most interconnected countries through fundamental ties. In other words, fundamental comovements are likely to accelerate but not exacerbate the spread of shocks across countries. By contrast, non-fundamental interdependencies can transmit shocks between countries, even in the absence of fundamental links. Such interdependencies could both speed up and aggravate the propagation of shocks across countries.
Therefore, Chapter 2 aims to identify the mechanisms underlying the long-term evolution of international stock return comovements. This analysis can (i) provide regulators with useful information to preserve financial stability, and (ii) help investors forecast the evolution of stock market interdependencies. Indeed, with the rise of derivative markets, financial professionals can now take directional bets on the variations of stock market comovements. Our results en-rich the findings of the previous literature, especially regarding the long-term impact of foreign shareholders on equity market comovements. We also contribute to the debate on the pros and cons of equity market liberalization.
Chapter 3 focuses on the interconnectedness of the insurance sector. The International Asso-ciation of Insurance Supervisors (IAIS) defines insurers’ interconnectedness as the “interlinkag-es of an insurer or the insurance sector as a whole with other parts of the financial system and real economy” (IAIS, 2018). The regulators consider that the complex chains of intermediation and interrelationships of insurance companies might have contributed to the spread of the sub-prime crisis throughout the world. As a result, the most interconnected institutions are now subject to additional capital requirements.
The ability to accurately estimate the level and risk associated with insurers’ interdependen-cies is crucial for macroprudential authorities. Regulatory authorities have undertaken exten-sive work to collect data on balance sheet exposures to better monitor insurers’ interconnected-ness. However, detailed balance sheet data are only available in the short run and at low fre-quency. Assuming that stock market interdependencies reflect the actual links between compa-nies—which is shown in Chapter 2 for advanced economies—measuring the interdependencies among the returns of insurers’ securities can provide valuable information on insurers’ inter-connectedness. Studying the comovements between stock prices can thus serve as a substitute for the examination of the actual links between insurance companies.
In Chapter 3, we develop an interconnectedness measure based on stock market comove-ments that can be computed at a high frequency and over long periods. Such a measure is use-ful to identify the most interconnected insurers. Unlike previous studies, we focus on the long-term evolution and the specificities of insurers’ interconnectedness with the rest of the financial sector and the real economy. This analysis can also provide indications on the evolution of the
probability and the potential economic repercussions of a crisis in the insurance sector. Finally, we discuss how our findings can help assess the need for the new holistic macroprudential framework implemented in 2020.
References
[1] Barberis, N., Shleifer, A., & Wurgler, J. (2005). Comovement. Journal of Financial
Eco-nomics, 75(2), 283–317. https://doi.org/10.1016/j.jfineco.2004.04.003
[2] Baur, D. G. (2003). What Is Co-movement? EUR Working Paper No. 20759 EN. http://dx.doi.org/10.2139/ssrn.570585
[3] Bekaert, G., Hodrick, R. J., & Zhang, X. (2009). International Stock Return Comovements.
The Journal of Finance, 64(6), 2591–2626. https://doi.org/10.1111/j.1540-6261.2009.01512.x
[4] Berger, D., & Pukthuanthong, K. (2012). Market Fragility and International Market
Crashes. Journal of Financial Economics, 105(3), 565–580.
https://doi.org/10.1016/j.jfineco.2012.03.009
[5] Brennan, M. J., & Cao, H. H. (1997). International Portfolio Investment Flows. The
Jour-nal of Finance, 52(5), 1851. https://doi.org/10.2307/2329467
[6] Christoffersen, P., Errunza, V., Jacobs, K., & Jin, X. (2014). Correlation Dynamics and
International Diversification Benefits. International Journal of Forecasting.
https://doi.org/10.1016/j.ijforecast.2014.01.001
[7] Forbes, K. J. (2012). The ‘Big C’: Identifying and Mitigating Contagion. MIT Sloan Re-search Paper No. 4970-12. Retrieved from https://ssrn.com/abstract=2149908
[8] Forbes, K. J., & Rigobon, R. (2002). No Contagion, Only Interdependence: Measuring
Stock Market Comovements. The Journal of Finance, 57(5), 2223–2261.
https://doi.org/10.1111/0022-1082.00494
[9] Goetzmann, W. N., Li, L., & Rouwenhorst, K. G. (2005). Long
lations. The Journal of Business, 78(1), 1–38. https://doi.org/10.1086/426518
[10] International Association of Insurance Supervisors (2018). Holistic Framework for Systemic
Risk in the Insurance Sector. Basel. Retrieved from
https://www.iaisweb.org/file/77862/holistic-framework-for-systemic-risk-consultation-document
[11] Kodres, L. E., & Pritsker, M. (2002). A Rational Expectations Model of Financial Conta-gion. The Journal of Finance, 57(2), 769–799. https://doi.org/10.1111/1540-6261.00441
[12] Lane, P. R., & Milesi-Ferretti, G. M. (2018). The External Wealth of Nations Revisited: International Financial Integration in the Aftermath of the Global Financial Crisis. IMF
Economic Review, 66(1), 189–222. https://doi.org/10.1057/s41308-017-0048-y
[13] Markowitz, H. (1952). Portfolio Selection. The Journal of Finance, 7(1), 77–91. https://doi.org/10.1111/j.1540-6261.1952.tb01525.x
[14] Masson, P. R. (1998). Contagion: Monsoonal Effects, Spillovers, and Jumps Between
Mul-tiple Equilibria. IMF Working Papers, 98(142), 1.
https://doi.org/10.5089/9781451856224.001
[15] Ostry, J., & Ghosh, A. (2013). Obstacles to International Policy Coordination, and How to
Overcome Them. Staff Discussion Notes, 13(11), 1.
http://dx.doi.org/10.5089/9781484334188.006
[16] Quinn, D. P., & Voth, H.-J. (2008). A Century of Global Equity Market Correlations.
American Economic Review, 98(2), 535–540. https://doi.org/10.1257/aer.98.2.535
[17] Williams, J. B. (1938). The Theory of Investment Value (Vol. 36). Cambridge, MA: Har-vard University Press.
Chapter 1
The Bright Side of the Decline in the
Benefits of International Portfolio
Diversification
This chapter was presented at the Dauphine Financial Economics Workshop (Paris, 2019) and the European Economics and Finance Society Conference (Genoa, 2019).
1.1. Introduction
Measuring international diversification benefits (IDB) is a crucial issue in the finance literature. Markowitz (1952) demonstrates that investing primarily in the least correlated securities im-proves the risk-return profile of portfolios. Based on this framework, the seminal paper of Gru-bel (1968) notes that stockholders can enhance the risk-return ratio of domestic portfolios by investing in foreign securities. In recent decades, the potential benefits of international diversi-fication have become even more compelling, as financial integration broadened the pool of in-vestment opportunities and reduced the costs of investing abroad (Goetzmann et al., 2005).
However, Longin and Solnik (1995), among others, highlight that this process might have gone
hand in hand with increased comovements among equity markets, leading to a decline in the IDB of equity portfolios.
Studying the dynamics of stock market correlation is thus critical to determine the evolution of IDB. Existing studies investigate this issue with contradictory results. Many scholars confirm that stock market correlation has increased over time (e.g., Pukthuanthong and Roll, 2009; Christoffersen et al., 2014; Eiling and Gerard, 2015; Billio et al., 2017; Jordà et al., 2019). On the contrary, other papers find no or limited evidence of a rise in equity market comovements (e.g., King et al., 1994; Berben and Jansen 2005; Kearney and Potì, 2006; Bekaert et al., 2009; Evans et al., 2017). These controversial conclusions could be due to (i) different methods of estimating correlation and testing for trends, (ii) various samples and periods of analysis, and (iii) distinct granularities of base assets (e.g., country indices, local industry portfolios, or indi-vidual securities).
This chapter explores the impact of data granularity on the long-term evolution of stock market correlation and the interpretation of the correlation-based IDB measure described by Christoffersen et al. (2014). We find that data granularity is a central consideration in studying the evolution of IDB. The standard in the finance literature is to analyze IDB based on the correlation between country indices. By contrast, using more disaggregated data leads to con-tradictory findings. We thus develop alternative indicators that yield consistent results regard-less of data granularity and help reconcile previous findings. Another advantage of these alter-native measures is to provide a decomposition of IDB’s main drivers. Specifically, we highlight
that the decline in IDB is not as severe as it might seem, as it partly stems from the rise in the benefits of domestic diversification.
Our first contribution to the literature is to compare the evolution of stock market correla-tion using different types of base assets. This chapter complements previous papers by investi-gating both international and domestic relationships among local industries and individual se-curities. We show that using different types of data granularity leads to contradictory findings that we attempt to explain and reconcile. Moreover, our analysis uses up-to-date data, as we believe that the conclusions of the previous studies may be affected by the transitory impact of the global financial crisis (2007–2009) and the European debt crisis (2010–2012) on stock mar-ket correlation.
Second, this chapter discusses the impact of data granularity on the interpretation of the correlation-based IDB measure. We show that estimating correlation among country indices leads to an IDB measure that captures the relative gains of holding an international portfolio instead of the average domestic one (relative IDB). By contrast, estimating correlation among more disaggregated firm-level or local industry indices results in an IDB measure that compares the benefits of holding an international portfolio over the average stock or local industry port-folio (absolute IDB). Relative and absolute IDB measures can lead to different conclusions, as the relative IDB are also affected by the benefits of diversification within the domestic portfo-lio. We refer to these indicators as the standard IDB measures.
Third, we propose a relative IDB measure that makes the impact of data granularity on IDB negligible in most cases (ratio-based IDB measure). Specifically, we scale the absolute IDB measure by the domestic diversification benefits (i.e., the gain of holding a country portfolio instead of the average asset). The advantages of this adjusted indicator, compared to the standard one, are threefold: (i) it can consistently measure the relative IDB irrespective of the type of data granularity, (ii) it enables us to study IDB for different kinds of domestic inves-tors, and (iii) it provides insights into the underlying forces driving the evolution of the relative IDB.
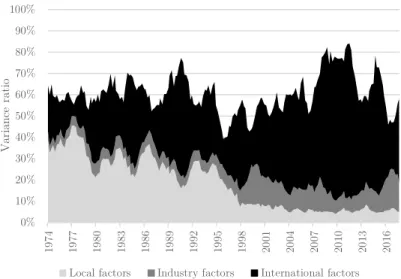
Fourth, this chapter points out that the variations in the global systematic risk (i.e., inter-national factors) impact the standard and ratio-based IDB indicators. We argue that a reliable IDB measure should capture the ability to reduce diversifiable risk but should not be affected
by the level of non-diversifiable risk. Indeed, non-diversifiable risks have an identical impact on the (average) domestic and international portfolios, so they do not influence local investors’ incentive to invest abroad. We thus propose an additional measure of the relative IDB based on the spread between the absolute benefits of international and domestic diversification (spread-based IDB measure). This indicator is more robust to changes in the global systematic risk than the standard and ratio-based IDB measures.
Beyond the methodological contributions, our empirical analysis enriches the existing litera-ture in several ways. Based on a sample of 15 European stock markets over 45 years (1973– 2018), we highlight that the choice of base assets (e.g., country indices, local industry portfoli-os, or individual securities) impacts the evolution of international stock market correlation. We find that the comovements between country indices have increased over time, while those among local industry indices or individual firms have remained more stable in the long run. Some papers argue that the increase in companies’ international activities should lead to a permanent rise in the comovements among individual stocks around the world (e.g., Longin and Solnik, 1995). We do not confirm this hypothesis. Instead, we find some evidence that companies have become less correlated with the stock prices of other local firms. Therefore, IDB have declined over time in relative terms but have remained roughly stable in absolute terms.
Our findings are related to studies examining the impact of international activities on stock market correlation and factor loadings. Brooks and Del Negro (2006) find cross-sectional evi-dence that firms’ international activities positively influence global factor loadings and nega-tively impact local factor loadings. Cai and Warnock (2012) and Berrill et al. (2019) also note that US multinational firms are (i) more exposed to foreign shocks than locally oriented firms and (ii) less correlated with the US domestic index, respectively. We complement these results by examining the dynamics of local and international stock market correlation over the past four decades.
Our conclusions are also linked to the literature studying the evolution of stock exposures to country, industry, and international shocks. While previous papers focus primarily on whether investors should diversify across countries or global sectors (e.g., Eiling et al., 2012), we exam-ine whether domestic investors should invest abroad or stay at home. Some scholars also state
that the rise in comovements among country indices can stem from (i) an increase in global factor loadings, (ii) an increase in global factor volatility, or (iii) a decrease in idiosyncratic risk (e.g., Bekaert et al., 2009; Pukthuanthong and Roll, 2009; Eiling and Gerard, 2015). This chap-ter complements their approach by suggesting to decompose the rise in the correlation among country indices into (i) an increase in international comovements across firms or (ii) a decrease in domestic comovements across companies. The advantage of our framework lies in its direct implications regarding the benefits of portfolio diversification. Furthermore, asset-pricing mod-els can be affected by missing or misspecified factors (e.g., Gagliardini et al., 2019), and previ-ous studies generally do not attempt to infer the level of domestic and international intra-portfolio correlation from their results.
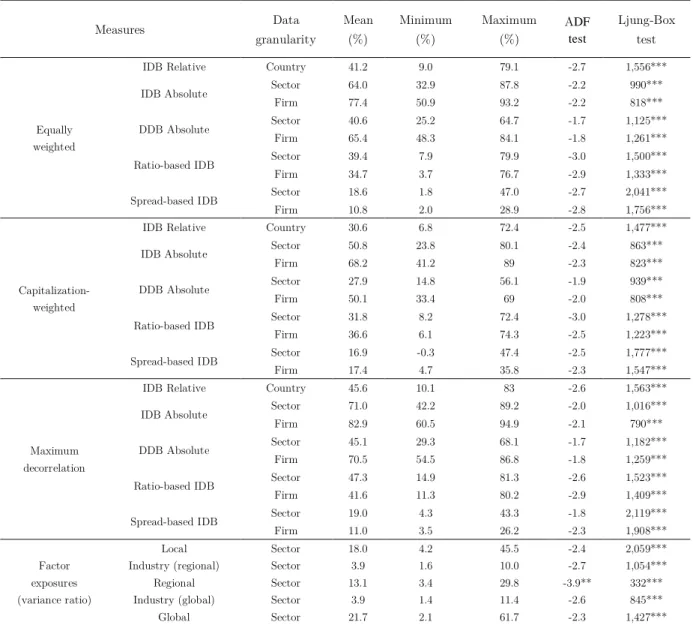
Finally, based on the standard and ratio-based IDB indicators, we confirm previous results showing that the relative IDB decreased from 1974 to the late 2000s but rebounded in the 2010s (e.g., Evans et al., 2017). On the other hand, the spread-based IDB indicator highlights that the relative benefits of international diversification mainly declined from 1974 to the end of the 1990s and did not rise again. This result suggests that most of the variations in the standard and ratio-based IDB measures from 2001 to 2018 resulted from changes in the global systematic risk. The spread-based IDB indicator, which is more robust to shifts in non-diversifiable risks, thus helps to explain why European investors remain significantly biased toward domestic assets (equity home bias).
The remainder of this chapter is structured as follows: Section 1.2 reviews the related litera-ture; Section 1.3 describes the impact of data granularity on the interpretation of the correla-tion-based IDB measure and proposes alternative indicators; Section 1.4 carries out an
empiri-cal study based on European stock markets; Section 1.5 presents robustness tests; Section 1.6
concludes.
1.2. Related literature
The standard approach to measure the benefits of international portfolio diversification is the mean-variance methodology. This method is based on a comparison of the risk-return profiles
frontiers from given sets of securities, representing the best asset combinations in terms of ex-pected returns and risk. Using spanning tests, De Roon et al. (2001) compare the efficient fron-tiers of distinct baskets of domestic and international stocks and discover that US stockholders can substantially improve their portfolios by investing in emerging markets. However, the evi-dence is more limited when the authors control for transaction costs and short-sales con-straints. Driessen and Laeven (2007) generalize the previous study for a large panel of coun-tries. They highlight that, although diversification gains have decreased over time, most do-mestic investors can still benefit from investing abroad.
The mean-variance framework has some limitations. In particular, it is sensitive to varia-tions or errors in the estimation of the input parameters (Black and Litterman, 1991). While variances and correlations can be computed quite precisely, expected returns are difficult to estimate (Merton, 1980). Furthermore, the mean-variance approach is a static framework, as it does not readjust the asset allocation over time. The methodology is thus poorly suited to ana-lyze the long-term evolution of IDB. To tackle this issue, the literature suggests using the in-verse of international stock return correlation as a simplified “correlation-based” IDB measure (see Section 1.3). This approach is suboptimal compared to the mean-variance methodology. Still, it tends to be more reliable for asset allocation, as it does not require the estimation of expected returns and variances (Christoffersen et al., 2014).
However, papers examining IDB based on the long-term evolution of stock market
correla-tion tend to find contradictory results.1 Beyond differences in sample, time frame, and
method-ology, we believe that studies yield conflicting findings depending on the type of underlying assets (i.e., country indices, domestic sectoral indices, or firm-level data). We summarize the main results of the papers that examine the dynamics of international stock return comove-ments in Table 1.1.
Studies based on country indices usually indicate that the benefits of international diversifi-cation have decreased over time. Longin and Solnik (1995) show that there is a positive time-trend in the conditional correlation between seven advanced markets (1960–1990). Using data
1 Most of the studies merely state that the increase in the correlation among stock markets led to a decline in the benefits of international diversification. We follow Christoffersen et al. (2014) who use a dynamic IDB measure based on the inverse of international correlation among equity markets.
on 82 countries (1965–2008), Pukthuanthong and Roll (2009) document that stock market comovements have risen over time, especially within European countries, leading to a decline in IDB. Based on a sample of 16 developed and 13 emerging markets (1973–2012), Christoffersen et al. (2014) find evidence of an upward trend in international stock return correlation. Focus-ing on 32 emergFocus-ing countries (1991–2009), EilFocus-ing and Gerard (2015) also note that emerging markets have become increasingly interdependent. Billio et al. (2017) compare the results based on different comovement measures for a sample of 27 markets (1973–2016). They find strong evidence of an increase in stock market interdependencies over time. Jordà et al. (2019) study the evolution of comovements among credit, house prices, and stock markets over the last 150 years for 17 countries. They emphasize that equity market interdependencies have sharply risen since the 1990s, reaching unprecedented levels. Bekaert and Mehl (2019) reach similar conclu-sions in their paper, indicating that stock market comovements followed a “swoosh” shape. One exception is the study of King et al. (1994), which does not find evidence of an upward trend in the correlation among 16 advanced stock markets (1970–1990).
On the other hand, studies based on local industry portfolios or firm-level data yield more mixed results. Kaltenhäuser (2002) shows that the correlation among domestic industry indices decreased from 1988 to 2002 within the euro area, the United Kingdom, and the United States. Carrieri et al. (2004) note that even fully integrated countries can have domestic industry port-folios segmented from the world market. Berben and Jansen (2005) assert that international correlation among domestic industry portfolios is lower than the comovements among country indices. They show that the interdependencies among country indices (Germany, Japan, the United Kingdom, and the United States) globally increased from 1980 to 2000. However, they find limited evidence of a rise in international correlation among local industries. Ratner and Leal (2005) reach the same conclusion based on the average comovements between the US
in-dustry indices and those of 37 developed and emerging countries (1981–2000). Kearney and
Potì (2006) reveal that the correlation between 42 individual European stocks remained stable over the period 1993-2002, in contrast to the interdependencies between five European country indices. Focusing on 26 industry portfolios within 23 developed and emerging countries (1980– 2005), Bekaert et al. (2009) find no evidence of an increase in comovements among industry portfolios. Interestingly, they do not detect an upward trend in the comovements among
na-tional indices either, except for European stock markets. Finally, Evans et al. (2017) confirm the findings of Berben and Jansen (2005) based on the G7 countries (2000–2013).
Table 1.1. Literature review
Papers Time frame Sample
Correlation dynamics Country indices Industry indices Firm-level data
King et al. (1994) 1973–1988 16 advanced
countries Stable n/a n/a
Longin and Solnik (1995) 1960-1990 7 advanced
countries Rise n/a n/a
Kaltenhäuser (2002) 1988–2002 Europe &
the US Rise Decrease n/a
Berben and Jansen (2005) 1980–2000 4 advanced
countries Rise
Mixed
results n/a
Ratner and Leal (2005) 1981–2000 US with
37 countries Rise
Mixed
results n/a
Kearney and Potì (2006) 1993–2002 European
countries Rise n/a Stable
Pukthuanthong and Roll (2009) 1973–2008 82 countries Rise n/a n/a
Bekaert et al. (2009) 1980–2005 23 countries Rise
(in Europe) Stable n/a
Christoffersen et al. (2014) 1973–2012 29 countries Rise n/a n/a
Eiling and Gerard (2015) 1991–2009 Emerging
markets Rise n/a n/a
Evans et al. (2017) 2000–2013 G7
countries Rise
Mixed
results n/a
Billio et al. (2017) 1973–2016 27 countries Rise n/a n/a
Jordà et al. (2019) 1870–2013 17 advanced
countries Rise n/a n/a
Bekaert and Mehl (2019) 1885–2014 17 advanced
countries Rise n/a n/a
Notes: This table reviews the papers that examine international correlation dynamics among countries, local industries, and
individual securities. The articles are sorted in order of publication.
1.3. Methodology
The correlation-based IDB measure was introduced by Christoffersen et al. (2014). This section describes under which assumptions and prerequisites this standard approach can be considered as a suitable IDB measure. Then, we propose alternative indicators to address some of the drawbacks of the standard metric.
1.3.a. Correlation-based measure: a simplified approach of diversification
The correlation-based measure of the benefits of international diversification ( ) is based
on Equation (1.1):
= 1 / (1.1)
in which = { , , }, i.e., country indices, local industry portfolios, or
individual securities, represents data granularity, and / stands for the average
corre-lation between the components of the international portfolio at date t, such as
/
= (1.2)
where is the correlation coefficient between assets i and j within the
interna-tional portfolio at date t. and represent the weights of each asset within the
interna-tional portfolio. IDB depend negatively on the degree of correlation among the components of the global portfolio (see Equation 1.1).
The correlation-based measure is a simplification of the mean-variance methodology
( ), which compares the risk-return profiles between two (optimal) portfolios (e.g., the
international portfolio and one of its components):
= 1 (1.3)
in which , , , and represent the expected returns and variances
of the international portfolio and its component i, respectively. The benefits of international diversification increase when the return-to-risk profile of the global portfolio rises compared to that of asset i. However, this approach is not properly suited for analyzing the evolution of IDB, as it requires expected returns, which are unknown, potentially unstable, and difficult to estimate.
We can circumvent this issue by comparing the risk-return profile of the international port-folio with that of its average component since both have the same expected returns:
=
=
where stands for the returns of the average component of the global portfolio. Equation (1.3) can be simplified as follows:
= 1
in which denotes the variance of the average component of the international
portfo-lio. The closer the variance of the average asset is to that of the global portfolio, the smaller the IDB.
Under the assumption that all the components of the international portfolio have the same variance (equal variance hypothesis), the average (intra-portfolio) correlation is equal to the ratio of the variance of the global portfolio to that of the average asset (see Equation 1.5). We test the equal variance hypothesis empirically, based on 15 European stock markets (1973– 2018), and show that it does not have a significant impact on the results in the long run (see Figure 1.4 in Appendix 1.1). Equation 1.5 is related to the “law of average covariance” (Markowitz, 1959), which states that, as the number of assets in a portfolio increases, the vari-ance of an equally weighted portfolio tends toward the average covarivari-ance among its compo-nents. We rely on the equal variance hypothesis so that the equality also stands for capitaliza-tion-weighted and maximum diversification portfolios.
=
= =
(1.4)
Under the assumption that = = for all i, j, Equation (1.4)
be-comes
=
= =
Then, based on Equation (1.2),
= /
/
Hence, an increase in international (intra-portfolio) correlation leads to a decrease in the bene-fits of international diversification, defined as the gains of holding the global portfolio over the average component.
The correlation-based measure is more appropriate than the mean-variance methodology to analyze the long-term evolution of IDB (Section 1.2). However, since it is a simplified ap-proach, correlation-based indicators have certain drawbacks. In most cases, the components of an international portfolio are heterogeneous, and the average asset is not always tradable. The correlation-based measure thus disregards the fact that some domestic investors may benefit more than others from investing abroad. Moreover, the method does not consider short sales, leverage, or other costs associated with foreign investments.
1.3.b. The relative and absolute benefits of international diversification
Based on domestic portfolios, the correlation-based IDB measure becomes
= 1 / = 1 (1.6)
The average correlation between country indices ( / ) compares the risk of a globally
diversified portfolio to that of the average country index. Therefore, the IDB measure based on country indices estimates the relative gains of holding a global portfolio over the average do-mestic one. This relative gain is expressed as a percentage of the variance of the average local portfolio. The advantage of this measure is to provide investors with a dynamic metric that can help them decide whether to hold a global or the average local portfolio.
Based on firm-level data or domestic sectoral portfolios, the correlation-based IDB measure becomes
= 1 /( ) = 1
( )
(1.7) The average correlation among individual stocks focuses on the benefits of holding a globally diversified portfolio over the average stock. In other words, it examines the absolute level of diversification within the international portfolio. While this method can compare the absolute benefits of investing internationally between different periods, it is of little practical interest for
investment decisions, as it does not help investors decide between holding a domestic or a glob-al portfolio.
Although quite close in appearance, the previously detailed measures estimate the relative and absolute IDB, respectively. Different levels of data granularity thus impact the interpreta-tion of IDB, which may contribute to explain some of the contradictory findings in the litera-ture. These elements indicate that data granularity should be carefully selected according to research purposes.
1.3.c. A ratio-based IDB measure
A reliable IDB measure should guide investment decisions and shed light on the equity home bias puzzle. While the relative approach seems to be better suited to clarify this problem, it has several limitations. First, it can only be estimated using country indices. Second, the measure focuses on one type of investor, typically holding capitalization-weighted portfolios. Third, it fails to provide transparency about the underlying forces driving the benefits of international diversification.
Therefore, we propose an adjusted indicator (ratio-based measure), which scales the absolute IDB measure by the domestic diversification benefits (i.e., the gain of holding a country portfo-lio instead of the average asset). This approach can measure the relative benefits of interna-tional diversification regardless of the type of data granularity (i.e., country indices, domestic sectoral portfolios, or firm-level data). It also allows us to study IDB for different types of do-mestic investors holding equally weighted, capitalization-weighted, or maximum decorrelation portfolios. Finally, using more disaggregated data enables one to examine the forces driving the evolution of the relative IDB.
Using local industry portfolios or individual securities, we can develop Equation (1.6) by re-stating the variance formulas of the international and domestic portfolios. We reformulate the variance of the international portfolio following Equations (1.4) and (1.5). Similarly, we repro-cess the variance of the average domestic portfolio as follows:
=
= /
in which = { , }, i.e., domestic sectoral indices or firm-level data, denotes
data granularity, / represents the average correlation within the average domestic
portfolio and, is the weight of each domestic portfolio k within the international portfolio.
The absolute level of the benefits of local diversification ( ) can be written as
= 1 / (1.8)
Then, the average correlation among country indices becomes the ratio between internation-al and locinternation-al (intra-portfolio) comovements:
/ = = / / = / / (1.9)
The ratio-based IDB measure ( ) can be stated as
= 1
/
/ (1.10a)
Based on Equations (1.7) and (1.8), we can also formulate Equation (1.10a) as follows:
= 1 1
1 (1.10b)
The adjusted IDB measure is based on the ratio between international and domestic (intra-portfolio) correlations. It can capture the relative gains of holding the global portfolio over the average country index regardless of data granularity. All else unchanged, the relative IDB de-cline (i) when the absolute level of international diversification drops or (ii) when the benefits of domestic diversification rise. Therefore, the ratio-based measure allows us to investigate the underlying forces driving IDB. Similarly, Equation (1.9) suggests splitting the rise in interde-pendencies among country indices into two components: (i) an increase in international comovements across firms or (ii) a decrease in domestic linkages between companies. As men-tioned before, the advantage of this framework over previous approaches lies in its direct impli-cations for asset allocation.
1.3.d. A spread-based IDB measure
The global systematic risk cannot be diversified and equally impacts the international and the average domestic portfolios. Non-diversifiable risks thus do not influence local investors’ incen-tive to invest abroad. Hence, we argue that relaincen-tive IDB measures should not consider the global systematic risk. However, we show that the standard and ratio-based IDB measures are not robust to shifts in non-diversifiable risks. In fact, any increase in the influence of global factors generates an equal rise in the variances of the global and average national portfolio, leading to a decrease in the relative IDB measure (i.e., ratio effect). Let us consider the follow-ing equation:
= + +
where = 0, < , and = 0; represents the returns of the
interna-tional and the average domestic portfolios, respectively; and is an internainterna-tional factor that equally impacts the two portfolios. The variance of depends on (a) the exposure to the in-ternational factor, (b) the variance of the inin-ternational factor, and (c) an idiosyncratic compo-nent (see Equation 1.11).
= + (1.11)
Based on Equations (1.9), (1.10a), and (1.11), we restate the relative IDB measure:
= 1 +
+
Since the idiosyncratic part of the variance of the international portfolio is less than or equal to that of the average domestic one, an increase in the global systematic risk leads to a rise of the variance ratio.
/ /
/ /
( ) ( )
in which the exponents h and l represent periods when the influence of the systematic risk is strong or low, respectively. Since the relative IDB measure is based on a correlation ratio (or a variance ratio), a rise in the global systematic risk would, all else unchanged, lead to a decrease in the ratio-based IDB measure. This finding is close to Forbes and Rigobon (2002), who show that the correlation coefficient between countries is not robust to heteroscedasticity.
As an alternative IDB measure, we propose to focus on the spread between domestic and in-ternational (intra-portfolio) correlations, such as
= / / (1.12a)
Based on Equations (1.7) and (1.8), we can also formulate Equation (1.12a) as follows:
= (1.12b)
Unlike ratio-based measures, spread-based measures are robust to similar changes in the
do-mestic and international (intra-portfolio) correlation.2 This approach is expressed in percentage
points (of correlation) rather than in percent increase. This new measure can be computed us-ing local industry portfolios or firm-level data.
1.4. Empirical application
This section carries out an empirical study based on 15 European stock markets from 1973 to 2018. First, we compare the evolution of the inverse of international stock return correlation using three types of base assets (i.e., country indices, local industry portfolios, and individual stocks). Then, we investigate the evolution of the benefits of European diversification using the ratio-based IDB measure and test the consistency of the results against different data granular-ities and portfolio-weighting schemes. We also study the main underlying drivers of the relative
2 Note that the spread-based measure is not totally immune to changes in systematic risk because global factors do not have an identical impact on international and domestic (intra-portfolio) correlations. Nevertheless, the effect of shifts in non-diversifiable risks is largely mitigated. To further reduce the global factor bias in this new measure, we eliminate the diagonal from the average of the correlation matrix, as it makes the impact of systematic risk more significant on smaller and less granular portfolios. The main results are also robust to the inclusion of this diagonal (see Section 1.5).
benefits of European diversification, namely the absolute levels of European and domestic di-versification. Finally, we present the results of our spread-based IDB measure, which is more robust to the impact of international factors than the ratio-based indicator. This application is of interest to European investors wishing to improve the return-to-risk profile of their portfolios by better understanding the sources of diversification benefits in the region.
1.4.a. Data
Our empirical analysis is based on weekly returns from 15 European stock markets (Austria, Belgium, Denmark, Finland, France, Germany, Ireland, Italy, the Netherlands, Norway, Portu-gal, Spain, Sweden, Switzerland, and the United Kingdom) over the 1973–2018 period. Europe-an countries are Europe-an interesting case study since they have undergone a substEurope-antial economic and financial integration process. Moreover, the dynamics of the comovements among Europe-an markets received considerable attention, allowing us to compare our results with previous findings. Note that four countries are not members of the euro area (Norway, Sweden, Switzer-land, and the United Kingdom), which permits us to check whether the inclusion in the mone-tary union affects the results (see Table 1.9; Appendix 1.4). Finally, we focus on a restricted sample (European rather than international markets) to limit computational complexity— which increases rapidly with the sample size, especially with firm-level data.
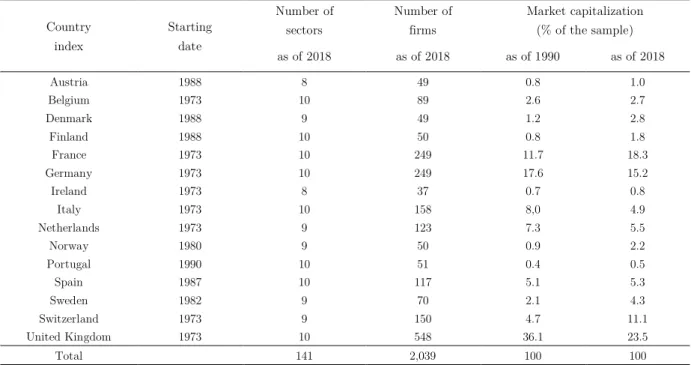
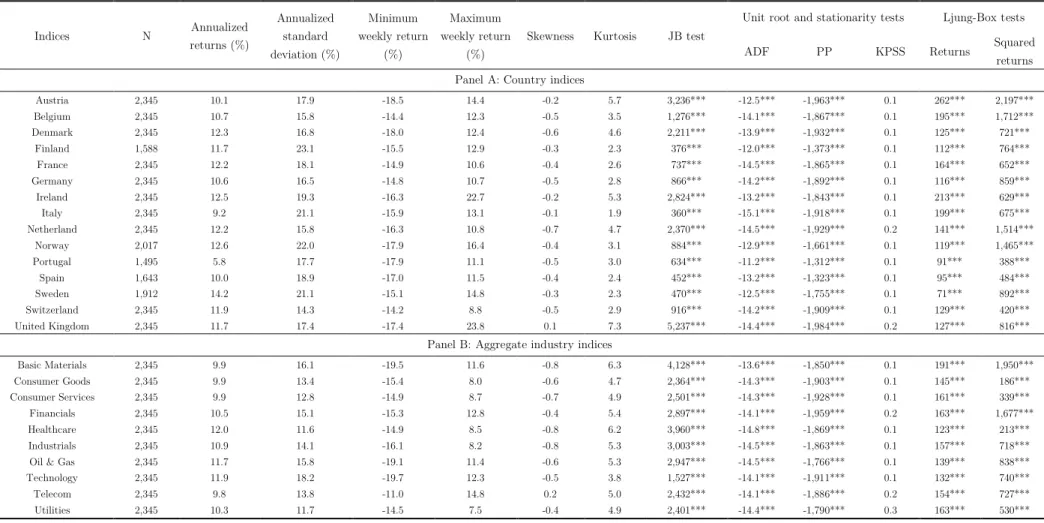
We use three types of granularity: country indices (i.e., aggregate domestic portfolios), local industry portfolios, and firm-level data. Each country index can be decomposed into ten do-mestic sectoral indices (subject to availability), which contain several firms (see Table 1.2). We use Datastream Global Equity Indices, which are built according to the FTSE-Dow Jones In-dustry Classification Benchmark. These indices are capitalization-weighted and include divi-dends. The Level 2 indices consist of the ten following sectors: Basic Materials, Consumer Goods, Consumer Services, Financials, Healthcare, Industrials, Oil&Gas, Technology, Tele-communications, and Utilities. Each index represents more than 75% of the market capitaliza-tion of the related country or sector. We use Datastream indices instead of those provided by local stock exchanges, as they are built according to a unique methodology. Moreover, there is no overlap between indices, as foreign listings are excluded from each index. As of 2018, our database includes 15 country indices, which consist of 141 domestic sectoral indices and 2,039
firms. For a given country, domestic data are included in our analysis as soon as at least five domestic sectoral indices and ten firms are available.
Table 1.2. Description of the data
Country index Starting date Number of sectors Number of firms Market capitalization (% of the sample) as of 2018 as of 2018 as of 1990 as of 2018 Austria 1988 8 49 0.8 1.0 Belgium 1973 10 89 2.6 2.7 Denmark 1988 9 49 1.2 2.8 Finland 1988 10 50 0.8 1.8 France 1973 10 249 11.7 18.3 Germany 1973 10 249 17.6 15.2 Ireland 1973 8 37 0.7 0.8 Italy 1973 10 158 8,0 4.9 Netherlands 1973 9 123 7.3 5.5 Norway 1980 9 50 0.9 2.2 Portugal 1990 10 51 0.4 0.5 Spain 1987 10 117 5.1 5.3 Sweden 1982 9 70 2.1 4.3 Switzerland 1973 9 150 4.7 11.1 United Kingdom 1973 10 548 36.1 23.5 Total 141 2,039 100 100
Notes: We compare the market capitalization of the indices between 1990 (first observation for which all national indices
are available) and 2018 (last observation available).
Three challenges emerge when dealing with stock market correlation: missing data, the non-alignment of time zones, and the differences of currencies. The existence of missing data, which stems from non-synchronized public holidays between countries, can bias the estimation of
comovements among markets.3 Financial markets also have different opening and closing hours,
implying partial (or the absence of) overlapping trading hours. We fix these issues by calculat-ing weekly returns, even though docalculat-ing so induces a loss of observations and information com-pared to daily return calculations. We compute linear returns using averages of the daily clos-ing prices for each week, instead of the more common Friday-to-Friday or Wednesday-to-Wednesday approaches. Returns based on means of daily closing prices are more representative of the events of the entire week, while the other methods suffer from a daily bias. Friday-to-Friday returns tend to be (i) less correlated with Wednesday-to-Wednesday returns than those based on average prices and (ii) more volatile than returns based on the two other methods
3 Datastream deals with missing data by replacing each missing observation by the previous one, which preserves the size of the database.