HAL Id: halshs-00001593
https://halshs.archives-ouvertes.fr/halshs-00001593
Submitted on 20 May 2004
HAL is a multi-disciplinary open access
archive for the deposit and dissemination of
sci-entific research documents, whether they are
pub-lished or not. The documents may come from
teaching and research institutions in France or
abroad, or from public or private research centers.
L’archive ouverte pluridisciplinaire HAL, est
destinée au dépôt et à la diffusion de documents
scientifiques de niveau recherche, publiés ou non,
émanant des établissements d’enseignement et de
recherche français ou étrangers, des laboratoires
publics ou privés.
Minh Ha-Duong, Gérard Mégie, Didier Hauglustaine
To cite this version:
Minh Ha-Duong, Gérard Mégie, Didier Hauglustaine. A pro-active stratospheric ozone protection
sce-nario. Global Environmental Change, Elsevier, 2003, 31 (1), pp.43-49.
�10.1016/S0959-3780(02)00087-0�. �halshs-00001593�
scenario
Minh Ha-Duong
∗G´erard M´egie
†Didier Hauglustaine
‡November 21, 2002
Abstract
We explore the consequences of an earlier phase-out of Ozone Depleting Sub-stances, starting ten years before the Montreal Protocol. Atmospheric chemistry simulations verify the effectiveness of such an early-action scenario: stratospheric chlorine abundance remains below the level at which the ozone hole was discov-ered, even though countries are permanently allowed to continue using ODS to a non-negligible extent. A sectorally detailed technico-economic analysis finds that the additional cost of the earlier action scenario would have been moderate. We conclude that the Montreal Protocol was only partially successful at precaution: global atmospheric environmental problems could be regulated before surprising non-linearities occur.
Introduction
The worldwide control on substances depleting the stratospheric ozone layer is often regarded as an exemplary success of global environmental policy. We would like to qualify this point of view, by observing that while scientific warning came as early as the mid seventies [Molina and Rowland, 1974], corrective action came too late to prevent the infamous ‘hole’ over the antarctic. It is somewhat disturbing to think that the best global atmospheric environmental policy has been implemented only after a large-scale non-linearity was observed, in a reactive mode.
This article offers a counter-factual pro-active scenario. It explores the plausibil-ity and the consequences of an incomplete but earlier phase-out of Ozone Depleting Substances. Coupling atmospheric chemistry simulations with a technico-economic model, we verify that such a precautionary emission profile could have been effective at a moderate cost.
∗CNRS, Centre International de Recherche sur l’Environnement et le Dveloppement, Nogent sur Marne,
France. Mail to: Department of Engineering and Public Policy, Carnegie Mellon University, 5000 Forbes Avenue, PA 15213 Pittsburgh, USA. EMail to: [email protected]. Telephone: +1 412 268 4640. Fax: +1 412 268 3757.
†CNRS, Paris, France.
‡CNRS, Service d’A´eronomie, Paris, France.
The stratospheric ozone story
In 1986, the worldwide production of organo-halogenated compounds, among which chlorofluorocarbons (CFC 11 and 12), reached about 1.5 million tons. This figure includes the production officially recorded by Western producing countries, and a more approximative value of the production of Eastern countries and China.
These compounds were then emitted in the atmosphere within a variable delay, depending of course on their use. In the case of aerosol sprays, they were being emitted immediately, whereas for refrigeration uses, it could take several years. CFCs used in the production of insulation foams are trapped within the closed cells of the rigid foam, so their release can occur decades after production if they are used in furniture or building materials. There is also a several-years long latency between the production and the release of Halons, another family of ozone-depleting substances: they are used in fire suppression systems with a typical shelf life of twenty years.
In addition to this former period of latency, a second time period of 5 to 7 years on average is necessary for chlorofluorocarbons to reach the stratosphere and be photo-dissociated by solar radiation. Therefore, from the production of these gases to their negative consequences on stratospheric ozone, an average delay of ten years has oc-curred. As such, the state of the ozone destruction cycle in 1998 was mostly determined by CFCs emitted before the end of the 1980s — that is before regulations were taken. This is why chlorine content in the stratosphere has kept increasing after CFC produc-tion has been virtually stopped in 1995–1997, and why the relative concentraproduc-tion of stratospheric chlorine is reaching its maximum value around 2000–2001.
This inertia linked to atmospheric time constants has two effects:
First, the the mid-1980s early observations of evolutive trends only included CFCs emissions anterior to 1970. This is less than 25% of the total historical emissions by that date. Between 1950 and 1986, CFCs production had increased by 6 to 10% per year, on average. In other words, the observed impact is a relatively small fraction of the impact yet to come but already committed to. The destructive effects of CFCs emissions have then been unknown for a rather long time.
Second, once regulations have been implemented, their positive impacts can only be measured after a decade. This is only the time to record a change in trends. The return to equilibrium will be much longer, for it depends on the CFCs lifetime, which varies from several decades to several centuries, depending on the specific compound being considered.
The consequence of the fast emission growth is that the stratospheric chlorine con-tent has been multiplied by almost a factor of seven, from 0.55 parts per billion (ppb) — the pre-industrial value linked to methyl chloride emissions by the oceans — to 3.8 ppb in 1995. The maximum level has probably been reached in 2000 and one will have to wait until 2050 to observe a return to values lower than 2 ppb. This level, which was reached for the first time in the stratosphere in 1980, is considered as critical as it corresponds to the first observation of large ozone destruction in the polar regions in relation with heterogeneous chemistry processes (the antarctic ozone hole).
We base our current quantitative understanding of the mechanisms which govern the behavior of stratospheric ozone on sophisticated numeric models that simulate well the chemical and physical reactions in the atmosphere. Such a model, IECC
by Hauglustaine and G´erard [1991], will be used in the next section, but let us give away right now the answer to the most important qualitative question: what would be a safe emission ceiling?
It is possible to calculate rather precisely the maximum amount of organic chlorine that the stratosphere is able to assimilate each year, if we want the chlorine loading to remain below the critical 2 ppbv ceiling. This quantity corresponds to 200 000 tons of chlorine emitted in the form of chlorofluorocarbons, which corresponds only to 20% of the maximum emissions of 1986 and 1987.
When the Montreal Protocol was first signed in 1987, the total production of CFCs was of 1 million tons. Thus, this production would have to be reduced by a factor of 5 in order to stabilize the stratospheric chlorine content. The Montreal Protocol could thus be considered as half a solution, as it recommended to reduce CFCs emissions by 50 % only. Its sole consequence was to slow down the growth of stratospheric chlorine concentration. Because of these quantitative figures, the return to an equilibrium clearly involved to totally stop CFCs emissions, at the shortest notice. This decision was taken in Copenhagen in 1992.
Another element has to be mentioned as the 200 000 tons level was first exceeded before 1970. Assuming a constant in time emission level of 1 million tons per year, each extra year of CFCs production introduces in the atmosphere 5 times more chlorine than what could be eliminated in the stratosphere. If no decision is being taken, 5 extra years will actually be necessary to return to values corresponding to the pre-industrial equilibrium.
The moral of this (his-) story is that a 50-year atmospheric imbalance resulted from 10 years of no-decision.
An counter-factual precautionary scenario
Let us go back to 1978. The worldwide production of organo-halogenated compounds is then 800 000 tons, which is four times the limit level. The stratospheric chlorine load is 1.2 ppb, twice the value of the pre-industrial era, still much below the level when phenomena linked to heterogeneous chemistry processes appear.
In the United States of America, the first assessments on the state of the ozone layer are published by the National Academy of Science. They are rather alarmist as for the reduction of the ozone layer, but rather moderate as for the potential consequences on human health and on the biosphere. Nevertheless, several countries decided to propose a reduction of the CFCs use in aerosol sprays. At that time, these uses represented almost 50% of the US production.
Let us assume that a strong application of the precautionary principle would have led to propose at the international level an immediate effective reduction of the order of 50% not of the consumption, but of the CFCs production. This would have resulted in a stabilization at 400 000 tons per year of this production for the following years, before further confirmation of the potentials risks of deterioration of the ozone layer.
Such a regulation would not have stopped the growth in the stratospheric chlorine content, since annual emissions are still way over the sustainable sink capacity consis-tent with the critical 2 ppbv ceiling. If we suppose that the CFCs production remains
limited to 400 000 tons for ever, the equilibrium level which will be reached within decades is still high, as it reaches 9 ppb.
But the first round of abatement would have immediately and largely reduced the rate of growth of the chlorine content, so that a year of no-decision before the imple-mentation of more drastic regulations would only imply an extra year before equilib-rium reappears. This growth reduction would for example allow to reach the relative concentration of 2 ppb in total chlorine content in the stratosphere only in 1988, and not in 1980 as precedently.
As the regulation measures have only been taken in 1978, they will not impact the stratosphere before the mid-1980s. One can thus consider that the effects observed until 1985 will be the same as in the real world so that the first reliable measurements of the global ozone trends which prove that the ozone concentration has actually decreased by 5% between 35 and 45 km in altitude will still be available. Although the total ozone content is only moderately affected, one can assume that these data are sufficient to implement new regulations at the international level.
This could correspond to a further reduction by 50% of the production. This pos-sibility is reinforced by the fact that substitution products which enable replacement of CFCs for their main uses (refrigeration, foams, solvents) are available then. This is a conservative assumption since in the counter-factual scenario, earlier and stronger regulations would have hastened rather than retarded the development of alternatives.
The yearly maximum emission is now limited to 200 000 tons. A last and slight reduction at the turn of the millennium enables to compensate the impact of the substi-tutes (the hydro-chlorofluorocarbons (HCFCs) which contains chlorine) whose effect on ozone, because of their shorter life time is greatly reduced as compared to that of the CFCs.
With this hypothetical scenario, two distinct actions within a decade would have allowed the stratospheric system to re-stabilize as soon as the early 1990s, with the stratospheric chlorine content at about 1.9 ppb. The plausibility of this counter-factual scenario hinges on two critical assumptions: that indeed 200 000 tons per year is an ac-ceptable limit for global emissions of organo-halogenated compounds, and that the cost of this counter-factual scenario is not inordinately large compared to what happened. These assumptions are supported by the numerical simulations presented next.
Numerical simulations: atmospheric chemistry
To simulate the consequences of the counter-factual scenario, we build an integrated assessment model by coupling two pre-existing models: the chemistry model IECC by Hauglustaine and G´erard [1991] with an economic model taken from Smith et al. [1997]. The atmospheric chemistry model checked that indeed the 2 ppb chlorine ceiling is respected.
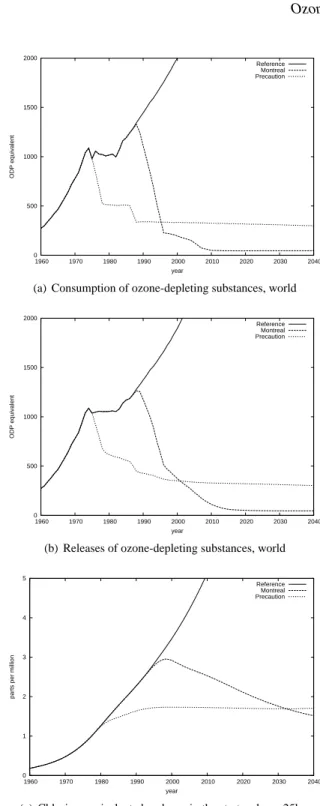
The coupled model tracks ODS consumption profiles from year 1975 to 2075, for fourteen technico-economic sectors (rows in table 1) and two political regions: indus-trialized or developing countries. The three scenarios represented figure 1 (top panel a) using Ozone Depletion Potentials from UNEP [1999] were determined as follows:
• TheMontrealscenario represents the historical emission profiles. For each sec-tor and region, emissions prior to year 1986 were taken from the IECC model source. Consumption levels posterior to this year were supposed to comply per-fectly with the control measures under the Montreal Protocol as amended in 1999, as summarized the reduction objectives published in UNEP [1999].
• ScenarioPrecautionrepresents the alternative counter-factual story where ac-tion starts 10 years sooner. Reducac-tions are uniform across all sectors. For de-veloped countries the first target is a fast cut to 50 percent of base year 1975 production by 1978, followed by a slow decrease to 45 percent in 1986. At that point the new target is set: 25 percent of base year emissions to be reached in 1988. Some consumption can go on to the long-term goal of 15 percent in 2070. Consumption in developing Article 5(1) Parties is simply frozen at the base year 1985 emissions level until 2070.
• Scenario Reference represents the hypothetical trajectory which would have been realized without regulations. This baseline is needed to compute the cost. Before 1986, we used the same data theMontrealscenario. For extrapolation beyond that date, we used the growth rates from Smith et al. [1997]. These projections are around two percent per year for most sectors in the long run, with higher rates initially especially in developing countries.
These future consumption scenarios defined over fourteen technico-economic sec-tors were dispatched across twenty-nine chemical species. To this end, we balanced a rectangular accounting matrix using data from AFEAS [1997] for year 1986, and then assumed that proportions remained the same for subsequent years. Depending upon the technical sector, ODP consumed in any given year are released over a time period going from one up to twenty years.
The release time profiles for twenty-nine ozone depleting substances so defined run from 1750 to 2100. Atmospheric abundance of these chemicals was computed using the IECC model by Hauglustaine and G´erard [1991]. This Integrated Emission-Composition-Climate is an intermediate complexity model that can be described as a seasonal one-and-a-half-dimensional energy-balance climate and chemistry atmo-sphere model, but for these simulations only the ODS chemistry part of the model was used.
Gases were assumed to follow a first-order dynamic, that is a constant lifetime. For each gas, the existing stock is replenished by anthropic emissions but decays at a con-stant exponential rate. Abundance is computed for two global reservoirs: tropospheric and stratospheric. Latitude or longitude distributions of ozone depleting gases were not represented.
Stratospheric results are reported for an altitude of about 25 km. The time lag for transport to this altitude is 5 years on average in the model, but to account for some variability in transport time, the mixing ratio in year t depends on releases in year
t − 3, t − 5 and t − 7 in respective proportions 20, 60 and 20 percent respectively.
In the results, the abundance of ozone-depleting compounds is reported as chlorine-equivalent, assuming that a bromine atom is worth 40 chlorine atoms.
0 500 1000 1500 2000 1960 1970 1980 1990 2000 2010 2020 2030 2040 ODP equivalent year Reference Montreal Precaution
(a) Consumption of ozone-depleting substances, world
0 500 1000 1500 2000 1960 1970 1980 1990 2000 2010 2020 2030 2040 ODP equivalent year Reference Montreal Precaution
(b) Releases of ozone-depleting substances, world
0 1 2 3 4 5 1960 1970 1980 1990 2000 2010 2020 2030 2040
parts per million
year
Reference Montreal Precaution
(c) Chlorine-equivalent abundance in the stratosphere, 25km
Figure 1: Consumption (top panel a) and releases (middle panel b) of Global Ozone-Depleting Substances, with resulting stratospheric chlorine-equivalent concentration (bottom panel c) under three alternative scenarios. Consumption and releases were ag-gregated using Ozone Depletion Potentials specified in the Montreal Protocol annexes A, B, C UNEP [1999] and are displayed using 106kg of Chlorine equivalent as verti-cal sverti-cale unit. The stratospheric mixing ratio at 25km in ppmv was computed with the IECC model [Hauglustaine and G´erard, 1991].
The model calibration can be assessed by comparing results of the factualMontreal
scenario with observations. Numerical simulations of tropospheric ozone abundance (not shown) peak at 3.6 ppbv in 1993 and 1994. This corresponds well to observed values as reported in Research and Project [1999, Executive Summary]. Stratospheric chlorine equivalent abundance, displayed on figure 1, bottom panel c, peaks at 2.9 ppbv in 1998–1999. The peak period is consistent with recent evidence stated by Re-search and Project [1999, Executive Summary] and with estimates reported by Enfel and Schmidt [2002].
Results for thePrecautionscenario illustrate the story-line informally given in the first part of this paper: Early action in the mid-seventies would have slowed the chlorine and bromine accumulation process in the atmosphere. The effect on the stratospheric concentration is somewhat lagged, due to release and transport times. Applying the brakes a second time in the mid eighties allows indeed to remain under the 2 ppmv ceiling under which the ozone hole would not have happened.
We conclude that even if the informal exposition of the counter-factual story-line was simplified, its main points are fully supported by the numerical simulations in a less simplified atmospheric chemistry model.
Numerical simulation: economics
The sectoral technico-economic model checked that the cost increase is relatively mod-est compared to the historical trajectory. We reproduced the methodology described by Smith et al. [1997] using the published equations and data, but re-did the computer code which was not publicly available. Ours is available under the GNU GPL license, as discussed in Ha-Duong [2001].
The general structure of the model is as follows: in each given sector, region and year, abatement cost is the quantity of Ozone Depleting Substances not used multi-plied by a marginal substitution cost in USD/kg. The marginal cost is specific to each of fourteen technico-economic sectors and to each of the two political regions. To-tal reduction cost obtains as the sum across the fourteen sectors and the two regions. Costs are then discounted intertemporally to 1997 dollars, using a five percent annual discount rate as the central value in the reference model.
Turning now to the important details of the model, marginal costs increase with the percentage of abatement, in order to reflect the issues of hard-to-substitute or essential uses of some ODS. Costs are evaluated at each period independently, there is no specific treatment of capital or adjustment costs which are included in the marginal cost of substitution.
Marginal cost estimates are presented Table 1, columns 1, 2 and in the notes. These are taken from the original Smith et al. [1997] study. These in turn come from published and industry sources, most importantly from the work of the UNEP Technology and Economic Assessment Panel [2001].
Substitution costs for CFC-Aerosols and some Halons are negative. Negative costs are paradoxical, since economic rationality apparently suggests that if CFC-substitutes were cheaper, then no CFC would be used. One explanation is that cheaper substitutes to CFC were not used because they were perceived as inferior in quality. For
0 2000 4000 6000 8000 10000 12000 14000 16000 18000 20000 1960 1970 1980 1990 2000 2010 2020 2030 2040 M$US year
Annual world spending to protect the ozone layer
Montreal Precaution
Figure 2: Global spending to replace Ozone-Depleting Substances emissions. The cost of substitution is aggregated over fourteen technico-economic sector. For each sector, the cost is the product of the quantity of chemicals used by the incremental substitution cost.
ple, hydrocarbons present a greater fire hazard when used as a propellant in aerosols. Admittedly, we are using a technico-economic model dealing only with financial costs, and this falls short to represent the total economic value.
Accounting for these foregone ancillary benefits of CFCs and Halons would be difficult. We did not find any estimates in the existing literature. We can only conjecture that they would not dramatically change the comparison between the counter-factual and the reference scenario.
Figure 2 displays the technico-economic model results. The solid line shows the factualMontrealscenario cost curve. The initial plateau correspond to 500 million dollars per year spend between 1974 to 1978 to develop CFC substitutes. The subse-quent gap between 1979 and 1986 corresponds to the period of scientific controversies before Montreal protocol. During this period there has been significant changes in the mix of CFC uses. But the cost curve is set at zero logically because this is a model of the costs of the Montreal protocol.
Consider now the additional cost of the more precautionary scenario. Compara-tively, it is about two billion dollars more annually during the first two decades. Then the costs are about the same during fifteen years. And then it brings a benefit of about one billion dollars a year after 2010. This benefit arises from the fact that ozone
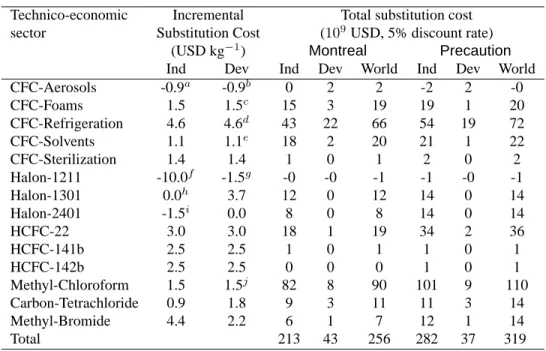
de-Technico-economic Incremental Total substitution cost sector Substitution Cost (109USD, 5% discount rate)
(USD kg−1) Montreal Precaution
Ind Dev Ind Dev World Ind Dev World
CFC-Aerosols -0.9a -0.9b 0 2 2 -2 2 -0 CFC-Foams 1.5 1.5c 15 3 19 19 1 20 CFC-Refrigeration 4.6 4.6d 43 22 66 54 19 72 CFC-Solvents 1.1 1.1e 18 2 20 21 1 22 CFC-Sterilization 1.4 1.4 1 0 1 2 0 2 Halon-1211 -10.0f -1.5g -0 -0 -1 -1 -0 -1 Halon-1301 0.0h 3.7 12 0 12 14 0 14 Halon-2401 -1.5i 0.0 8 0 8 14 0 14 HCFC-22 3.0 3.0 18 1 19 34 2 36 HCFC-141b 2.5 2.5 1 0 1 1 0 1 HCFC-142b 2.5 2.5 0 0 0 1 0 1 Methyl-Chloroform 1.5 1.5j 82 8 90 101 9 110 Carbon-Tetrachloride 0.9 1.8 9 3 11 11 3 14 Methyl-Bromide 4.4 2.2 6 1 7 12 1 14 Total 213 43 256 282 37 319
Notes to the table: aPlus a fixed development cost of 2.5 billion USD.bFor the first 35%, then 0$/kg for
the next 35%, then 2.7 $/kg. cFirst 50% then 8.3 $/kg. dFirst 60% then 6.9 $/kg for 10% then 15.6 $/kg. eFirst 50% then 1.7 $/kg for 40% then 15.8 $/kg.fFirst 90% then 75 $/kg.gFirst 90% then 3.7 $/kg.hFirst
75% then 120 $/kg.iFirst 60% then 30 $/kg.jFirst 75% then 3.9 $/kg.
Table 1: Ozone depleting substances abatement costs (billion $US1997) Results by technico-economic sector and geographic zone, for both scenarios, discounted over the time period 1974–2074 to 1997 dollars. Model and incremental substitution cost data from Smith et al. [1997].
pleting substances are not completely banned from the industry, but can still be used for essential purposes almost indefinitely.
This shows that comparing the two scenarios is essentially a question of intergen-erational burden-sharing. There is no universally accepted way to compare the two streams of expenses over such a long time period. Therefore, one could stop here and conclude by saying that the two cost curves are essentially of the same order of mag-nitude. Early action costs more up-front but saves some further down the road. The biggest benefits of early action would have been to avoid the ozone hole, but we did not quantify these benefits in monetary units here.
However, to present the results at a more detailed sectoral level it is necessary to aggregate the temporal dimension by using intertemporal discounting. We collapsed all costs profiles into 1997 US dollars at a 5% rate, summing from 1975 to 2075. As Smith et al. remarked, the total figures are highly sensitive to the discount rate. This is why the ozone depleting substances abatement costs, displayed table 1, should be explored cautiously and comparatively.
Reproducing Smith et al. [1997] model results, the total cost for the world in the
Chang-ing the discount rate by two points up or down changes the total substitution cost by about eighty percent.
It appears that the global cost is about thirteen percent higher in thePrecaution
relative to theMontreal scenario. A lower discount rate, or a longer time horizon, implies a smaller difference in costs. For example, at a 2% discount rate, we found that the difference was about three percent. A zero discount rate with a sufficiently long time horizon would certainly imply a cost advantage for the counter-factual scenario.
In all cases, this suggests that the additional costs of earlier action would have been modest, around ten percent of the total cost of action.
Conclusion
The protection of the ozone layer is admittedly a success, as ozone depletion levels are observed to be stabilizing now. Yet the environmental policy community should strive to achieve even greater successes in the global atmospheric challenges now in front of us. This paper asserts that greater success would have been possible, by showing that a scenario completely avoiding the hole in the Ozone layer was feasible at small additional cost.
Indeed in the mid seventies, early warnings led to a decade-long pause in the growth of Ozone-Depleting Substance emissions. Had they instead led to a significant reduc-tion in emissions, the hole could have been avoided. Moreover, significant essential use of CFCs and other substances could have been extended forever. This hypothetical scenario shows that with two distinct actions within a decade, the stratospheric system could have been re-stabilized by now.
The alternative ozone protection scenario was analyzed by coupling an atmospheric chemistry model with a sectoral economic model. Results shows that the more precau-tionary scenario costs about two billion of dollars per year more during the first two decades. But early action saves about one billion dollars a year after 2010, because it allows to continue using ozone-depleting substances for essential uses forever.
Admittedly, if the level of atmospheric chlorine had been controlled to remain under 2 ppb, then scientists would not have discovered the very importance of heterogeneous chemistry processes. They would still be convinced that the processes discovered in the 1960s are sufficient to explain the balance of the stratospheric ozone layer. The ecological disaster of the antarctic ozone hole would not have occurred. It is more difficult to convince pseudo-experts and skeptics of the merits of the second round of regulations.
This raises the question whether the ozone hole was necessary to spur the global community into more stringent CFC controls. We hope that others can answer this political science question, because it is fundamental to understanding the essence of the precautionary principle. In the real history, indeed skeptics were not convinced before the disaster.
Yet not only the impact of inaction was under-estimated, but Hammitt [1997] found that ex-ante cost of control estimates were considerably overestimated. The dynamics of technological change forced by the UNEP Technology and Economic Assessment Panel allowed control of emissions at a lower cost than initially tought.
Costs were overestimated and benefits underestimated. With perfect foresight, the cost-benefit analysis implicit in all policy decisions would probably have indicated that the early action scenario was superior. This is because it does not cost much more, and the benefits of avoiding the ozone hole are presumably large.
With this limited information available at the time, not following the precautionary trajectory might have been a rational choice. Yet when there is not much information, under deep uncertainty the different courses of action can not always be compared by balancing the costs and the benefits. The early action scenario could also have been a rational choice. Is not this the essence of the precautionary principle?
Our conclusion is that the Montreal Protocol was only a partially successful appli-cation of precaution. It might not be a bad idea to regulate global atmospheric environ-mental issues before surprising non-linearities occur.
References
AFEAS. Production, sales and atmospheric release of fluorocarbons through 1995, 1997. URLhttp://www.afeas.org.
Andreas Enfel and Ulrich Schmidt. An estimate of the trend of stratospheric chlo-rine loading based on in-situ balloon-borne observations. Chlorine Newsletter,
13, 2002. URL http://www.aero.jussieu.fr/˜sparc/news13/13_ Engel.html.
Minh Ha-Duong. Transparency and control in engineering integrated assessment mod-els. Integrated Assessment, 2(4):209–218, 2001.
James K. Hammitt. Economic Analyses at EPA - Assessing Regulatory Impact, chapter 6 Stratospheric-Ozone depletion, pages 131–169. Resources for the Future, Wash-ington, DC, 1997. Book ed. by Richard D. Morgenstern.
Didier A. Hauglustaine and J.-C. G´erard. Present and future CFC and other trace gas warming: Results from a seasonal climate model. Annales Geophysicae, 9:571–587, 1991.
M. J. Molina and F. Sherwood Rowland. Stratospheric sink for chlorofluoromethanes: chlorine atom-catalysed destruction of ozone. Nature, 239:810–812, 1974.
WMO Global Ozone Research and Monitoring Project. Scientific Assessment of Ozone
Depletion: 1998. Number Report number 44. World Meteorological
Organisa-tion, Geneva, 1999. URL http://www.al.noaa.gov/WWWHD/Pubdocs/ Assessment98.html.
Douglas A. Smith, Keith Vodden, Leon Rucker, and Rose Cunningham. Global benefits and costs of the montreal protocol on substances that deplete the ozone layer. Tech-nical report, Applied Research Consultants, September 1997. Published by Environ-ment Canada. Presented at the 10th Anniversary Colloquium, Montreal. Also avail-able in French as: Protocole de Montr´eal 1987-1997. Avantages et Coˆuts Mondiaux
du Protocole de Montr´eal Relatif `a des Substances qui Appauvrissent la Couche d’Ozone.
UNEP Technology and Montreal Protocol on Substances that Deplete the Ozone Layer Economic Assessment Panel. TEAP Report. United Nations Environement Pro-gramme, Ozone Secretariat, April 2001. ISBN 92-807-2034-1. URL http: //www.teap.org.
Ozone Secretariat UNEP. Production and consumption of ozone depleting substances, 1986-1998, 1999. URLhttp://www.unep.org/ozone/home.htm.
Acknowledgements: This collaborative research was supported by the CNRS grant APN-Mod´elisation Environnementale, Variabilit´e et D´ecision. Minh Ha-Duong ac-knowledges support from NATO and from the Engineering and Public Policy depart-ment at Carnegie Mellon University, Pittsburgh, PA during the finalization of this work. Thanks to Julie Giardina and two anonymous reviewers for useful comments.