OATAO is an open access repository that collects the work of Toulouse researchers and makes it freely available over the web where possible
Any correspondence concerning this service should be sent
to the repository administrator: [email protected]
This is an author’s version published in: http://oatao.univ-toulouse.fr/26869
To cite this version:
Lacaze, Jacques and Sertucha, Jon and Castro-Román, Manuel Jesus From atom scale to casting : A contemporary monograph on cast irons microstructure. (April 2021)
A CONTEMPORARY MONOGRAPH
ON CAST IRONS MICROSTRUCTURE
From atom scale to casting
Second edition - April 2021 Free downloading from OATAO
JACQUES LACAZE, JON SERTUCHA
MANUEL J. CASTRO-ROMÁN
This monograph is expected to be of value to foundry engineers and master or PhD students, as well as researchers involved in the field of graphitic cast irons.
This is an open access manuscript to be uploaded from the OATAO website in Toulouse, France.
It is intended to be interactive, i.e. to serve as a forum for discussion, constructive criticism, amendments and improvements. As such, it will be regularly updated. The first
edition was made available in November 2020, the second in April 2021.
As stated in the foreword, this monograph is not an in-depth literature review but rather aims to provide a comprehensive overview of the formation of the
microstructure of silicon cast irons based on the works that the authors have carried out together or separately over many years. All contributions aimed at completing this
overview are therefore welcome.
Special thanks are due to Gérard Lesoult for comments on the first edition and the many suggestions he made for improving it.
Content
Foreword
Chapter I – Cast irons at a glance
Chapter II – The Fe-C-Si phase diagram and the carbon equivalent Chapter III – Thermal analysis
Chapter IV – Austenite-graphite and austenite-cementite two-phase growth
Chapter V – Nucleation of graphite – Inoculation
Chapter VI – Crystallography and morphology of graphite
Chapter VII – Trace elements: graphite growth and degeneracy Chapter VIII – Solid-state phase transformations
Chapter IX – Microstructure modelling References
Glossary
Index of terms and physical properties
1
Authorisations for re-use of figures are listed on the last page
Foreword
This monograph finds its foundation in a simple fact: there is a paradigm with cast irons, which is that these alloys are produced and cast to shape since thousands of years but are amongst the most complicated metallic alloys when considering the formation of their microstructure by solidification and solid-state transformations. In turn, this complexity opens a wide range of possibilities for shaping their microstructure and engineering their service properties.
The first cast irons were mostly Fe-C alloys and as such solidified mainly in the metastable system, leading to hard and brittle parts that were heat treated for graphite precipitation to give malleable cast irons. The introduction of silicon into the melt increased the temperature difference between the stable and metastable systems, thus promoting the formation of graphite instead of cementite during solidification. This gave rise to the silicon cast irons that are the subject of this monograph.
With the advent of metallographic observations, it was realized that cast iron also often contained phosphides related to the origin of iron ores. A good control of the metallic charge allowed to improving the mechanical properties, in particular by ensuring a minimum elongation before rupture under tensile stress. The essential step, however, was the discovery that it is possible to change the shape of graphite by transforming the interconnected lamellae into discrete spheroids. Cast irons thus became a material for safety parts and were no more restricted to construction.
This historical evolution and the research effort during the first part of the 20th century are described in the vast review carried out by Merchant in the 1960s [MER68]. At that time, there was an explosion of research on cast irons with the aim of describing and understanding the formation of graphite during solidification and, to a lesser extent, during heat treatment. As far as solidification is concerned, the review by Lux [LUX70a, LUX70b] of this research effort is an important step that already contained most of the questions and provisional answers that are still referenced in more recent works [STE05]. It is worth mentioning here Zhou's comprehensive literature review on solidification of different types of cast iron [ZHO09, ZHO10, ZHO11].
This monograph is not intended to be an exhaustive review of the literature as those mentioned above, but rather to provide a coherent view of the formation of the microstructure of silicon cast irons. In fact, the authors felt it was very important to present how various aspects of microstructure formation could be related to each other using schemes based on known physical phenomena, and sometimes supported by ad hoc modelling. Consequently, the works that will be referenced first are those that contain information that has proven to be essential for the development of these
schemes. Where appropriate, controversies will be mentioned but not discussed, with reference to the works where they are detailed. Instead, emphasis will be on open questions.
The main text containing basic information and descriptions appears on odd-numbered pages, while details and more in-depth descriptions are limited to even-numbered pages. All references are listed at the end of the monograph, which also contains a glossary of acronyms and unusual terms and an index of the parameters used in the equations and the values employed for physical parameters.
For more than 10 years, our work has certainly benefited from Azterlan's impetus and has greatly benefited from the dynamism of the European Cast Iron (ECI) group. The exchanges within this group, as well as the discussions and controversies that have taken place at its annual meetings have been renewed stimuli. We would like to thank the participants, both academics and industrialists, for their continued contribution to this group.
5
Chapter I – Cast irons at a glance
Cast iron emerged during the Iron Age when the temperature reached in the blast furnace became high enough. Though iron processing may have started in Middle East, the first crafts, tools and weapons made of cast irons date back to 500 BCE in China [TAN10, STE17a]. Later development of cast iron in China benefited of the long-standing knowledge of casting technology acquired on bronzes and other alloys that allowed refined jewellery as well as gigantic artefacts to be manufactured, see Fig. I-1.
Figure I-1. Iron lion of Cangzhou, 953 AD [TAN10].
Cast irons have developed thanks to their good corrosion resistance - think of the famous water pipes in Versailles - as well as their resistance to oxidation that made them suitable for pots and pans for example. However, they are sensitive to rust in the long term, which may explain why small antique objects are rare or unidentified as they are most certainly rust pellets nowadays.
Until the 19th century, the composition of the cast parts was given by that of the iron ore [WIT59], though high carbon and silicon contents were certainly helpful in melting and processing the alloys.
During the first half of the 19th century, the changes in the melting furnaces led to an increase in the silicon content in the charges for cast parts. Although this was found later not to be a good design choice, it is worth mentioning the use of cast irons at that time for house building and bridges [STE17a].
6 The biggest and the smoothest
Cast iron is so "easy" that it is used to make gigantic parts such as windmill hubs and huge boat engines. Figure I-2 gives an example of this, where the staircase can be used for a scale estimate.
Figure I-2: The biggest or nearly so (Wärtsilä X62 engine)
(https://www.wartsila.com/media/news/08-01-2015-wartsila-x62-engine-now-fully-approved- and-available-to-the-market)
For the 2019 European Cast Iron (ECI) meeting in Ljubljana, the host group cast disk-shaped medals 116 mm in diameter and 5 mm in thickness. The mould was prepared by the lost wax process and attention was put on perfect filling and on surface quality. Fig. I-3 shows the central part of the medal and illustrates that a high level of small details could be reproduced.
Figure 1-3. The photograph on the left shows the central part of a medal cast by the lost wax process, with the square in the centre being one cm2 in size.
The colour map on the right shows the surface roughness in the very centre of the medal, with the water basin in front of the castle (courtesy Sandrine Duluard, CIRIMAT).
7
In fact, brittleness was a concern because of the lamellar shape of graphite and when the parts contained cementite or phosphides. With the advent of chemical analysis and of microstructure observations, and with progress in melt procedures, it was finally found how to manipulate the composition (e.g. removing phosphorus) and the matrix of lamellar graphite cast irons (LGI). Note that LGI would have been better named flake graphite cast irons because the wording "flake"
encompasses the various forms of graphite of concerns, namely plate-like, lamellar and undercooled.
Finally, this is also during the first half of the 20th century that inoculation was introduced.
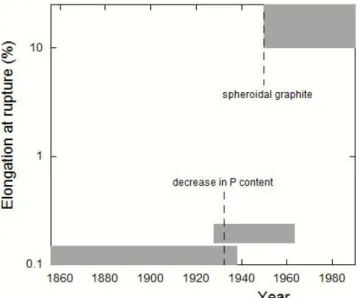
Until the mid of the 20th century, the main concern was low ductility and associated moderate tensile strength because of the lamellar shape of graphite. Things had suddenly evolved when it was found possible to change the graphite shape to discrete nodules in so-called spheroidal graphite cast irons (SGI). The effect of this development is illustrated for the case of cast iron pipes in Fig. I-4, but in fact applies to all types of castings. Since the discovery of the spheroidising treatment, SGI developed in many industries associating good casting ability for making complex shapes and good mechanical properties including fatigue properties.
Figure I-4. Evolution of the elongation at rupture of cast iron used for water pipes.
A first improvement in 1934 consisted in halving the phosphorus content of the metal together with adopting casting in metallic dies instead of sand moulds. The change in cooling rate resulted in a strong shortening of graphite lamellae. The dramatic change in the 1950 is due to casting SGI
instead of LGI. Adapted from Lesoult et al. [LES84].
Millis et al. received a patent in 1949 for a grey iron having improved properties because graphite assumed a more compact shape than usual flakes. This was achieved by adding a controlled amount of magnesium, and such irons became later known as compacted graphite irons (CGI). However, this is only in the 1960s that it was found interesting to generate this intermediate graphite form, see the review by Nechtelberger et al. [NEC82]. CGI have thus been in use for a long time but this was only for niche applications until the development of a proper thermal analysis control of melt preparation just before casting. Since the beginning of the 21st century, CGI is breaking the market of automotive engines and components.
8 Compacted graphite and the role of spheroidisers
Graphite is industrially spheroidised by addition of magnesium and rare earths (RE), see chapters VI and VII. In contrast, there are several ways to generate compacted graphite as reviewed by Nechtelberger et al. [NEC82]. However, the most usual is by limited additions of Mg and RE when compared to SGI. Fig. I-5 shows the change in graphite nodularity as function of Mg content [DAW02], with indication of the domains for LGI (so called "grey" in the figure), CGI and SGI (called
"ductile iron" in the figure). Note that the nodularity was set negative for lamellar graphite to emphasize that the industrial nodularity scale is defined for compacted and spheroidal graphite and not for lamellar graphite for which letters (A-E) are used to differentiate the various shapes [DAW03].
Figure I-5. Evolution of graphite shape with Mg content [DAW02] (courtesy SinterCast).
What is the precise mechanism of the action of the spheroidisers is still unknown, or at least controversial. The first effect of magnesium and rare earths has long been associated to their high affinity with oxygen and sulphur, i.e. considering that change in graphite shape is controlled by tightening oxygen and sulphur as oxy-sulphides. Subramanian et al [SUB82] therefore suggested associating the different forms of graphite with the thermodynamic activity of residual oxygen and sulphur. The presence of some residual magnesium and RE dissolved in the liquid of a melt dedicated to SGI and CGI appears however essential for achieving the desired graphite shape.
The selection and sorting of the most critical results among the multitude of available experimental work is proving to be problematic in this field. It is quite possible that the multiplicity of the terms used to describe the graphite shapes found in a given sample [DIN80], as well as the use of flowery terminology to describe unusual graphite shapes, may explain this difficulty.
9
The graphite shape and the matrix constitution depend on both melt composition and cooling rate.
While the control of the matrix structure is mastered in practice, the shape of graphite is highly sensitive to small changes in either melt preparation or cooling rate. Actually, the changes brought about by these factors are closely inter-related, see Fig. I-6. After standard preparation, a cast iron melt yields flake graphite, while a full or partial spheroidising treatment after desulphurisation is used to get spheroidal or compacted graphite, respectively. It should be noted that:
- Obtaining a fully graphitic SGI upon casting relies on appropriate inoculation of the melt for avoiding the formation of metastable eutectic. This is most often not necessary for LGI and CGI because, for the same cooling rate conditions, their faster growth kinetics ensures solidification above the metastable temperature with a lower count of nuclei.
- Many elements may lead to graphite “degeneracy” - i.e. the development of unwanted graphite forms – when present in the melt at a level above a critical limit, which may be so low that these so-called poisoning elements can often be classified as trace elements.
In a casting with various section thicknesses, the graphite shape depends on the local cooling rate.
The following changes can be noticed as the cooling rate increases:
- Lamellar graphite to undercooled graphite.
- Compacted graphite with low nodularity to nearly or fully spheroidal graphite.
- Irregular spheroidal graphite to well-rounded one.
This is further detailed on the next page where distinction has been made of graphite shapes due to primary and eutectic precipitation.
Figure I-6. The interplay between chemical and cooling rate routes.
To explore the formation of the microstructure of silicon cast irons during solidification and solid- state transformations, this monograph contains the following chapters: phase diagram information as a necessary tool (II), thermal analysis for introducing solidification (III), principles of two-phase eutectic growth as applied to cast irons (IV), nucleation and inoculation (V), graphite morphology (VI) and effect of impurities on it (VII), eutectoid transformation (VIII) and finally microstructure modelling (IX).
200 µm 200 µm
+ Mg + impurities
Coolingrate
Lamellar graphite Compacted graphite Mesh graphite
Undercooled graphite Spheroidal graphite Spiky graphite
10 Primary versus eutectic graphite shapes
It will be seen later that understanding – or at least describing – precipitation of graphite needs differentiating free growth from the liquid (primary precipitation), Fig. I-7a, and two-phase eutectic growth, Fig. I-7b. In these graphs, the horizontal axis represents the change of growth conditions, represented by the undercooling T or cooling rate. Note that: 1) the cooling rate is the one imposed under constrained growth (directional solidification and cooling) or the one measured before solidification starts for thermal analysis and casting. 2) T is associated to graphite liquidus for primary graphite and related to the stable eutectic for eutectic graphite. The double vertical axis shows upwards the effect of spheroidisers and downwards that of oxygen and sulphur, while "pure"
alloys are located on the horizontal axis.
Figure I-7. Various forms of primary (a) and eutectic (b) graphite
Spheroidal Plate-like
Flake Exploded
Oxygen,sulphurMagnesium,cerium
T Cooling
rate
a
Spheroidal
20 µm
1 µm
Spheroidal
Kish
200 µm 200 µm
Chunky and other degenerate spheroiodal graphite
100 µm
100 µm Spheroidal
Compacted
Coral Undercooled
Flake Plate-like
Oxygen,sulphurMagnesium,cerium
T Cooling
rate
b
11
Chapter II – The Fe-C-Si phase diagram and the carbon equivalent
THE EUTECTIC VALLEY IN THE STABLE AND METASTABLE SYSTEMS
In most textbooks, silicon cast irons are differentiated from carbon steels as being Fe-C based alloys with a carbon content higher than 2.0 wt.%. This value refers to the maximum solubility of carbon in austenite in the binary Fe-C system and relates to the stable eutectic, i.e. to the reaction liquid (L)austenite ()+graphite at 1154°C, see Fig. II-1a.
It is also seen in Fig. II-1a that the metastable eutectic liquid (L)austenite ()+cementite (Fe3C) lies only a few degrees below the stable one in the binary system, at 1148°C. Fortunately, adding a few percent of silicon to the melt increases significantly the temperature difference between the two systems as illustrated with the section of the Fe-C-Si phase diagram at 2.5 wt.% Si in Fig. II-1b. Such a section is called a Fe-C isopleth section of the phase diagram. The two graphs in Fig. II-1 were calculated using the TCFe8 database and all calculations performed similarly will be referenced [TCFE8] from now on.
Figure II-1. Binary Fe-C phase diagram (a) and Fe-C isopleth section of the Fe-C-Si phase diagram at 2.5 wt.% Si (b). Bold lines are for the stable system, thin lines for the metastable one [TCFE8].
The increase of the temperature difference between the stable and metastable eutectics with added silicon is shown in Fig. II-2 in the (T,wSi) plane. It is seen to be due to both an increase of the stable eutectic temperature and a decrease of the metastable one. This evolution calls for two remarks:
1- The stable eutectic presents a maximum at 5.5 wt.% silicon, which is outside the range of usual silicon cast irons.
2- The metastable eutectic goes to a minimum at about 1100°C for 3 wt.% Si where a third solid phase appears which is a silico-carbide.
Figure II-2. Change in temperature of the stable and metastable eutectics as function of Si
content (adapted from [LAC91]).
Fe3C
L L+graphite
L+
+graphite
a
Fe3C
L L+graphite
L+
b
1100 1110 1120 1130 1140 1150 1160 1170 1180
0 2 4 6 8 10
Temperature (°C)
Silicon content (wt.%)
stable eutectic
metastable eutectic
12 Polynomial expressions for describing the phase diagram for cast irons with silicon in the range 0 to 3 wt.%.
In the composition range of usual silicon cast irons, the austenite liquidus,TL, and graphite liquidus,
g
TL, can be represented to a good approximation by linear relations of alloy composition:
i i i
C C 0
L T m w m w
T and
i i
g C i
g C g 0 g
L T m w m w
T II-1
in which T0 and T0g are constants, mi and mig are the liquidus slopes relative to element i for austenite and graphite, respectively, and wi is the content in element i of the alloy (wt.%).
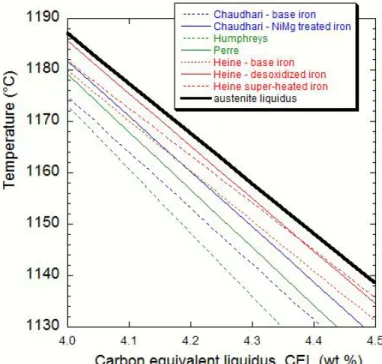
Using the assessment of the Fe-C system [GUS85], the stable eutectic is given by the invariant point (4.34 wt.% C; 1154°C). Combining this data with the slope of the austenite and graphite liquidus assessed by Heine [HEI95] leads to the following expressions where the temperature is given in Celsius:
i i i
C
L 1576.3 97.3 w m w
T and
i i
g C i
g
L 534.7 389.1 w m w
T II-2
To estimate the miand mgi values, points were selected in the assessed Fe-C-i phase diagrams except for the Fe-C-Si system for which the point was taken from a previous assessment of this system [LAC91], see Fig. II-2. In Table II-1 are indicated the selected points and the calculated values of the austenite and graphite liquidus slopes. The expressions thus derived are expected to be valid for silicon contents up to 3 wt.% and for any other alloying element up to 1 wt.%.
The intersection of the two hyper-plans describing the austenite and graphite liquidus corresponds to the eutectic trough. By equating the two equations II-2, one thus gets the carbon content along the stable eutectic trough,weutC :
C g C
i i i
g eut i
C m m
w ) m m ( 34 . 4
w II-3
The corresponding eutectic temperature, TEUT, is obtained by inserting weutC in the TLexpression:
i i
C g C
i g i
EUT i w
m m
m 3 m
. 97 m 02
. 1154
T II-4
Table II.1 - Data used to characterize the effect of third elements on the binary Fe-C stable system i species solid phases in equilibrium with liquid wC wi T (°C) mi mgi Cr austenite, graphite and cementite 4.2 4.30 1156 -2.71 13.14
Cu austenite and graphite 4.0 3.7 1172 -4.08 40.62
Mn austenite, graphite and cementite 4.32 3.0 1139 -5.66 -2.40
Mo austenite and graphite 5.0 12.6 1350 -10.3 -4.84
Ni austenite and graphite 3.8 10.0 1128 -7.86 18.41
P austenite, cementite and Fe3P 2.2 7.1 954 -57.8 89.6
Si austenite and graphite 3.78 2.0 1162.5 -23.0 113.2
13
For alloys with less than 3 wt.% Si, Fig. II-2 shows that the evolution of the stable eutectic temperature may well be represented as a linear function of silicon content. Extending this to other alloying elements at less than 1 wt.%, the stable eutectic temperature, TEUT, may be expressed by means of a linear relation of composition (see opposite page):
Si P
Ni Mo
Mn
Cu Cr
EUT
w 246 . 4 w 31 . 28 w 60 . 2 w 21 . 9 w 00 . 5
w 86 . 4 w 46 . 0 02 . 1154 ) C ( T
II-5
where wi is the content in element I of the alloy (wt.%).
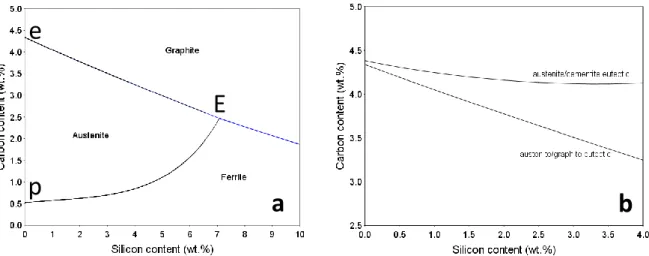
In fact, the stable eutectic (invariant) point in the Fe-C phase diagram gives rise to a eutectic (mono- variant) line in the Fe-C-Si ternary system. Fig. II-3a shows the projection on the (wC, wSi) plane of the stable liquidus in the Fe corner, with this eutectic line starting at the binary point e and the peritectic line (liquid+ferrite-austenite-) at the binary point p. These two (mono-variant) lines intersect at the invariant ternary point E at about 7 wt.% Si (liquid++graphite). Note that Fe-C-Si eutectic alloys with a Si content higher than this value would solidify with ferrite as Fe-rich phase instead of austenite.
In Fig. II-3b both the stable and metastable eutectic lines are plotted in the (wC, wSi) plane with a reduced Si scale compared to Fig. II-3a. It is thus seen that the carbon content of the eutectic decreases significantly with added silicon in the stable system, but much less in the metastable system. Hence, the distance between the two eutectic lines in terms of carbon content increases with the silicon content. This relates to the increase in the temperature difference between the two eutectics that is illustrated in Fig. II-2. The maximum of the stable eutectic of 1172°C at about 5.5 wt.% Si is due to a slight curving of the austenite and graphite liquidus surfaces.
Figure II-3. a: projection of the stable liquidus of the Fe-C-Si system.
b: projection of the stable and metastable eutectic lines on the (wC, wSi) plane in the Fe corner [TCFE8].
e
p
E
a b
14 Thermodynamics of the Fe-C system
The assessment of the Fe-C phase diagram selected for the TCFE thermodynamic databases developed by Thermocalc AB for steels is due to Gustafsson [GUS85]. It may be used to write the useful thermodynamic expressions for austenite () and liquid (l) as function of the temperature TK in Kelvin [HIL98]. Austenite is described with two sub-lattices, one for substitutional elements and the other one for interstitial elements. The activity of carbon in austenite aCis thus:
C
K C
C K
C 1 2 y
T 314 . 8
34671 y
1 / y T ln
314 . 8
T 877 . 15 77207 a
ln II-7
where yC xC /(1xC) is the so-called site fraction of carbon in the interstitial sub-lattice and xC is the molar fraction of carbon in austenite. The liquid is described with one single sub-lattice. With
l
xCthe molar fraction of carbon in the liquid, the carbon activity alCis given as:
lC
l C K
l C K
l 2 C l 0 C , l C
l C
x 6 1 x 2 1 T 19 49260 x
4 1 19300 T
5 . 28 124320 T
314 . 8
x 1
x ln a ln a
II-8
with 8.314TKlnalC,0 117369 24.63TK
Fig. II-4 shows the change with carbon content of the carbon activity in the Fe-C liquid for three temperatures, with 1427 K (1154°C) being the eutectic temperature. Though this is not the way the THERMOCALC software calculates phase boundaries, the graphite liquidus is simply given by alC 1 (see the dashed horizontal line). Similarly, the austenite solidus and liquidus could be obtained by solving simultaneously the equations alC aCandalFe aFe.
Figure II-4. Change of carbon activity in the Fe-C liquid vs carbon content
for three temperatures given in Kelvin. The marked change in the carbon content at aC=1 illustrates the strong slope of the graphite liquidus.
The above equations are rather close to the expressions evaluated much earlier by Hillert [HIL64].
The enthalpy of dissolution of carbon in the Fe-C melt equals its enthalpy of melting (as being a pure phase) and is given as 117369/8.314=14117 J·mol-1 which compares reasonably well with the value of 19396 J·mol-1 previously estimated by Hillert [HIL64].
15
THE CARBON EQUIVALENT
On the opposite page is described part of the data relevant for the Fe-C system which is implemented in the TCFe8 database. As an application example, a simple calculation of the graphite liquidus is described.
Locating an alloy onto the Fe-C-Si projection of Fig. II-3a indicates if it is hypo- or hyper-eutectic in the stable system, i.e. if its carbon content is "lower" or "higher", respectively, than the corresponding value along the stable eutectic line eE. Further, the isopleth Fe-C sections along eE are all similarly shaped with only a shift of the stable eutectic point to lower carbon content as silicon is increased, see Fig. II-1b. This led defining the carbon equivalent CE of a cast iron that indicates if an alloy is to the right or to the left of the stable eutectic point in the isopleth section. From the expression ofweutC (eq. II-3), one can express the carbon equivalent, CE, of an alloy as:
C g C
i i i
g i
C m m
w ) m m ( w
CE II-9
With the data in eq. II-2 and Table II-1, this writes:
Si P
Ni Mo
Mn
Cu Cr
C 99
w 280 . 0 w 303 . 0 w 054 . 0 w 011 . 0 w 007 . 0
w 092 . 0 w 033 . 0 w .%) wt ( CE
II-10
Neumann [NEU68] made a review of the experimental information to evaluate the change in solubility of carbon in Fe-C-i melt due to alloying with i. The author also provided thermodynamic evaluation for the whole periodic table that compared well with reported experimental values, though calculations were done at the very high temperature of 1550°C. Limited to the same elements as above, the following experimental carbon equivalent expression, CEexp, was obtained:
Si P
Ni Mo
Mn
Cu Cr
C exp
w 310 . 0 w 3331 . 0 w 051 . 0 w 014 . 0 w 028 . 0
w 076 . 0 w 064 . 0 w .%) wt ( CE
II-11
It is quite noticeable that the sign and values of the coefficients in CE99 and CEexp agree for graphitising elements (Cu, Ni, P and Si) but not for carbide former elements (Cr, Mn and Mo). The reason is certainly to be found in the fact that the eutectic in the Fe-C system was set at 4.26 wt.% by Neumann when it is now assessed at 4.34 wt.% (see Fig. 2b in the paper by Neumann). Note that the carbon equivalent corresponding to the eutectic point should thus be set to 4.34 wt.%.
One may wonder why the CEexp is still very much in use when the coefficient for silicon is higher than it should be. For any cast iron composition in the Fe-C-Si system, (wC, wSi), the value of CEexp will be higher than that of CE99 by CEexp-CE99=0.03·wSi. Considering that the CE99 value is the right one, the difference means that an alloy should be slightly hypereutectic to experimentally appear as eutectic.
This is exactly what is known from thermal analysis, see chapters III and IX.
16 Metastable eutectic temperature
There are not so many data available in the literature on the metastable eutectic in the Fe-C-Si system. Oldfield [OLD62] studied it at varying cooling rates, up to 480°C/min, and extrapolated the values at zero cooling rate to get the ”equilibrium” value. Oldfield investigated alloys with 0 or 0.5 wt.% Mn, 0 to 0.1 wt.% Cr, and Si content up to 2 wt.%. The values reported versus the silicon content in Fig. II-5 show a fair linear relationship with silicon content. There is another Oldfield’s point at more than 2 wt.% Si that was obtained by remelting and is unexpectedly at significantly lower temperature.
Other results are from Heine [HEI86, HEI95] and were obtained with Te-bearing cups. Some of this data were from melts containing 0.46-0.81 wt.% Mn and are represented with solid symbols while open symbols are for melt with no or little (0.2 wt.%) Mn. There is no clear effect of Mn that is seen to change the temperature in both directions (positive and negative). It is noted that all values from Heine are below those of Oldfield by about 10°C, which may be due to thermal, or growth undercooling whose effect was evidenced and accounted for by Oldfield [OLD62].
For describing the effect of Si on the metastable eutectic in the Fe-C-Si system, the solid line in Fig. II- 5 was drawn based on Oldfield’s results, but starting from the binary Fe-C metastable eutectic at 1148°C. This line writes: TEW=1148-12.5·wSi. The parallel dashed line indicates a possible upper limit of the metastable eutectic when the binary temperature is set at 1150°C as sometimes found. This gives TEW=1150-12.5·wSi. Finally, the dot-dashed line shows TEW from the ASM handbook:
TEW=1148-15.0·wSi+3.0·wMn-2.3·wCu-37·wP, here plotted with wMn, wCu and wP set to zero.
Figure II-5. Effect of the alloy’s silicon content on the temperature of the metastable eutectic, TEW.
1100 1110 1120 1130 1140 1150
0.0 0.50 1.0 1.5 2.0 2.5 3.0
Heine, 1995 Heine, 1986 Heine, 1986 - high Mn Oldfield, 1962
Temperature (°C)
Silicon content (wt.%)
17
MISCELLANEOUS
With the current development of high-silicon cast irons, there is a need for extending the description of the phase diagram done in this chapter. The main change to be carried out is to replace the linear terms describing the effect of silicon by second order polynomials for accounting of the curving of the liquidus surfaces in the Fe-C-Si system.
Emphasis has been put in this chapter on the co-existence of the stable and metastable systems because of the risk of changing from stable to metastable solidification. In most cases, the resulting mottled structure, i.e. a mixture of microstructures of the two eutectics as the one illustrated in Fig.
II-6, is unwanted. However, this transition is used in the manufacturing of centrifugally cast iron pipes as a mottled microstructure eases the extraction of the tubes from the die because the white eutectic shrinks significantly upon solidification while the stable eutectic does not. The pipes are later shortly heat-treated in the austenite field – typically at 950°C - for full graphitisation.
Figure II-6. SGI with a mottled structure.
In this chapter, only the upper temperature range of the diagrams has been presented as this is what is needed for dealing with solidification. The low temperature range corresponding to the stable and metastable eutectoid transformations will be presented in Chapter VIII.
18
19
Chapter III – Thermal analysis
In many respects, phase transformations in cast irons can be described by considering that they are pseudo-binary Fe-C alloys. This means in practice that qualitative and quantitative features may be obtained from information given by the appropriate Fe-C isopleth section such as the one in Fig. III- 1a for a silicon content of 2.5 wt.%. This view is adopted in this monograph, though the necessity of accounting for alloying elements in a more precise way will be mentioned here and there when appropriate. Moreover, this chapter is dedicated to solidification while solid-state transformation is dealt with in Chapter VIII.
EQUILIBRIUM SOLIDIFICATION
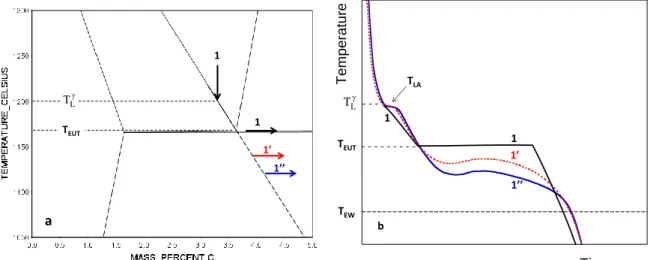
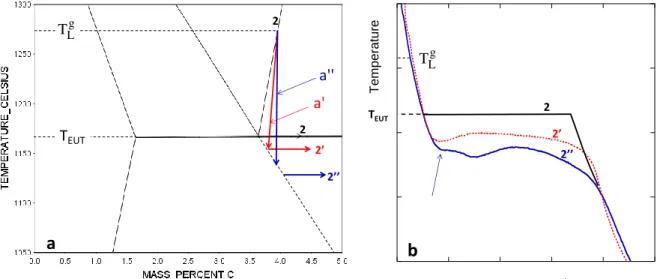
Equilibrium solidification occurs if there is no delay in nucleation and growth of the solid phases to precipitate, and further enough time given to these phases to be chemically homogeneous at any time during solidification. An hypo-eutectic (1) and an hyper-eutectic (2) alloy with both a liquidus temperature at 1200°C are located in Fig. III-1a. Upon cooling from a temperature at which the material is liquid, the equilibrium solidification path of these alloys consists of:
- Primary precipitation of austenite (alloy 1) or graphite (alloy 2), starting at the liquidus temperature and continuing along the corresponding liquidus line as the temperature decreases. At any temperature, the fraction of primary phase is given by the lever rule.
- Eutectic transformation of the remaining liquid (liquidaustenite+graphite) when the eutectic temperature, TEUT, is reached. Note that the invariant eutectic of the binary Fe-C system is now changed to a monovariant one because of Si addition so that there is a very narrow eutectic temperature interval. In practice one defines the eutectic temperature TEUT
as the upper value of this interval.
Fig. III-1b shows the change in enthalpy of the two materials during equilibrium solidification.
Primary precipitation leads to significant latent heat release for alloy 1 while the amount of primary graphite is too small for alloy 2 to lead to any thermal effect. The abrupt change at nearly constant temperature represents the latent heat of the eutectic transformation, HEut. Note that the total solidification enthalpy change is nevertheless quite similar for both alloys.
Figure III-1: (a) Fe-C isopleth section of the stable phase diagram at 2.5 wt.% Si with indicated an hypo-eutectic (1) and an hyper-eutectic (2) alloy, both alloys having a liquidus of 1200°C [TCFE8].
(b) Evolution with temperature of the enthalpy HW (J·g-1) of these alloys for equilibrium solidification [TCFE8].
Liquidus
1 2
TEUT
a
Liquidus
1 2
TEUT
b
HEut
20 Thermal gradients in a TA cup
A few works have been devoted to the so-called Fourier thermal analysis of solidification of castings which applies to simple cylindrical geometry [FRA97, DIO04]. This analysis allows accounting for radial thermal gradient and may be supported by experimental records of the temperature at two locations, typically at the centre and near-surface of the casting. Examples of such records are reproduced in Fig. III-2a which shows that the temperature difference may be between 10°C and 20°C for cylinders cast in sand mould and solidifying within 200-300 seconds as TA cups do.
Dioszegi and Svensson [DIO05] carried out a numerical analysis of the solidification of cylinders 5 cm in diameter solidifying in 600-700 seconds. Their calculations show a temperature difference of 7°C between the surface and the centre of the cylinder all along the eutectic solidification.
Figure III-2. Comparison of cooling curves recorded in the centre of a small LGI sand casting and closer to the surface. a: 40 mm in diameter cylinder with thermocouples located at the centre and
at 12 mm from the centre [FRA97] b: small-sized cylinder cast in sand with one thermocouple at the centre (TC) and the other at mid-radius (TL) (adapted from [DIO04]).
The horizontal dashed line in Fig. III-2b shows the austenite liquidus calculated at 1188.9°C with the data in Table II-1 for the composition indicated by the authors (3.45 C, 2.02 Si, 0.68 Mn, 0.114 Cr, 0.259 Cu, wt.%; CE99=4.05 wt.%). The difference in the shape of the two arrests associated to primary austenite, at the centre TC and at mid-radius TL, is striking. The solidification front certainly decreases the temperature gradient in the liquid, leading eventually to this plateau of the austenite liquidus arrest recorded at the centre of the casting. The time interval t which is indicated in Fig. III- 2b will be called time shift later in this chapter. In the work by Dioszegi and Svensson, the arrest sometimes presents a very small recalescence. In contrast Fras et al. showed cooling curves with a simple slope change at the austenite arrest which they could reproduce using a dendrite growth model, see Chapter IX. A micro-macro modelling approach taking into account the nucleation and growth of eutectic entities while solving the heat transfer equation was carried out by Su et al.
[SU85] who however did not describe the differences between the skin and the centre of the part.
a
Temperature(°C)
21
SMALL CASTING SOLIDIFICATION AND THERMAL ANALYSIS
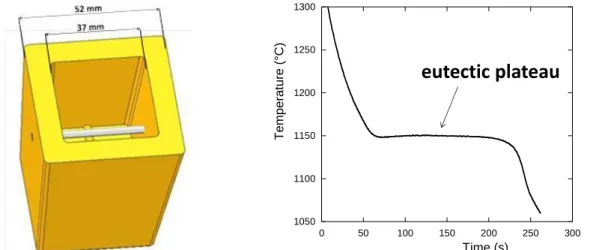
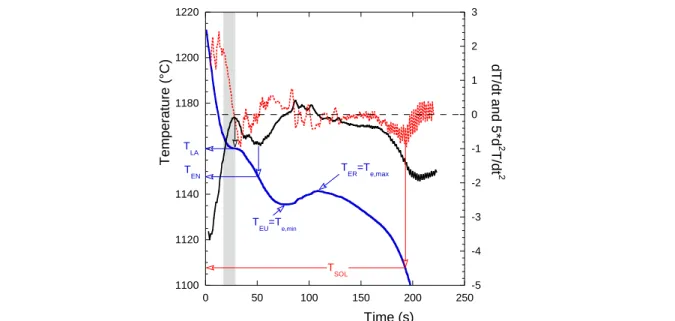
Solidification never takes place at equilibrium because both nucleation and growth of solid phases require undercooling, i.e. a driving force. Recording the cooling curves as function of time, denoted T(t) in the following, is the most usual way to investigating alloy solidification. In aluminium and cast iron industries, this has led to the development of thermal analysis (TA) for melt control. The method is based on pouring and solidifying a sample small enough to solidify in a couple of minutes but large enough to be representative of casting solidification. Thermal cups as the one shown in Fig.
III-3a have dimensions of the order of a few centimetres.
When analysing the thermal records, it is implicitly considered that the temperature of the metal in the cup is homogeneous at any time during cooling and solidification. Based on a comparison with steels [LEK11], Stefanescu [STE20] states this may not be the case, meaning that some temperature differences must develop in the cup during cooling, see the opposite page.
Figure III-3: (a) schematic of a cup for thermal analysis with the thermocouple in the centre.
(b) typical TA cooling curve T(t) showing a single thermal arrest, the eutectic plateau.
The TA record in Fig. III-3b shows one single thermal arrest which is typically associated to eutectic solidification without primary deposition. Because such a eutectic structure develops in cast irons by nucleation and growth of independent solid entities, the thermal record gives a perfect idea of the solidification process at the centre of the cup. In other words, the thermal gradient in the cup may only marginally affect such a record. On the contrary, a solidification front moving from the surface to the centre of the cup will slow down the cooling at the centre of the cup and will thus affect the thermal effects taking place close to the thermocouple junction. It will be seen later that this is essential in understanding more complex T(t) records. Note that in the present chapter, no distinction is made according to the kind of cast iron, LGI, CGI or SGI, because "reading" of the TA records does not depend on it.
1050 1100 1150 1200 1250 1300
0 50 100 150 200 250 300
Temperature (°C)
Time (s)
eutectic plateau
22
Heat balance and solidification of a representative volume
Keeping in mind the limits discussed in the preceding pages, cooling and solidification of small castings such as TA cups could be described quite satisfactorily considering the thermal gradients are small enough and thus assuming their temperature is homogeneous at any time. Hence, the following heat-balance applies:
dt H dV dt
C dT V q A
S
p
III-1
where q is the density of the heat flux exchanged by the metal with the mould (q<0 for usual casting conditions), V and A are the volume of the casting and its outer surface, respectively, V/A being the thermal modulus, and Cp are the density and the heat capacity (per unit mass) of the metal, respectively, T is the sample temperature, H is the latent heat of melting per unit volume (>0), VS is the solidified volume and t is time. Assuming a fully eutectic structure consisting of NV eutectic spherical cells having the same radius R at time t, the change in the solidified volume writes dVS/dt=NV·R2·dR/dt. It will be further assumed that the growth of individual eutectic entities may be written dR/dt=EUT·(TEUT)n, where
TEUT=TEUT-T is the eutectic undercooling and n is 1 or 2. During the eutectic plateau, the temperature is nearly constant leaving:
EUTn
EUT 2
V R T
N H q
A or
n / 1
EUT 2 V
EUT H N R
q
T A
III-2
Hence, increasing heat extraction rate does increase eutectic undercooling while increasing the number of eutectic entities by inoculation does decrease it. These opposite actions are represented in the plot of Nv versus TEUT in Fig. III-4.
Figure III-4. Relation between number of eutectic entities, NV, and undercooling of the eutectic plateau, TEUT, depending on heat extraction (red cuves) and inoculation (blue lines).
Inverse calculation of solidification kinetics has been carried out for one thermocouple [FRE75a, EKP81, BAR97] and two thermocouples [FRA97, BAR97, DIO04, DIO05]
configurations. As an example, Dioszegi and Svensson [DIO05] considered a eutectic LGI and calculated the cooling curves assuming various growth laws for the eutectic cells. They then carried out the inverse calculation and noticed that the growth law was better retrieved when the two thermocouples for inverse calculation are sufficiently close to each other.
Lekakh and Richards [LEK11] provided a similar analysis in the case of steel.
|q1|
|q2|>|q1| Increased heat
extraction rate Increased inoculation NV
TEUT