HAL Id: cirad-00845844
http://hal.cirad.fr/cirad-00845844
Submitted on 18 Jul 2013
HAL is a multi-disciplinary open access
archive for the deposit and dissemination of
sci-entific research documents, whether they are
pub-lished or not. The documents may come from
teaching and research institutions in France or
abroad, or from public or private research centers.
L’archive ouverte pluridisciplinaire HAL, est
destinée au dépôt et à la diffusion de documents
scientifiques de niveau recherche, publiés ou non,
émanant des établissements d’enseignement et de
recherche français ou étrangers, des laboratoires
publics ou privés.
Structure of the specific combining ability between two
species of Eucalyptus. I. RAPD data
C. P. Baril, D. Verhaegen, Ph. Vigneron, J. M. Bouvet, A. Kremer
To cite this version:
C. P. Baril, D. Verhaegen, Ph. Vigneron, J. M. Bouvet, A. Kremer. Structure of the specific combining
ability between two species of Eucalyptus. I. RAPD data. TAG Theoretical and Applied Genetics,
Springer Verlag, 1997, 94, pp.796-803. �cirad-00845844�
Communicated by P. M. A. Tigerstedt
C. P. Baril ( )1 · D. Verhaegen · Ph. Vigneron · J. M. Bouvet Centre de coope´ration internationale en recherche agronomique pour le de´veloppement, CIRAD-Foreˆt, BP 5035,
F-34032 Montpellier Cedex 1, France A. Kremer
Institut national de recherche agronomique, INRA, BP 45, Pierroton, F-33610 Cestas, France
Present address:
1 Groupe d’e´tude et de controˆle des varie´te´s et des semences, GEVES, La Minie`re F-78285 Guyancourt Cedex, France
C. P. Baril · D. Verhaegen · Ph. Vigneron
J. M. Bouvet · A. Kremer
Structure of the specific combining ability between two species of
Eucalyptus.
I. RAPD data
Received: 3 November 1996 / Accepted: 8 November 1996
Abstract
Within the context of the reciprocal recurrent
selection scheme developed in 1989 by CIRAD-Foreˆt
on Eucalyptus, RAPD essays were performed to assess
the genetic diversity in the two species E. urophylla and
E. grandis. The molecular markers were split into two
parts: the specific markers (present with different
fre-quencies in the two species) and the common markers
(present with similar frequencies in the two species).
The study analyses the structure of genetic diversity
within and between the two species of Eucalyptus.
Dif-ferent genetic distances are worked out for use in
pre-diction equations of the individual tree trunk volume of
hybrids at 38 months. Each distance is expressed as the
sum of the general genetic distance and the specific
genetic distance. The general genetic distance based on
the double presence plus the double absence of bands
seems to be an interesting co-variate to use in a factor
regression model. Through this model the distance
calculated between species explains the general
com-bining ability (GCA) and the specific comcom-bining ability
(SCA) of the phenotypic character with a global
coeffic-ient of determination of 81.6%.
Key words
RAPD · Genetic distances · Heterosis
breeding · Prediction · Eucalyptus · Interaction
Introduction
Eucalyptus
which originated in Australia, is a highly
polymorphic genus (around 600 species) belonging to
the family Myrtaceae which is primarily grown for
firewood and wood pulp (mainly for paper). It was
introduced in the Congo during the fifties and today
represents the second major resource of this country.
The fortuitous observation of a natural hybrid between
two species from the sub-genus Symphomyrtus, namely
Eucalyptus urophylla
and E. grandis, revealing an
im-portant heterosis, led breeders to use a reciprocal
recur-rent selection scheme (Vigneron 1991). This strategy is
especially adapted to interspecific crosses (Gallais 1990)
between two highly divergent and complementary
populations that have evolved in different
environ-ments, with no genetic exchanges between them. E.
urophylla, for which 85 samples were collected, is
adapted to local conditions and is high-yielding, while
E. grandis, for which 25 samples were collected, is less
well adapted but has high growth potential.
Since the selection process in tree improvement is
very time consuming, any means of predicting tree
performance has to be considered with interest. The
information required for the effective breeding of
hy-brids felled at 7 years, can be obtained after 2 or 3 years
(Bouvet and Vigneron 1995), but one question remains:
which crosses have to be made among all the possible
ones? The aim of this paper is to answer this question
using genetic distances obtained through the use of
RAPDs.
Materials and methods
In 1990, 13 maternal trees of E. urophylla were crossed with 13 paternal trees of E. grandis in a factorial mating design (Bouvet and Vigneron 1995). While the maternal trees came from two highly differentiated provenances in the island of Flores, namely Monte Lewotobi and Monte Egon, all the pollen came from trees uniformly
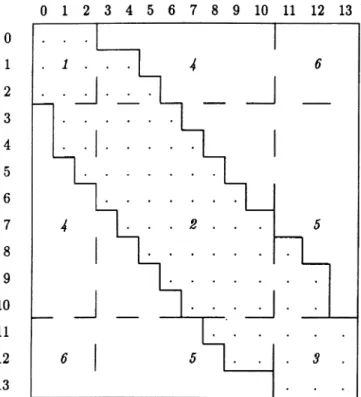
Table 1Breakdown table of the number of markers presenting specific combinations of band frequencies in the two Eucalyptus populations (E. urophylla in rows and E. grandis in columns). Italic numbers symbolize the six different groups of markers
distributed over the northern part of the natural area near Atherton, Queensland, Australia. Unfortunately, technical problems in con-trolled pollination prevented the mating design from being complete and balanced, with only 87 families among the 169 possible ones (i.e. a ratio equal to 51%). Moreover, the number of replicates varied from one to four according to the cross. These constraints led to a reduced factorial design involving nine E. urophylla and nine E. grandisin which 49 families were present among the 81 possible ones (i.e. a ratio equal to 60%) with three or four replications per family. In this reduced design, each female and male parent is represented by at least three or four families, respectively. In each experimental unit (square plot of 4]4"16 trees), height and circumference at 1.3 m were measured at 38 months. In the Congo, this corresponds to the half-rotation age in commercial plantations. Volume was calculated by considering the tree trunk as a cone. All of the following analyses were performed using the means of the three or four family replications.
RAPD assays
The details of total genomic DNA isolation from dry leaves and DNA amplification is presented in Verhaegen et al. (1995). Oligo-nucleotide primers (10-mers) were used as single primers for the amplification of RAPD sequences according to Williams et al. (1990). The occurrences of a specific band of amplified DNA is scored as 1 and absence as 0, leading to the characterization of each individual by a binary variable. Pairwise comparisons of individuals were employed to calculate two similarity coefficients: Jaccard’s coefficient (Jaccard 1908; Jain et al. 1994) and Sokal and Michener’s coefficient (Sokal and Michener 1958), also called a simple matching coefficient (Skroch et al. 1992; Lamboy 1994). From these similarity coefficients, two indexes of dissimilarity between individuals A and B were calculated:
D2"1!Sim1,
where Sim1"Nab/Na#Nb!Nab, Nab is the number of fragments shared by A and B (double presence), while Na and Nb are the number of fragments present in individual A and in individual B, respectively.
D2"1!Sim2,
where Sim2"NAB/N, NAB is the number of fragments present and absent for individuals A and B (double presence plus double ab-sence), and N is the total number of fragments.
Note that N]D2 is the euclidian distance between two indi-viduals.
Let d2 (i, i@) be the Euclidian distance between individuals i and i@, let j"1, . . . , N. Then:
d2 (i, i@)"+
j (xij!xi{j)2,
where xij"0 if the band corresponding to the j5) marker is absent and xij"1 if the band is present. Consequently xij!xi{j"0 either if xij"xi{j"0 (double absence) or if xij"xi{j"1 (double pres-ence). Hence d2(i, i@) is the number of non-coincidences in the two individuals of 0 or 1.
From the sample of 26 parents (13 E. urophylla and 13 E. grandis), 415 reliable RAPD bands were obtained using 15 primers.
Structure of the genetic diversity
Firstly, factorial analysis of distance tables seems to be a good tool for visualizing the structure of the genetic diversity. Secondly, in each population each random amplified product can present a num-ber of bands varying from zero (if no individual exhibits the
frag-ment) to 13 (if all the individuals show the fragfrag-ment). A two-way table is constructed with 14]14 cells corresponding to the coincid-ence of a specific frequency of bands in the female population with a specific frequency of bands in the male population. The contin-gency table shows the number of variables concerned with each combination of band frequencies. An exact Fisher test allows one to discriminate markers shared with equal frequency by the two species (dotted area in Table 1) from those showing significant frequency differences between the two species. The contingency table was further subdivided into nine zones corresponding to different values of the exact Fisher test (dashed lines in Table 1). These zones correspond to the combination of three areas in each population, namely the bands whose frequency does not differ significantly from zero [zone (1) if the two species show this type of frequency], the bands whose frequency does not significantly differ from one [zone (3) if the two species show this type of frequency], and the bands with intermediate frequencies [zone (2) if the two species show this type of frequency]. Reciprocal areas have been merged in order to create six different zones (given in italic letters).
Prediction of specific crossing values
The two genetic distances D1 and D2 have been calculated between and within species using all the RAPD variables, and also using separately either the common variables or the specific variables. Eighteen different distances [six classes of variables](two intras-pecific distances#one intersintras-pecific distance)] have been defined and calculated on the 9]9 contingency table corresponding to the reduced design. Each distance table has been adjusted to the additive model (1) and the estimates of the additive parameters have been retained as co-variates to be introduced in a factor regression model 797
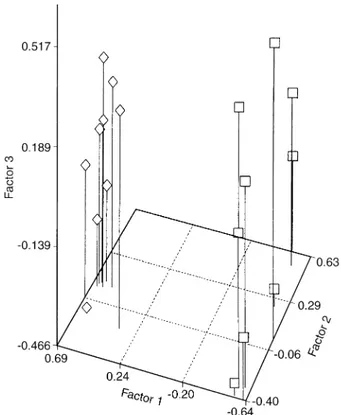
Fig. 1Plot of the three first factors of FADT computed from D2. Species: K E. urophylla,e E. grandis
in order to explain GCA (general combining ability) and SCA (specific combining ability). The additive model with two factors applied to distance variables is:
Xij"k#½i#Zj#Rij (1) where Xij is the genetic distance between individual i and individual j, k is the general mean distance, ½i is the mean distance of individual i minus the general mean, Zj is the mean distance of individual jminus the general mean and Rij is the residual term.
A large positive or negative ½i indicates that the individual possesses many bands that occur at low or high frequencies, respec-tively, in the other individuals. If individuals i and j possesses the same bands with low frequencies their Rij will be highly negative, whereas if two individuals possess different bands with low frequen-cies their Rij will be highly positive. This partition has earlier been proposed on Rogers’ distance with RFLP data by Melchinger et al. (1990 a, b). These general genetic distances can be defined between and within species. In the case of distance tables within species, the null diagonal has been removed before adjustment to the additive model. In this model the interaction term is merged into the residual term. The estimates of additive parameters ½i and Zj are then used as co-variates in the factor regression model (Denis 1988; Baril 1992) applied to the phenotypic variable:
¼
ij"k#c· ½i#a@i#d · Zj#b@j#o· ½i · Zj #
lj · ½i#ji · Zj#eij (2) where ¼ij is the individual tree trunk volume at 38 months of the family descending from the cross between mother i and father j, k is the general mean, ai"c · ½i#a@i is the GCA of mother i, bj"d · Zj#b@j is the GCA of father j, and o · ½i · Zj#lj· ½i#ji · Zj is that part of the SCA explained by the model.
Unlike co-variance analysis in which the co-variates depend on the two factors, factor regression allows the partitioning of SCA into functions of only one factor, each multiplied by a regression coeffic-ient depending on the other factor. In order to keep the logical symmetry between the two parents, the co-variates have always been introduced in the model by pairs, i.e. one for E. urophylla and the other for E. grandis. This model provides both an explanation of the additive part of the variability (i.e. GCA) and an explanation of the interactive part (i.e. SCA). Each parental additive contribution to the whole variability is split into two terms. The first represents that part of GCA explained by the regression over the female (or male) co-variate and the second is the rest of GCA (not explained by the general distance). The interaction between the two parents is split into four terms. The first term is the combined regression over the product of the two co-variates (male and female); the two following terms are the remaining regressions over the female co-variate on the one hand and the male co-variate on the other hand. Finally, the rest, eij, is the residual term.The application of models with many parameters when there are numerous missing values in the data set can give fallacious estimates (Denis and Baril 1992). In order to avoid aberrant estimates of phenotypic data, the missing values were estimated by the bi-joint regression model. This model is named by analogy with the joint regression model, well known in studies of genotype]environment interactions (Finlay and Wilkinson 1963), which allows one to re-gress the interaction term on one of the two additive terms (the environment effect). In the bi-joint regression model, the interaction between the two factors, namely father and mother, is split into four parts as in a factor regression model where the co-variates depend-ing on each factor are the estimates of the two additive effects (GCA). The first part of the interaction is the regression on the product of the two GCAs, which corresponds to the model proposed by Tukey (1949).
The bi-joint regression model applied to the phenotypic variable gives:
¼
ij"k#ai#bj#o · aLi · bKj#lj· aLi#ji · bKj#eij (3)
As for the simple joint regression, the data are first adjusted to the additive model in order to estimate the additive parameters (namely, aˆi and bKj), and then adjusted to the complete model using these estimations as co-variates. The bi-joint regression model not only fits the data well (coefficient of determination"90.8%) but also provides estimates which retain part of the interaction. Once the missing values were estimated by this model, the factor regression model has been used on the new completed data set. The estimates of missing data have also been obtained through the additive model, whose results are not presented in this paper, and have given almost similar results in the following analyses. All these analyses were performed using the computer package INTERA (Decoux and Denis 1991), which provides least-squares estimates of parameters. Finally, factorial analyses of the two distance tables D1 and D2 were performed with a Statistical Analysis System (SAS Institute 1988).
Results
Structure of the genetic diversity
Factorial analyses of the two distance tables D1 and
D2 show a clear aggregation of individuals for each
species. The first, second and third principal factors,
based on D1 distance, account for 24.9%, 8.6% and
8.0%, respectively (that is to say a sum equal to 41.5%),
while the three principal factors, based on D2 distance,
account for 33.9%, 8.2% and 7.9%, respectively (that is
to say a sum equal to 50%). The plots of principal
factors worked out from the two genetic distances show
a tendency for the D2 distance (Fig. 1) to provide the
Table 2 Contingency table of the number of markers presenting specific combinations of band frequencies in the two Eucalyptus populations (urophylla in rows and grandis in columns). +
u and
+
g are the sum of RAPD markers with a particular frequency of bands in E. urophylla and E. grandis, respectively
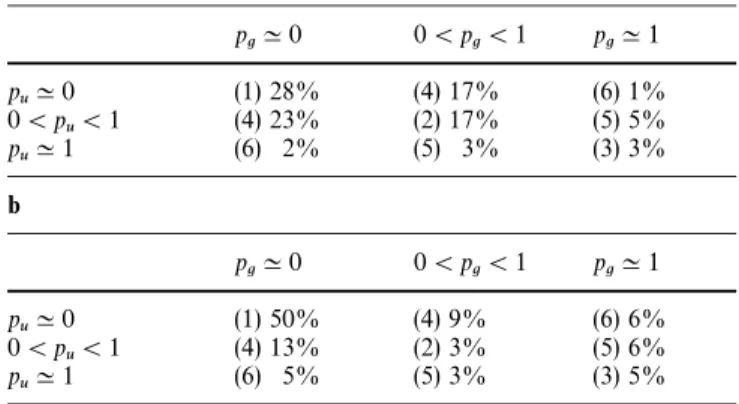
Table 3 Frequency of RAPD variables in the nine areas of the contingency table according to the exact Fisher tests calculated at the P-level "25% (a) and 5% (b). pu (or pg) are the band frequencies among E. urophylla (or among E. grandis)
a pgK0 0(pg(1 pgK1 puK0 (1) 28% (4) 17% (6) 1% 0(pu(1 (4) 23% (2) 17% (5) 5% puK1 (6) 2% (5) 3% (3) 3% b pgK0 0(pg(1 pgK1 puK0 (1) 50% (4) 9% (6) 6% 0(pu(1 (4) 13% (2) 3% (5) 6% puK1 (6) 5% (5) 3% (3) 5%
best differentiation index between the two species of
Eucalyptus. Each cell of the contingency table
present-ed in Table 1 is fillpresent-ed in Table 2 with the number of
bands with a specific combination of frequencies in the
E. urophylla population and the E. grandis population.
The contingency table is split in two parts, one along
the second bisecting line which contains the common
markers (dotted area with 226 RAPD variables, i.e.
54.5% of the total number of markers) and the
remain-ing parts of the table which contain the specific markers
(189 RAPD variables, i.e. 45.5% of the marker sample).
Among these markers, 99 are significantly more
fre-quent in the E. urophylla population, and 90 are more
frequent in the E. grandis population. The threshold
values of the exact Fisher tests were calculated at the
25% probability level in order to split the markers into
two balanced parts, namely the specific ones (with
different frequencies for the two species, DIF) and the
common ones (with common frequencies for the two
species, COM). The sum of markers present in each row
(
+u
for a particular proportion of bands in E. urophylla)
and column (
+g
for a particular proportion of bands in
E. grandis) is shown in the margin of Table 2. For
instance, 108 markers were present in at least one E.
urophylla
tree and never in E. grandis trees. The
recip-rocal situation concerns only 79 markers, never present
in E. urophylla. These results are consistent with Fig. 1
which shows a larger variability of the urophylla
popu-lation when the distance table is based on D2, i.e. when
the calculation of the distance between two individuals
depends on the whole sample of individuals. The lower
distances between grandis individuals reflect the higher
number of coincidences of zero in the 415 RAPD
vari-ables relatively to the urophylla individuals. The
contin-gency table was further subdivided in nine parts
(dashed lines in Table 1) according to whether or not
the frequency of bands is significantly different from
0 or 1. The proportion of markers present in the each
zone is shown in Table 3 (a). The six different groups (in
italic letters in Table 1), defined the merging of the
symmetric area, from number one to number six: 118
(28%), 72 (17%), 12 (3%), 166 (40%), 33 (8%) and 14
(3%) RAPD variables.
Common variables with low band frequencies are
represented in high frequency (group 1) and comprise
those present once either in E. urophylla (39 of them) or
in E. grandis (15 of them). In order to prevent the
intervention of artefacts (a source of ‘‘noise’’) in
the calculation of genetic distances we worked out the
different distances excluding these two cells [namely,
(0, 1) and (1, 0)]. In fact, the results obtained with these
genetic distances were of no interest and hence will not
be mentioned further in this paper. Finally, one may
note that the cell (0, 0) is structurally empty. The
con-tingency table was then subdivided into nine parts
according to the exact Fisher test calculated at the 5%
probability level. The proportion of markers present in
each new group is shown in Table 3 (b). The six
differ-ent groups corresponding to this new structure contain
from number one to number six: 206 (50%), 14 (3%), 21
(5%), 94 (23%), 36 (9%) and 44 (11%) RAPD variables.
Prediction of specific crossing values
The specific genetic distance Rij (first model) is
analog-ous to the specific Roger’s distance proposed by
Mel-chinger et al. (1990). The correlation coefficients
between Rij of distances D1 and D2 and the SCA of tree
Table 4 General mean and percentages of the variability of genetic distances explained by the main effects and interaction term. %½i, %Zj and %Rij are the percentages of variability of the distance between individuals i and j explained by the two additive effects and the interaction effect, respectively. When additive effects are not
significant (at the 5% level in the ANOVA) the corresponding percentage of the whole sum of squares is replaced by the NS. kDÇ and kDÈ are the general means of D1 and D2, respectively, for each distance table
Item D1 D2
%½i %Zj %Rij kDÇ %½i %Zj %Rij kDÈ
ALL URO NS — 98.3 0.65 25.8 — 48.3 0.28 GRA — NS 97.1 0.61 — 27.2 45.6 0.25 U]G 44.5 27.3 28.3 0.76 43.4 35.5 21.1 0.35 COM URO 30.7 — 38.6 0.69 36.2 — 27.6 0.25 GRA — 25.8 48.9 0.67 — 31.8 36.3 0.23 U]G 36.9 14.2 48.9 0.68 48.3 23.6 28.4 0.24 DIF URO NS — 65.4 0.61 NS — 75.9 0.31 GRA — 27.5 45 0.55 — NS 65.5 0.26 U]G 55.9 31.5 12.6 0.82 44.2 42.9 12.9 0.49 Fig. 2 Plot of genetic distance D2 versus D1, Circle size stands for the
value of SCA; solid circles show a positive SCA and empty bubbles show a negative SCA
trunk volume at 38 months are not significant (0.07 and
0.05, respectively). These results justify the use of ½i and
Zj, the general genetic distances, as co-variates in the
factor regression model. Two distance tables within
species (suffix URO and suffix GRA) and one distance
table between species (suffix U]G) have been created
for three groups of RAPD variables: the total number
of bands (prefix ALL), the subset of common bands
(prefix COM) and the subset of different bands (prefix
DIF). The sum of the common bands and the different
bands forms the total number of RAPD variables. If all
the bands are considered, the correlation coefficients
between distances D1 and D2 calculated within species
(without the null diagonal values) are o"0.77 and
o"0.76 for E. urophylla and E. grandis, respectively.
The correlation coefficient between the two types (D1
and D2) of between-species distance is 0.36 (significant
at the 0.1% level). This rather small value reflects an
actual difference between the two genetic distances.
Figure 2 shows the plot of between species D2 in terms
of between species D1 where circle-size stands for he
SCA value of tree trunk volume at 38 months. Positive
SCAs are solid and negative ones are empty. It seems
that highly positive SCA values (heterosis) are confined
to medium values of genetic distance.
The additive model was performed on distances
D1 and D2 defined within and between species and
worked out from different groups of RAPD variables.
The distributions of different sources of variability for
each distance are presented in Table 4 with the mean
value of each distance table.
The distance tables within species are naturally
sym-metric and therefore the two additive effects are equal.
The amount of variability corresponding to the specific
genetic distance Rij is, as expected, greater within
spe-cies than between spespe-cies. The greater the amount of
the specific genetic distance, the smaller the meaning of
the use of general genetic distances. The mean distances
within E. urophylla are systematically greater than the
mean distances within E. grandis. This remark is
espe-cially true for the whole group and a fortiori for the
specific group. For these two groups the mean
distan-ces between species are clearly greater than the mean
distances within species. Finally, the mean distances
D2, involving double presences plus double absences,
are smaller than the mean distances D1 which only
involve double presences. Correlation coefficients
between co-variates associated to the E. urophylla
Table 6 ANOVA of the factor regression model with one covariate associated to each parent (derived from the ALL-U]G D2 distance). The last column of the ANOVA table shows the amount of the variability of the phenotypic character explained by each term of the factor regression model
Source of Sum of df Mean F-test P-level % Sum of variation squares squares squares E. urophylla 4597.82 8 574.73 — — 60.5% c· ½i 2827.41 1 2827.41 99.1 (0.001 37.2% a@i 1770.41 7 252.91 8.9 (0.001 23.3% E. grandis 1072.03 8 134.00 — — 14.1% d. Zj 1.03 1 1.03 0.0 0.844 K0.0% b@j 1070.99 7 153.00 5.4 (0.001 14.1% E. uro]E. gra 1934.26 81 23.88 — — 25.4% o· ½i · Zj 0.68 1 0.68 0.0 0.873 K0.0% lj · ½i 517.35 7 73.91 2.6 0.023 6.8% ji · Zj 17.56 7 2.51 0.1 0.998 0.2% eij 1398.67 49 28.54 18.4%
Table 5 Results of the factor regression model on the tree trunk volume of hybrids at 38 months using the estimates of general genetic distances as co-variates, giving the percentages of variability explained by the different terms of model. When the effects are not significant (at the 5% level in the ANOVA) the corresponding
percentage of the whole sum of squares is replaced by NS. The interaction term consisting of the regression on the product of the male and female co-variates (o · ½i · Zj) is never significant and hence has not been presented in this table
D1 D2
% c · ½i % d · Zj %lj · ½i ji · Zj % c · ½i % d · Zj %lj · ½i ji · Zj
ALL URO NS — NS — 18.8 — 6.6 — GRA — NS — NS — NS — NS U]G NS NS NS NS 37.2 NS 6.8 NS COM URO NS — NS — 15.2 — NS — GRA — NS — NS — NS — NS U]G 6.1 3.5 NS NS 26.9 1.8 8.2 NS DIF URO NS — NS — 18.2 — NS — GRA — NS — NS — NS — NS U]G NS NS NS NS 13.7 NS NS NS
population (½i) and the E. grandis population (Zj) have
been calculated (data not shown).
The low correlation coefficients between D1 and D2,
COM and DIF, and W and B, justify the calculation of
these parameters. The estimates of additive parameters
based on different distance tables are used in the factor
regression model to explain the tree trunk volume of
hybrids at 38 months (Table 5).
The superiority of the explicative power of the
D2 distance versus the D1 distance is clear. Considering
the D2 distances, those calculated between species are
more explicative than those calculated within species.
Moreover, distances calculated within E. grandis never
explain any part of the variability of the phenotypic
character. The co-variates used in the factor regression
model are extracted from the between-species D2
dis-tances calculated over all the markers (ALL-U]G).
The corresponding ANOVA table is shown in Table 6.
The estimates of the parameters c, d and o of this
model are all positive. Hence the GCA of tree trunk
volume at 38 months is positively correlated with the
genetic distance D2. If the additive model is applied to
the volume at 38 months, the proportion of variability
taken into account by the additive part is 60.5% for the
urophylla
parent plus 14.1% for the grandis parent, and
the interaction part (SCA) represents 25.4%. In the
factor regression model, these three components are
split into regressions on the co-variates and residual
terms from the regressions. The explicative power of
the two co-variates ½i and Zj, reflected by the
coeffic-ient of determination, is 81.6%.
Finally, the factor regression model based on the
D2 between-species distance table calculated with the
common bands (COM-U]G) presents a
determina-tion coefficient equal to 84.2% while the determinadetermina-tion
coefficient corresponding to the D2 between-species
distance table calculated with the different bands
(DIF-U]G) is 77.8%.
This results shows that the effective RAPD markers
for predicting the performance of Ecualyptus hybrids
are those presenting common frequencies in the two
species.
Discussion
Without any available references concerning the use of
RAPDs is Eucalyptus breeding, our approach is mainly
prospective.
Firstly, this study shows that genetic distance based
on RAPDs provides a useful tool to differentiate the
two species of Eucalyptus. If the RAPD variables are
clustered in nine different groups according to their
frequency in both species tested at the 5% probability
level, bands with low frequencies in both species
(group 1) represented 50% of the total number. This
structure of the genetic diversity provides results
char-acterized by a large number of bands with low
frequen-cies and a small number of bands with high frequenfrequen-cies.
Surprisingly, the bands predicting hybrid performance
are those with similar frequencies common to the two
species.
Secondly, the factor regression model gives an
inter-esting partitioning of the GCA and the SCA on tree
trunk volume data at 38 months into linear functions of
relevant male and female variates. The global
co-efficient of determination, 81.6%, is satisfactory,
know-ing that the general genetic distance of E. urophylla
individuals explains 27% of SCA of tree trunk volume
at 38 months. The prediction of heterosis through
gen-etic markers is an old dream of plant breeders. The
usefulness of RAPD-based genetic distance measures in
predicting the performance of between-species hybrids
in Eucalyptus is thus demonstrated.
Thirdly, this study examines the problem of the
choice of genetic distance for predicting crossing
values. The best co-variates are defined from genetic
distances calculated between the species of Eucalyptus
and based on the simple matching coefficient. The
greater efficiency of co-variates derived from
between-species distance versus co-variates derived from
within-species distance is intuitively obvious. However, the
greater efficiency of co-variates corresponding to
gen-eral genetic distances defined by the double presence
plus the double absence (D2) of bands is not evident.
The two genetic distances D1 and D2 have been defined
at the two extremities of the spectrum of the possible
distances with no a priori preference. There are
con-vincing arguments in favour of each definition of
gen-etic distance. Jaccard’s coefficient does not depend on
the individual samples studied but its use implicitly
presupposes a positive effect of the presence of bands.
Peltier et al. (1994) compared these two genetic
distan-ces using RAPD markers in the polygenetic
reconstruc-tion of seven species of Petunia. The authors showed
that the best fit between the a priori taxonomy and the
a posteriori
grouping is obtained with D1 for a priori
distant species, while the best fit is obtained with D2 for
a priori
near species. Two phenomena can generate the
absence of a RAPD band: a modification of a flanking
sequence and the entire absence of the amplified
se-quence. In the first case, D2 is the more accurate genetic
distance, while in the second case D1 is more accurate.
One could argue that it would be interesting to test
other distances. Let us consider the weighted Euclidian
distance d@
2(i, i@ ) between the two individuals i and i@:
d@2(i, i@)"
+j
wj(xij!xi{j)2 where wj"1/var(»j) with
var
(»j) the variance of the j5) marker. This distance
would emphasize the loci presenting a great imbalance
between a proportion of 0 (absence of the band) and
a proportion of 1 (presence of the band). The inverse
weighting would emphasize the loci with a similar
proportion of presence and absence of bands and
might be more interesting. Other kinds of weights
could be imagined employing different criteria. For
example, the number of bases constituting the primers
used in the polymerase chain reaction (PCR) could be
one of them.
To conclude, this study shows the necessity of using
a genetic distance based on common markers for two
species in order to predict the value of crosses. Instead
of using a large number of RAPD bands, it would be
more efficient to find specific bands for the genomic
regions actually contributing to heterosis for the
ag-ronomic traits of interest. A thorough reflection of
the definition of genetic distances and localization in
the between-species contingency table of bands linked
to quantitative traits will be the subject of a further
paper.
References
Baril CP (1992) Factorial regression for interpreting genotype-environment interaction in bread wheat trials. Theor Appl Genet 83 : 1022—1026.
Bouvet JM, Vigneron Ph (1995) Age trends in variances and heritablities in Eucalyptus matting designs. Silvae Genet 44 : 206—216
Denis JB (1988) Two-way analysis using covariates. Statistics 19 : 123—132
Denis JB, Baril CP (1992) Sophisticated models with numerous missing values: the multiplicative interaction model as an example. Biuletyn Oceny Odmian, Poland 24—25 : 33—45 Decoux G, Denis JB (1991) INTERA. Logiciels pour l’interpre´tation
statistique de l’interaction entre deux facteurs. Biome´trie INRA route de Saint-Cyr F 78026 Versailles France
Finlay KW, Wilkinson GN (1963) The analysis of adaptation in a plant-breeding programme. Aust J Agric Res 14 : 742—754 Gallais A (1990) The´orie de la se´lection en ame´lioration des plantes.
Coll Sci Agro Ed Masson
Jaccard P (1908) Nouvelles recherches sur la distribution florale. Bull Soc Vaud Sci Nat 44 : 223—270
Jain A, Bhatia S, Banga SS, Prakash S (1994) Potential use of random amplified polymorphic DNA (RAPD) technique to study the genetic diversity in Indian mustard (Brassica juncea) and its relationship to heterosis. Theor Appl Genet 88 : 116—122 Lamboy WF (1994) Computing genetic similarity coefficients from RAPD data: the effects of PCR artifacts. Cold Spring Harbor Laboratory Press ISSN, 31—37
Melchinger AE, Lee M, Lamkey KR, Woodman WL (1990 a) Gen-etic diversity for restriction fragment length polymorphisms: relation to estimated genetic effects in maize inbreds. Crop Sci 30 : 1033—1040
Melchinger AE, Lee M, Lamkey KR, Hallauer AR, Woodman WL (1990 b) Genetic diversity for restriction fragment length poly-morphisms and heterosis for two diallel sets of maize inbreds. Theor Appl Genet 80 : 488—496
Peltier D, Chacon H, Tersac M, Caraux G, Dulieu H, Berville A (1994) Utilisation des RAPD pour la construction de phylo-grammes chez Petunia. In: Techniques et utilisations des mar-queurs mole´culaires. Coll Les colloques INRA
SAS Instiutute (1988) SAS language guide for personal computers. Release 6.03 edition. SAS Institute, Cary, North Carolina Skroch P, Tivang J, Nienhuis J (1992) Analysis of genetic
relation-ships using RAPD marker data. Joint plant breeding symposia series: applications of RAPD technology to plant breeding, pp 26—30
Sokal RR, Michener CD (1958) A statistical method for evaluating systematic relationships. Univ Kansas Sci Bull 38 : 1409—1438 Tukey JH (1949) One degree of freedom for non-additivity.
Biomet-rics 5 : 232—242
Verhaegen D, Kremer A, Vigneron Ph (1995) Relationships be-tween heterosis and molecular polymorphism in interspecific crosses of Eucalyptus urophylla]Eucalyptus grandis. CRC for temperate hardwood forestry, IUFRO, Hobart, Tasmania, Australia
Vigneron Ph (1991) Cre´ation et ame´lioration des varie´te´s d’hybrides d’Eucalyptus, Durban, September 1991, pp 345—360
Williams JGK, Kubelik AR, Livak KJ, Rafalski JA, Tingey SV (1990) DNA polymorphisms amplified by arbitrary primers are useful as genetic markers. Nucleic Acids Res 18 : 6531—6535
.