HAL Id: hal-02920510
https://hal.archives-ouvertes.fr/hal-02920510
Submitted on 30 Nov 2020HAL is a multi-disciplinary open access
archive for the deposit and dissemination of sci-entific research documents, whether they are pub-lished or not. The documents may come from teaching and research institutions in France or abroad, or from public or private research centers.
L’archive ouverte pluridisciplinaire HAL, est destinée au dépôt et à la diffusion de documents scientifiques de niveau recherche, publiés ou non, émanant des établissements d’enseignement et de recherche français ou étrangers, des laboratoires publics ou privés.
The planktonic stages of the salmon louse
(Lepeophtheirus salmonis) are tolerant of end-of-century
pCO(2) concentrations
Cameron R. S. Thompson, David M. Fields, Reidun M. Bjelland, Vera B. S.
Chan, Caroline M. F. Durif, Andrew Mount, Jeffrey A. Runge, Steven D.
Shema, Anne Berit Skiftesvik, Howard Browman
To cite this version:
Cameron R. S. Thompson, David M. Fields, Reidun M. Bjelland, Vera B. S. Chan, Caroline M. F. Durif, et al.. The planktonic stages of the salmon louse (Lepeophtheirus salmonis) are tolerant of end-of-century pCO(2) concentrations. PeerJ, PeerJ, 2019, 7, pp.e7810. �10.7717/peerj.7810�. �hal-02920510�
Submitted 18 June 2019 Accepted 1 September 2019 Published 14 October 2019 Corresponding author Cameron R.S. Thompson, cameron.thompson@hi.no Academic editor Mark Costello
Additional Information and Declarations can be found on page 18
DOI 10.7717/peerj.7810
Copyright 2019 Thompson et al. Distributed under
Creative Commons CC-BY 4.0
OPEN ACCESS
The planktonic stages of the salmon
louse (Lepeophtheirus salmonis) are
tolerant of end-of-century pCO
2
concentrations
Cameron R.S. Thompson1, David M. Fields2, Reidun M. Bjelland3, Vera B.S. Chan4, Caroline M.F. Durif3, Andrew Mount5, Jeffrey A. Runge6,7,
Steven D. Shema3, Anne Berit Skiftesvik3and Howard I. Browman3
1Institute of Marine Research, Bergen, Norway
2Bigelow Laboratory for Ocean Sciences, East Boothbay, ME, United States of America 3Austevoll Research Station, Institute of Marine Research, Storebø, Norway
4LEMAR, Institut Fran¸cais de Recherche pour l’Exploitation de la Mer, UMR 6539 (UBO/CNRS/IRD/Ifremer),
Plouzané, France
5Department of Biological Sciences, Clemson University, Clemson, SC, United States of America 6School of Marine Sciences, University of Maine, Orono, ME, United States of America
7Gulf of Maine Research Institute, Portland, ME, United States of America
ABSTRACT
The copepod Lepeophtheirus salmonis is an obligate ectoparasite of salmonids. Salmon lice are major pests in salmon aquaculture and due to its economic impact
Lepeoph-theirus salmonisis one of the most well studied species of marine parasite. However, there is limited understanding of how increased concentration of pCO2associated with
ocean acidification will impact host-parasite relationships. We investigated the effects of increased pCO2on growth and metabolic rates in the planktonic stages, rearing L.
salmonis from eggs to 12 days post hatch copepodids under three treatment levels: Control (416 µatm), Mid (747µatm), and High (942µatm). The pCO2 treatment
had a significant effect on oxygen consumption rate with the High treatment animals exhibiting the greatest respiration. The treatments did not have a significant effect on the other biological endpoints measured (carbon, nitrogen, lipid volume, and fatty acid content). The results indicate that L. salmonis have mechanisms to compensate for increased concentration of pCO2and that populations will be tolerant of projected
future ocean acidification scenarios. The work reported here also describes catabolism during the lecithotrophic development of L. salmonis, information that is not currently available to parameterize models of dispersal and viability of the planktonic free-living stages.
SubjectsEcology, Marine Biology, Parasitology, Aquatic and Marine Chemistry, Biological Oceanography
Keywords Salmon lice, Copepod, Ocean acidification, Parasite, Energetics, Metabolism, Growth, Lipid, Lepeophtheirus salmonis, Aquaculture
INTRODUCTION
Predictions of long-term change in pCO2 and pH in the ocean, and their possible
these drivers on marine organisms (e.g., Caldeira & Wickett, 2003; Fabry et al., 2008;
Dupont & Pörtner, 2013). Meta-analyses indicate variable responses to pCO2among taxa,
species within taxa, populations within species, and individuals in any given experiment (e.g.,Kroeker et al., 2010;Whiteley, 2011;Garrard et al., 2012;Wittmann & Pörtner, 2013). While this maturing field of research indicates that there will be ‘‘winners and losers’’ in response to ocean acidification (OA), it is more difficult to predict the extent to which future change will impact ecosystems (e.g.,Dupont, Dorey & Thorndyke, 2010;Gaylord et al., 2011).
Energy is required to maintain physiological homeostasis in response to environmental change, and responses to environmental stressors are frequently assumed to increase metabolism. However, it is difficult to measure energetic costs directly because organisms can compensate with the reallocation of resources within the organisms’ energy budget (Pan, Applebaum & Manahan, 2015) or by changes in behavior. In addition, the effect of pCO2 on biological endpoints such as growth is often masked by the saturating
food concentrations that are used in most experiments (Ramajo et al., 2016). This study investigates the energetic costs of increased pCO2 on the lecithotrophic stages
of Lepeophtheirus salmonis (hereafter referred to as salmon lice).
Salmon lice are obligate ectoparasites which feed on mucus, tissue and blood, causing sores, immunosuppression, and reduced feed conversion efficiency in hosts (Torrissen et al., 2013). Salmon lice infestations on Atlantic salmon (Salmo salar) aquaculture cause direct losses and require the implementation of control efforts, which cost an estimated 1 billion USD in economic loses in 2015 (Torrissen et al., 2013;Igboeli, Burka & Fast, 2014;Liu & Bjelland, 2014;Brooker, Skern-Mauritzen & Bron, 2018). They have also been linked to the decline of some wild salmonid populations, which has prompted regulatory restrictions on salmon aquaculture (Krkosek, Lewis & Volpe, 2005;Krkosek et al., 2007;Krkosek et al., 2012;Costello, 2009;Torrissen et al., 2013;Thorstad et al., 2015;Vollset et al., 2017). The importance of salmon lice has motivated several decades of concerted research, making them one of most well-studied species of marine parasite and, thereby, an ideal model species for OA research.
Salmon lice hatch from egg strings produced and carried by females. The salmon louse has 8 developmental stages which are easily differentiated and are characterized by distinct behaviors and ecologies (Hamre et al., 2013;Eichner, Hamre & Nilsen, 2015). During the early developmental stages, prior to host attachment, the louse consumes only the lipid stores contained within the yolk sac. Once the louse metamorphoses into the infective stage (3.81 days post hatch (DPH) at 10◦C), it seeks a salmon host on which it will attach and feed (Samsing et al., 2016). In this study, we exploit the finite energy reserves carried by the non-feeding, free-living life history stages of the salmon louse to investigate the metabolic cost of increased pCO2. Two instantaneous measures of metabolism (oxygen consumption,
and mitochondrial membrane potential) and four metabolic endpoints (carbon, nitrogen, lipid volume, and fatty acids) were measured to determine the impact of increased pCO2
METHODS
Experimental design
The experiments were conducted at the Austevoll Research Station, Institute of Marine Research, Norway (60.086N, 5.262E). On the 18th of March 2016, 50 Atlantic Salmon (weight = 300–450 g) were collected from the station’s experimental sea cages and placed in a holding tank with a load of 1-6 female salmon lice per fish. The holding tank was connected to flowing seawater pumped from Bjørnafjord at a depth of 160 m, sand filtered and additionally passed through a 20 mm Arcal disc. As reported by Runge and others (2016), the pH (NBS) of the ambient seawater is 7.95, which corresponds to a pCO2
of 580µatm. On May 10th, 14th and 24th, 2016 salmon were sampled using dip nets, anesthetized with tricane methanesulfonate (MS-222), and female sea lice with egg strings were removed using forceps, after which the fish were immediately returned to the holding tank. The salmon remained in the holding tank until the end of the experiment in June 2016 and were then returned to the station’s sea cages. In May 2017, salmon (mean weight of 3.4 kg) were sampled from those same sea cages and additional female lice with egg strings were collected for supplemental measurements of respiration by embryos in egg string.
Egg strings were separated from the females and placed into one of three hatchery tanks under the control experimental conditions (416µatm pCO2, 10.5◦C). Within the holding
tanks, egg strings were incubated in several hatching chambers made from PVC pipe with a diameter of 10 cm and depth of 15 cm. The top of the chamber was suspended above the water line while the bottom of the chamber was sealed with 80µm mesh, allowing constant water exchange while preventing animals from escaping. Approximately 31,000 newly hatched salmon lice were transferred from these chambers to the 15 experimental treatment tanks. Following the methodology described by Runge and others (2016), inoculation of treatment tanks was conducted over a period of 8 days beginning on May 14th 2016, with staggered distribution to the three pCO2treatment levels. The experiment
in each treatment tank lasted for 12 days starting with the inoculation of newly hatched sea lice, and ending with the take down of the tank and sampling of remaining animals for fatty acid analysis. At no time during the experiment were the sea lice provided a food source. Non-feeding nauplii developed to the infective copepodids and were reliant upon lipid reserves until the conclusion of the experiment.
Experimental conditions
There were three pCO2 treatment levels: a ‘High’ of 942 µatm representing IPCC
(Intergovernmental Panel on Climate Change) worst case scenario end of the century projections, an intermediate ‘Mid’ of 747µatm and the ‘Control’ of 416µatm, representing current conditions. Treatment conditions were maintained through the addition of CO2
stripped air (in the case of the Control treatment) or CO2 enriched seawater that was
created by bubbling CO2. A full description of the experimental facilities and CO2
treatment system can be found in Bailey and others (2016). Daily measurements of tank conditions and analysis of carbonate chemistry were conducted to assess consistency of conditions throughout the experiment. Temperature and salinity in the tanks were
measured daily using a hand-held multimeter (Cond 340i conductivity meter: WTW, Germany). The temperature in the experimental tanks increased, from a mean of 10.6◦C at the start of the experiments on May 14th to 10.9◦C at the termination of experiments on June 2nd. Temperature differences were normalized for by calculating degree days:
DD =[(TMAX+ TMIN)/2] - TBASE, with TBASE set to 0◦C (McMaster & Wilhelm, 1997).
Degree days provide a single continuous variable that normalizes for small differences in temperature between treatments and replicates over the course of the experiment.
Water samples (100 mL) were collected daily from each treatment tank for spectrophotometric measurement of total scale pH using m-cresol purple dye (SOP 6b,
Dickson, Sabine & Christian, 2007). Carbonate chemistry was determined independently from routine observations with 40 measures each of total alkalinity, temperature, salinity, and nutrients (phosphate, silicate and nitrate). The samples (250 mL) were fixed with a saturated mercuric chloride solution (Riebesell et al., 2010) and held in the dark at 8◦C until analysis. A detailed description of the protocols carried out for spectrophotometric pH and carbonate chemistry measurements can be found in Bailey and others (2016).
Biological measurements of catabolism
After hatching, sea lice develop through two naupliar stages, then progress to the infective copepodid stage before attaching to a host (Hamre et al., 2013;Eichner, Hamre & Nilsen, 2015). Since all the free-living planktonic stages are non-feeding, the animals metabolize their lipid reserves and continuously lose mass (Tucker, Sommerville & Wootten, 2000). The biological measurements tracked metabolism throughout this non-feeding period in order to compare catabolism across treatments. Along with the collection of egg strings for analysis, each tank was sampled three times over the 12 day experiment, once while the animals were in the naupliar stage and twice while they were copepodids.
Sampled animals and egg strings were processed for measurement of dry weight, carbon and nitrogen content (C/N); oxygen consumption rates (OCR); mitochondrial activity, and 3D measurement of lipid globule volumes. At the end of the experiment, remaining animals in each treatment tank were collected for analysis of their fatty acid (FA) profiles. The additional egg strings collected in 2017 were analyzed for OCR in ambient seawater (580µatm pCO2) at a temperature of 10.5◦C. Respiration rates for egg strings were not
observed in 2016 since a single OCR measurement took >8 h to complete and all egg strings were needed immediately for tank inoculations.
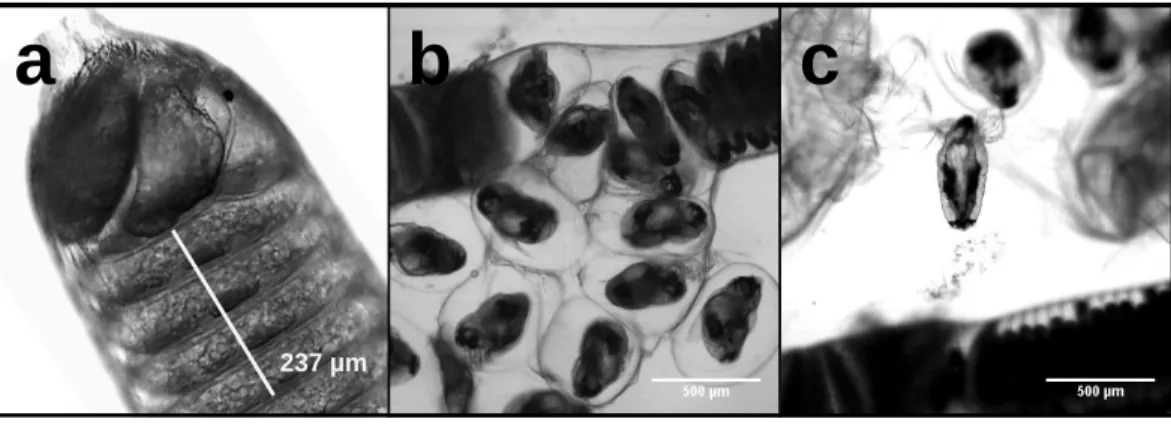
Carbon and nitrogen content in nauplii and copepodids was assessed by pipetting a known number of animals into an aluminum weighing dish, removing the excess seawater, and drying the sample in an oven at 60◦C until a constant weight was reached. Egg strings were measured intact, but to calculate the dry weight, carbon, and nitrogen content of individual eggs it was necessary to count the number in each egg string. Egg strings are composed of a rigid casing that can contain >500 eggs stacked on top of one another in a regular pattern (Fig. 1). Newly extruded egg strings appear white in color and individual eggs are not easily distinguished initially, but as they develop the pigmentation becomes more pronounced, with pigmentation being greatest just prior to hatching. We examined each egg string under a Leica MS5 dissecting microscope fitted with a Moticam 10 digital
a
b
c
237 µm
Figure 1 L. salmonisnaupplii hatching from egg string. The progression of egg hatching is depicted;
(A) the terminal section of an egg string with stacked eggs visible; (B) the egg string casing is split and the individual eggs begin to separate from the string; (C) a nauplius newly emerged from an egg.
Full-size DOI: 10.7717/peerj.7810/fig-1
camera, with which images were taken. Images were processed using ImageJ (NIH, USA) to count the eggs contained in each string. Excluding the terminal segments where eggs do not develop (Fig. 1A), egg string length was measured using ImageJ’s segmented line tool. Segments of each egg string were measured and the number of eggs within that section were counted. An overall average of eggs per egg string length was then used to calculate the number of eggs in each string. The same procedure was used on the capsules discarded when nauplii hatched from the egg strings. Subtracting the capsule values from the full egg string measurements provided the basis for the per egg dry weight, carbon, and nitrogen content. After imaging, the egg strings were rinsed by dipping them in a sequence of three five mL baths of distilled water. They were then placed in a pre-weighed aluminum dish in an oven at 60◦C and were reweighed after 24 h to the nearest 1µg on a Mettler-ToledoUMX2 microbalance. All samples were sealed in a vacuum chamber with desiccant and transported to the Darling Marine Center (Walpole, ME, USA) for C:H:N analysis. Samples for C:H:N analysis were combusted in a Perkin Elmer 2400 Series II CHNS/O analyzer equipped with a thermal conductivity detector using ultra high purity helium as a carrier gas.
Respiration, measured as oxygen consumption
Oxygen consumption rates (OCR) were measured using animals collected from each replicate tank and transferred to the respiration chambers. The mean sample size for OCR was 95.1 animals, consistent with our target sample size of 100, but to reduce handling stress we did not make precise counts of the animals until after the measurements were made, which resulted in a large range of sample sizes (47–237). Supplemental measurements of OCR were made in 2017 on egg strings taken from ambient seawater conditions. Each sample contained 1–3 egg strings which were imaged for egg count after the OCR measurement was taken, giving a range of 307–1,131 eggs per sample.
The respiration chambers were filled with 0.2µm filtered seawater (FSW) containing no air space (4.3 mL) and closed by a ground glass top equipped with a pinhole (0.4 mm) to accommodate the microelectrode. Dissolved oxygen concentrations were measured using
a Clark-type oxygen microelectrode (Unisens; Aarhus, Denmark). Each electrode was calibrated with an anoxic standard of 0.1 M sodium ascorbate and 0.1 M sodium hydroxide solution, and a 100% oxygen saturation point attained through vigorous bubbling of FSW. The FSW also served as the default condition for respiration measurements, with animals and without. All oxygen measurements were made at 10.5◦C (+0.01◦C) in a ThermoScientific water bath (Model A10B with thermostat SC100). Oxygen concentrations within the chambers were measured every 2 s for a minimum of 2 h. The overall oxygen consumption rate for each trial was determined through linear regression of oxygen over time, corrected for changes in control FSW, and not including any points below 80% oxygen saturation.
Fatty acid analysis
At the end of the experiments (12 DPH), the remaining animals within each treatment tank were sorted to remove debris and transferred into microcentrifuge tubes. Approximately 1,000 animals per sample were required to obtain enough mass to reliably measure. A total of 14 samples of 3–5 egg strings each were rinsed with distilled water, freeze dried, and placed in a −80◦C freezer until transport and analysis. The samples were processed by Bigelow Analytical Services (Bigelow Laboratory for Ocean Sciences, East Boothbay ME). FAs were converted to FA methyl esters (FAMEs) in a one-step extraction direct methanolysis process (Meier et al., 2006) following the procedures detailed inJacobsen, Grahl-Nielsen &
Magnesen (2012). FAMEs were analyzed on a gas chromatograph with mass spectrometric
detector (Shimadzu GCMS-QP2010 Ultra; Shimadzu Scientific Instruments, Columbia, MD). Individual FAMEs were identified via comparison to standard mixture peak retention times and fragmentation patterns using the NIST-library of compound mass spectra. FAME concentrations were calculated from 200 peak area relative to that of a C19:0 internal standard that was added to each sample prior to extraction. In preparation for data analysis, the FA data was converted to percentage and normalized with a sqrt arcsine transformation.
3D Imaging of lipid volume
Lipid volume was observed in 10-20 animals from each replicate on the 2nd and 8th DPH, when lice were in the nauplius and copepodid stages, respectively. The animals were treated with 7.8% w/v MgCl2seawater to sedate them, and were then preserved in
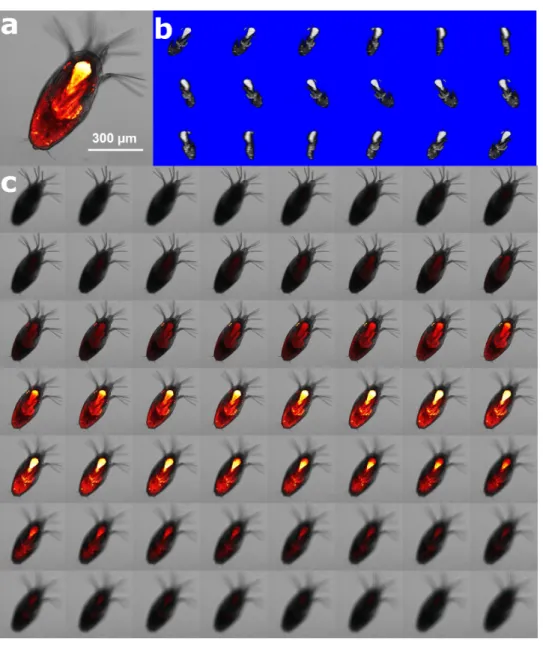
4% paraformaldehyde FSW for microscopy analysis at Clemson University. Animals were stained overnight with 50µM Nile Red (NR) solution (1mM stock solution prepared in DMSO; stored at 4◦C) in FSW and then gently washed three times with FSW to remove unbound NR. Intracellular lipids were fluorescently stained (λ exc/ λ em = 552/636 nm) with NR solution and a confocal microscope with a 5× objective and a 561 nm laser was used to capture xyz-images (Fig. 2). Using a low magnification objective with resolution setting of 2,048 × 2,048, 8–10 animals can be observed simultaneously, reducing fluorescence intensity differences due to variation in instrumentation. All animals were imaged on the same day to minimize potential intensity change over time and potential fluctuations in laser performance. Fluorescence caused by the lipid stain was isolated using
Figure 2 Method of lipid quantification of L. salmonis nauplii by nile red (NR) staining. (A) Lipid rich
locations bind with NR emitting florescence characterized by confocal microscopy. (B) 3D-reconstruction of the fluorescent signals in white pixels enables 3D visualization of the lipid location in 360◦
rotation. (C) Z-layers of fluorescent signal beyond the threshold value are shown in grey voxels, the number of voxels was counted and multiplied by calibrated voxel volume (nL) for quantification of the lipid volume.
Full-size DOI: 10.7717/peerj.7810/fig-2
confocal microscopy and captured during image acquisition. Gray value thresholding was applied to the fluorescent images using ImageJ to select the voxels (pixels in three dimensions), and the total number of voxels were then counted through the z-stack of images for each animal. The lipid volume was calculated from voxel number*voxel size, which was calibrated to nL. Calibration of voxel depths (z-dimension) obtained with a 5x objective was carried out on a quantified volume with a 10x objective in order to improve the accuracy of the voxel size calculation.
In vivo measurement of cellular metabolic state
The metabolic activity of sea lice on 4, 6, 8, and 10 DPH was observed by measuring mitochondrial membrane potential (MMP). Membrane polarization in mitochondria is an indication of active cells. This was visualized by ratiometric measurement of JC-10 (Fig. 3), a fluorescent dye which is reactive to the electrical polarization of membranes (seePark, Chun & Kim, 2013). On each sampling day, the metabolic status of 5-6 living sea lice collected from each replicate tank was analyzed at the Molecular Imaging Center, Bergen University. During transport, animals were kept at low density (five larvae per mL) in two mL sample tubes filled with seawater from the replicate tank leaving minimal head space. At the imaging facility, sea lice were stained with 25µM JC-10 for 15 min and were then washed with seawater from the experimental tank from which they were collected. Prior to imaging, sea lice were immobilized with molten 2% agarose in FSW; cover slips were then used to support the agarose on the slide. The slide was briefly placed on ice so that the agarose would cure and minimize the lice movement enabling good overlay of the fluorescent channels. Polarized mitochondria were represented by red JC-10 aggregate (λ exc/λ em = 488/590 nm) while the green JC-10 monomer (λ exc/ λ em = 488/525 nm) labeled the presence of mitochondrial membrane. Both the red and green channels were captured on a LSM510 confocal microscope using a 488 nm laser with the same excitation energy (3–15%). Fluorescence images were obtained as 512 × 512 × 16 bit xyz images. The R/G ratio served as a normalized measure of active mitochondria (Park, Chun & Kim, 2013). R/G ratio image was generated for all z layers using the Ratio Plus Plugin in ImageJ, and the area with the best signal was selected using the wand tool with a tolerance value of 0.6.
Data analysis
Analysis of variance (ANOVA) in R (R Core Team, 2018) was used to determine whether the treatments had any effect on the biological endpoints that were measured. In cases where the data were nonlinear, General Additive Models (GAM) were applied using the -mgcv package (Wood, 2015). In those cases, the GAM smoothed the time term degree day so that a hypothesis test could be performed on the fitted models of differing treatments.
RESULTS
Experimental conditions
During the 3-week experiment, mean salinity was 34 PSU and mean temperature was 10.7 ◦C. A gradual increase in the temperature of the source water led to a difference between treatment tanks of up to ± 0.3 ◦C. There were no significant differences in degree days between treatments (Table 1). Carbonate chemistry in the treatment tanks was calculated using pH measurements and Alkalinity. The pH was not significantly different between replicate tanks within a treatment but was significantly different between treatments with a pHTof 7.81, 7.60, 7.51 in the Control, Mid and High pCO2treatments
(Table 1). There were no significant differences in the nutrient concentration or total alkalinity across treatments (Table 1); therefore, the data were pooled to calculate daily carbonate chemistry. The mean pCO2levels calculated from the carbonate chemistry for
Figure 3 Measurement of mitochondrial activity using image analysis approach in the swimming arms of a 4 DPH L. salmonis nauplius. An image representative of the left (left column) and right (right
column) arm generates a ratio value of JC-10 fluorescence with respect to the Red (560–615 nm) and Green (505–553 nm) fluorescence. Areas selected (outlined in yellow) were quantified to compare the Red/Green fluorescence ratios.
the respective Control, Mid, and High treatments were 416, 747, and 942µatm,consistent with the target values of 400, 750, and 950µatm.
Catabolism of energy stores: carbon, nitrogen, FA, and lipids
There was a consistent pattern of catabolism with age (DPH) and degree day across all treatments; carbon, nitrogen, lipid volume and fatty acids all declined during the experiment. Image analysis revealed 16.9 ± 0.26 eggs per mm, with a mean of 318 ± 7.9 eggs per string. Mean dry weight of a single salmon louse egg was 5.13 ± 0.082µg and contained 2.98 ±0.05µg of carbon and 0.47 ± 0.006µg of nitrogen. Each egg capsule weighed 0.48 ± 0.035µg and contained 0.14 ± 0.01µg of carbon and 0.05 ± 0.002
µg of nitrogen. Carbon and nitrogen content declined as animals developed through naupliar and then copepodid stages (Figs. 4A&4B). The degree day relationship with both carbon and nitrogen was significant (GAM, p< 0.001), but the pattern of catabolism differed. Nitrogen content dropped 30% after eggs hatched, going from 0.47 ± 0.006µg to 0.328 ± 0.008µg 2 DPH in the ambient treatment, and then decreasing an additional 5% to 0.311 ± 0.008µg 12 DPH. Meanwhile carbon content declined in a linear fashion, which fit to the polynomial model: f (Carbonµg) = 2.97 – 0.019 degree day + 0.00005 degree day2, (adjusted r2 = 0.96). The decline in carbon content from 2 DPH (2.578 ± 0.012
µg) to 12 DPH (1.382 ± 0.010µg) amounted to a 5% reduction per day. Lipid volume in the animals also declined: the mean volume fell from 5.54 ± 0.19 nL ind−1 2 DPH, to 4.42 ± 0.19 nL ind−18 DPH, a 3% reduction per day (Fig. 5, Age (DPH): ANOVA F (1,171) = 16.34, P < 0.001). Total fatty acid content (FA) decreased 6.6% per day from egg strings to 12 DPH copepodid (Table 2).
Of the 36 identified FAs, the 5 most abundant FAs each contributed a minimum of 3% to the total. Those 5 FAs, along with saturated (SFA), monounsaturated (MUFA), and polyunsaturated FA (PUFA), were tested for differences in the proportion between egg strings and 12 DPH copepodids. All FAs tested differed significantly based on stage (Table 2). The greatest proportional change in FA type between egg strings and copepodids occurred in PUFA, which decreased by 56%, while MUFA increased by 38% and SFA increased by 6%. Oleic acid (C18:1n-9) exhibited the greatest proportional reduction from egg to copepodid, decreasing by 93%. The SFA C16:0 and C18:0 had a proportional increase of 40% and 67% respectively, and while the PUFA DHA (C22:6n-3) increased 36%, EPA (C20:5n-3) decreased 6%.
Instantaneous measures of catabolism: OCR, MMP
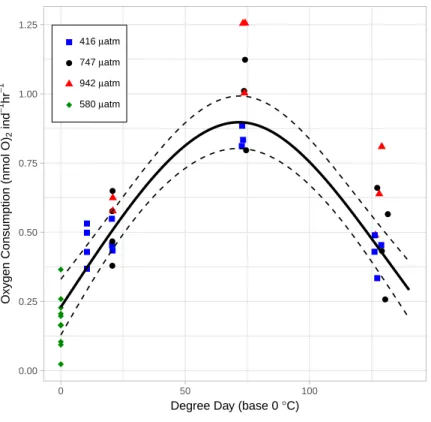
As the lice hatched and developed to late stage copepodids, respiration followed a pattern of first increasing and then decreasing oxygen consumption rate (OCR) (Fig. 6). Specifically, in the control treatment, OCR increased from 0.479 ± 0.035 nmol hr−1 at 2 DPH to 0.843 ± 0.022 nmol hr−1at 7 DPH, and then decrease to 0.427 ± 0.033 nmol hr−112 DPH. The relationship with degree day (TBASE of 0◦C) was significant for all treatments (GAM,
P < 0.001, adjusted r2 = 0.854,Fig. 6).
The mitochondrial activity in the swimming arm, as measured by MMP, was not significantly related to degree day (Fig. 7; GAM, P = 0.062, adjusted r2 = 0.015).
Table 1 Treatment tank experimental conditions. Mean (±s.e.) Degree Day (base 0◦
C), Temperature (◦
C), pH, Nutrients, and Carbonate Chemistry in treatment tanks for each pCO2level and the global average. Total scale pH (pHT,spec), measured daily spectrophotometrically. Calculations of carbonate chemistry made at spec
ex-perimental temperatures using CO2SYS with global mean nutrient concentrations and total alkalinity. Resulting p-value from ANOVA of treatment differences, and num-ber of samples is included for each metric.
pCO2 treatment Degree day◦ C Temp ◦ C pHT,spec pHT,calc pCO2 µatm HCO3
µmol kg−1 COµmol kg3 −1 µCOmol kg2 −1 ATµmol kg
−1 Nitrite
µmol L−1 Nitrateµmol L−1 Phosphateµmol L−1 Silicateµmol L−1
Control 136.1 ± 3.5 10.6 ± 0.03 7.81 ± 0.002 8.03 ± 0.002 416 ± 1.7 128.4 ± 0.08 17.9 ± 0.08 2,281 ± 2.5 2,281 ± 2.5 0.04 ± 0.01 4.84 ± 1.47 0.27 ± 0.08 5.65 ± 0.10 Mid 129.5 ± 0.9 10.8 ± 0.05 7.60 ± 0.001 7.80 ± 0.002 747 ± 3.0 81.0 ± 0.22 32.0 ± 0.10 2,281 ± 2.8 2,281 ± 2.8 0.06 ± 0.03 1.93 ± 1.26 0.08 ± 0.03 5.70 ± 0.08 High 128.6 ± 0.6 10.7 ± 0.03 7.51 ± 0.002 7.71 ± 0.002 942 ± 5.2 66.1 ± 0.29 40.7 ± 0.20 2,277 ± 2.0 2,277 ± 2.0 0.04 ± 0.01 1.79 ± 1.05 0.18 ± 0.05 5.59 ± 0.07 Global 131.5 ± 1.5 10.7 ± 0.03 – – – – – – 2,280 ± 1.5 0.04 ± 0.01 3.01 ± 0.78 0.19 ± 0.04 5.64 ± 0.05 P-value 0.5150 0.0085 <0.001 <0.001 <0.001 <0.001 <0.001 <0.001 0.3808 0.677 0.173 0.176 0.713 N 14 202 183 183 183 183 183 183 42 34 34 34 34 Thom pson e t al. (2019), P eerJ , DOI 10.7717/peerj.7810
● ● ● ● ● ● ●● ● ● ● ● ● ●● ● ● a a a a a a a a a a a a a a a a a a a a a a a a a a a a a a a a a a a a a a a a a a a a a a a a a a a a a a a a a a a a a a a a a a a a a a a a a 1.0 1.5 2.0 2.5 3.0 3.5 0 50 100 150
Degree Day (base 0 °C)
Carbon Content ( µ g) ● 416 µatm 747 µatm 942 µatm ● ● ● ● ● ● ● ● ● ● ● ● ● ● ● ● ● b b b b b b b b b b b b b b b b b b b b b b b b b b b b b b b b b b b b b b b b b b b b b b b b b b b b b b b b b b b b b b b b b b b b b b b b b 0.25 0.30 0.35 0.40 0.45 0.50 0 50 100 150
Degree Day (base 0 °C)
Nitrogen Content ( µ g) ● 416 µatm 747 µatm 942 µatm
Figure 4 Carbon (A) and Nitrogen (B) content of L. salmonis in relation to degree day and pCO2
treat-ment level. Egg string observations included at degree day 0. Treattreat-ments are Control (416µatm), Mid (747µatm), and High (942µatm). A General Additive Model was fit to the data, the smoothed term with 95% confidence intervals is depicted by the solid and dashed lines.
Full-size DOI: 10.7717/peerj.7810/fig-4
Treatment effects of elevated pCO2
There were no differences in MMP between treatments. Specifically, when analyzed by degree day, there was no significant difference between the Control and Mid (GAM,
P =0.873), nor the Control and High (GAM, P = 0.952) pCO2treatments (Fig. 7).
OCR in the High pCO2treatment was significantly higher than in the Control (GAM,
P <0.001) (Fig. 6). Control pCO2had the lowest coefficient of OCR at 0.48 ± 0.03 nmol
hr−1followed by Mid with 0.54 ± 0.05 nmol hr−1, and High pCO2oxygen consumption
was greatest with 0.69 ± 0.05 nmol hr−1. Since the OCR measurements of egg strings were conducted on a different cohort of animals, we applied a GAM to the dataset without those measurements—when this was done, OCR in the High pCO2treatment was still
significantly higher than in the Control (GAM, P <0.001).
Nitrogen content of the nauplii and copepodids in the Mid treatment was significantly lower than the Control treatment (GAM, P = 0.039), with an estimate of 0.348 ± 0.01 compared to 0.376 ± 0.01. Otherwise, the pCO2 treatment did not affect catabolism of
energy stores with no significant difference found between Control and High in nitrogen content (GAM, P = 0.655), or carbon content (GAM, P = 0.736), and no difference found between Control and Mid treatments in carbon content (GAM, P = 0.081). There was also no significant difference in lipid volume between the treatment groups (ANOVA, F
● ● ● 0 2 4 6 8 10 12 2 8
Days Post Hatch
V
olume (nL)
416 µatm 747 µatm 942 µatm
Figure 5 L. salmonislipid volume by age and pCO2treatment. Treatments are Control (416µatm),
Mid (747µatm), and High (942µatm).
Full-size DOI: 10.7717/peerj.7810/fig-5
Table 2 L. salmonisfatty acid profiles by stage and treatment. 36 Fatty Acids (FA) were identified, the table columns show the mean weight (ng)
of the major FA and the weight of Saturated (SFA), Monounsaturated (MUFA), and Polyunsaturated (PUFA) FA. Profiles are from egg strings and 12 DPH copepodids, which are presented combined and separated by treatment. Treatments are Control (416µatm), Mid (747µatm), and High (942µatm). Sample number and p-values from ANOVA are indicated.
Fatty Acid Profile Components by Stage
C16:0 C18:0 C18:1n-9 C20:5n-3 C22:6n-3 SFA MUFA PUFA Total
Egg String (ng) 158.6 30.7 144.1 49.8 253.3 892.0 228.6 252.1 1,372.7
Copepodids (ng) 46.9 10.9 2.2 9.9 73.0 199.7 67.1 23.7 290.6
P-value <0.001 <0.001 <0.001 <0.001 <0.001 <0.001 <0.001 <0.001 <0.001
N 19 19 19 19 19 19 19 19 19
by Treatment
C16:0 C18:0 C18:1n-9 C20:5n-3 C22:6n-3 SFA MUFA PUFA Total
Control (ng) 36.7 8.1 1.3 8.4 67.2 165.6 52.6 15.9 234.1
Mid (ng) 52.5 12.3 2.6 10.6 76.9 217.4 75.1 27.5 320.0
High (ng) 50.4 11.8 2.6 10.6 74.5 211.9 72.1 26.8 310.8
P-value 0.094 0.135 0.152 0.323 0.258 0.090 0.113 0.219 0.120
● ● ● ● ● ● ● ● ● ● ● 0.00 0.25 0.50 0.75 1.00 1.25 0 50 100
Degree Day (base 0 °C)
Oxygen Consumption (nmol O)
2 ind − 1 hr − 1 ● 416 µatm 747 µatm 942 µatm 580 µatm
Figure 6 The relationship between Oxygen Consumption Rates and degree days in L. salmonis un-der different pCO2treatments. Treatments are Control (416µatm), Mid (747µatm), and High (942
µatm). Supplemental egg string measurements were taken at ambient water conditions (580µatm) and from a separate cohort of animals. Egg string observations are included at degree day 0. A General Addi-tive Model was fit to the data; the smoothed term with 95 % confidence intervals is depicted by the solid and dashed lines.
Full-size DOI: 10.7717/peerj.7810/fig-6
(2,171) = 0.03, P = 0.967). ANOVA was performed on the 5 most abundant FAs along with the 4 FA groupings and total FA to test for differences between treatments; there were no significant differences (Table 2).
DISCUSSION
Catabolism of energy stores
As the salmon lice hatched and developed through non-feeding planktonic stages, the carbon and nitrogen content as well as lipid reserves decreased. During the 12 days of post hatch larval development, 54% of carbon mass and 28% of nitrogen mass was consumed. Nitrogen content declined most during the first 2 days after hatching, reflecting the structural changes taking place during development from egg to nauplii. The steady decline in carbon observed was likely due to the metabolism of energy stores in the form of lipids. The decline in lipid volume coincided with a decline in FA weight and an alteration in the FA profile indicative of the preferential catabolism of certain FAs.
The lipid profile of copepods reflects their life history strategy and diet with wax esters preferentially used for long term storage and triacylglycerols for short term demands
●
●
●
●
●
●
●
●
0.30 0.35 0.40 0.45 0.50 0.55 4 6 8 10Days Post Hatch
log nor mal (JC10 r atio)
●
416 µatm 747 µatm 942 µatmFigure 7 Mitochondrial activity in swimming arm of L. salmonis nauplii under pCO2treatment.
Ra-tios are log normal, 95% sem error bars are depicted with age offset for visibility. Treatments are Control (416µatm), Mid (747µatm), and High (942µatm).
Full-size DOI: 10.7717/peerj.7810/fig-7
(Kattner & Hagen, 2009). The lipid profile of salmon lice is principally composed of triacylglycerols with the FA composition reflecting that of their host fish which results in salmon lice from farmed and wild populations having distinct profiles (Tocher et al., 2010). The FA profiles are also dependent on the stage sampled (this study) and the relative changes in specific FAs from egg to 12 DPH copepodids indicate which FAs are utilized for energy during development (Table 2). For example, both PUFA and MUFA levels decreased significantly. Within the MUFA oleic acid declined sharply, indicating that it is an important energy storage reservoir in salmon lice. Meanwhile, the proportional increase in some SFAs indicates those specific FAs were not as readily catabolized.
Declining energy stores prior to host attachment in L. salmonis is typical of lecithotrophic development (e.g., Li et al., 2012;Figueiredo et al., 2008;Werbrouck et al., 2016), and the depletion of these energy stores is linked to temperature and mortality (Brooker, Skern-Mauritzen & Bron, 2018). At the conclusion of our 12 day experiment the salmon lice had reached an average of 131.5 degree days. Using the observed relationship between carbon content and age, we can calculate the carbon remaining at the end of a louse’s life when energy reserves are depleted. Taking the endpoint of 150 degree days cited in modeling studies (Asplin, Boxaspen & Sandvik, 2011;Asplin et al., 2014;Johnsen et al., 2014) 1.24µg of Carbon or 42% of the amount found in eggs, would remain. That decrease highlights the importance of energy reserves to the planktonic stages; any factor affecting the starting
amount, or the rate of catabolism, would have an impact on viable lifespan and, thereby, on host infestation success.
Instantaneous measures of catabolism
L. salmonisis lecithotrophic and therefore consumes energy reserves during development. However, the rate of catabolism is not linear with age. OCR was lowest at the egg stage, increased through naupliar stages, and reached a maximum in the infectious copepodid stage (7 DPH) before decreasing to levels similar to that of egg strings. The high respiration during the infectious stage may be related to the increased metabolic cost of detecting and finding a host. However, at least in this experiment, this increase was unrelated to host seeking behavior since no host stimuli were present to activate them. Only in the presence of chemical cues originating from their host will L. salmonis engage in host seeking behaviors such as increasing their swimming activity (Mordue & Birkett, 2009). Likewise, a flickering light stimulus simulating the presence of a host fish swimming overhead (and casting a shadow downwards) induces increased swimming speed in infective-stage copepodids (Fields, Skiftesvik & Browman, 2017). Here, mitochondrial activity in the swimming arm was not elevated during the infectious period between 6 and 10 DPH. Therefore, it is unlikely that the increased respiration is related to changes in swimming behavior, which is consistent with previous findings of swimming activity increasing only in the presence of a stimuli.
The OCRs observed on the 12th DPH is consistent with decreased OCR during starvation (Fields et al., 2015). Adopting a low energy strategy could extend the lice’s infective window. Further investigation into this low energy state, as it relates to temperature and host detection, is warranted. L. salmonis would provide a useful ecological model for understanding the parasite-host relationship under conditions of stress, and the resulting parameterization would improve forecasts of infection risk.
Effects of elevated pCO2
Obligate lecithotrophy provides a unique opportunity to investigate changes in metabolism in response to environmental stressors. Without the ability to compensate for increased metabolic cost through increased ingestion, directly measuring changes in the consumption rate of energy stores provides a direct comparison of metabolic cost under different environmental conditions. In this study we found that end of the century pCO2
concentrations produced no effect on growth in the planktonic stages of L. salmonis after 12 DPH. While nitrogen content in the Mid treatment was significantly different from the control, the High treatment was not, and there were no other treatment effects in any of the other biological endpoints including carbon, lipid volume, and FA content. However, our data did show a non-linear response to pCO2in the metabolic rates of salmon lice
with OCR increasing in the High treatment. Interestingly, metabolic compensation did not occur through lower mitochondrial activity in the swimming appendages as measured by MMP. In another experiment in which this method of measuring mitochondrial activity was used, sea urchin sperm under elevated pCO2responded to the treatment with lower
measuring MMP provides a high-resolution method of documenting the metabolic status of the swimming arm, further investigation is needed to determine if swimming behavior or host settlement success is affected by elevated pCO2.
CONCLUSION
The lack of a clear linear effect on the salmon louse (L. salmonis) from elevated pCO2is
consistent with other studies on copepods.Runge et al. (2016)concluded that predicted end of the century pCO2concentrations have limited effects on copepods. However, in that
study and others the animals can compensate for the added metabolic cost associated with elevated pCO2by consuming more.Bailey et al. (2016)considered this mechanism as an
explanation for the lack of treatment effects on Calanus glacialis exposed to elevated pCO2,
but they rejected it while noting that no effect was observed in the non-feeding naupliar stages. Likewise, the animals here are non-feeding and despite the increased metabolic cost of elevated pCO2as observed by increased OCR, there was no observable metabolic
consequence. Together, these results suggest that these parasitic copepods are able to compensate for the elevated metabolism or that the metabolic cost is extremely small and inconsequential to the development and survival of the copepod.
As an ectoparasite on a highly migratory anadromous fish (Salmo salar), the salmon louse and its host have evolved to handle diverse environments. Coastal habitats are often characterized by relatively low pH with carbonate chemistry strongly influenced by upwelling, eutrophication, and river discharge (Feely et al., 2010;Wallace et al., 2014;
Salisbury et al., 2008). Salmon lice will inevitably experience a variable environment that features pH regimes far below that predicted from OA. Considering the tolerance of L.
salmonisto elevated pCO2demonstrated here, and their adaptability documented elsewhere
(e.g.,Aaen et al., 2015;Mennerat et al., 2017;Ljungfeldt et al., 2017), we should expect them to readily adapt to future OA scenarios.
Despite the ubiquity of parasites and their impact on the ecosystem there is a notable lack of investigative work into host-parasite interactions under conditions predicted by OA (MacLeod, 2016). The arms-race between host and parasite could easily be perturbed by a differential response to elevated pCO2in the parasite and host. Further work is needed to
understand this fundamental ecological relationship, and the salmon louse Lepeophtheirus
salmonisrepresents a readily available model organism.
ACKNOWLEDGEMENTS
Access to, and technical assistance with, confocal microscopy with living animals was generously provided by Hege Avsnes Dale, Sergei Baryschnikov, and Clive Bramham from the University of Bergen, Norway.
ADDITIONAL INFORMATION AND DECLARATIONS
Funding
This research was supported by the Institute of Marine Research, Norway and the Fram Centre, Norway Project # 14591-02 and by the Institute of Marine Research, Norway Project # 81529 to Howard Browman. David Fields also received support from NSF award OCE-1220068. Jeffrey A. Runge and Cameron R.S. Thompson were additionally supported by the National Science Foundation award OCE-1041081. The funders had no role in study design, data collection and analysis, decision to publish, or preparation of the manuscript.
Grant Disclosures
The following grant information was disclosed by the authors:
Institute of Marine Research, Norway and the Fram Centre: 14591-02. Institute of Marine Research, Norway: 81529.
NSF awards: OCE-1220068, OCE-1041081.
Competing Interests
The authors declare there are no competing interests.
Author Contributions
• Cameron R.S. Thompson, Vera B.S. Chan and Caroline M.F. Durif conceived and designed the experiments, performed the experiments, analyzed the data, prepared figures and/or tables, authored or reviewed drafts of the paper, approved the final draft. • David M. Fields, Reidun M. Bjelland, Andrew Mount, Jeffrey A. Runge, Steven D. Shema, Anne Berit Skiftesvik and Howard I. Browman conceived and designed the experiments, performed the experiments, analyzed the data, authored or reviewed drafts of the paper, approved the final draft.
Data Availability
The following information was supplied regarding data availability: Raw data is available in the Supplemental File and at Zenodo:
Thompson, Cameron RS, Fields, David M, Bjelland, Reidun M, Chan, Vera BS, Durif, Caroline MF, Mount, Andrew, . . . Browman, Howard. (2019). The planktonic stages of the salmon louse (Lepeophtheirus salmonis) are tolerant of end-of-century pCO2 concentrations [Data set]. PeerJ. Zenodo.http://doi.org/10.5281/zenodo.3406147.
REFERENCES
Aaen SM, Helgesen KO, Bakke MJ, Kaur K, Horsberg TE. 2015. Drug resistance in
sea lice: a threat to salmonid aquaculture. Trends in Parasitology 31(2):72–81
DOI 10.1016/j.pt.2014.12.006.
Asplin L, Boxaspen KK, Sandvik AD. 2011. Modeling the distribution and abundance
of planktonic larval stages of Lepeophtheirus salmonis. In: Smith J, Beamish R, eds.
Salmon Lice: an integrated approach to understanding parasite abundance and distribu-tion. West Sussex: John Wiley & Sons Ltd, 29–50DOI 10.1002/9780470961568.ch1.
Asplin L, Johnsen IA, Sandvik AD, Albretsen J, Sundfjord V, Aure J, Boxaspen KK. 2014. Dispersion of salmon lice in the Hardangerfjord. Marine Biology Research 10(3):216–225DOI 10.1080/17451000.2013.810755.
Bailey A, Thor P, Browman HI, Fields DM, Runge J, Vermont A, Bjelland R, Thompson C, Shema S, Durif CMF, Hop H. 2016. Early life stages of the Arctic copepod
Calanus glacialisare unaffected by increased seawater pCO2. ICES Journal of Marine
Science74(4):996–1004DOI 10.1093/icesjms/fsw066.
Brooker AJ, Skern-Mauritzen R, Bron JE. 2018. Production, mortality, and infectivity of
planktonic larval sea lice, Lepeophtheirus salmonis (Krøyer, 1837): current knowledge and implications for epidemiological modelling. ICES Journal of Marine Science
75(4):1214–1234 DOI 10.1093/icesjms/fsy015.
Caldeira K, Wickett ME. 2003. Anthropogenic carbon and ocean pH. Nature 425(6956):365–365DOI 10.1038/425365a.
Costello MJ. 2009. How sea lice from salmon farms may cause wild salmonid
declines in Europe and North America and be a threat to fishes elsewhere.
Proceedings of the Royal Society B: Biological Sciences276(1672):3385–3394
DOI 10.1098/rspb.2009.0771.
Dickson AG, Sabine CL, Christian JR. 2007. Guide to best practices for ocean CO2
measurements. Vol. 3. Sidney: PICES Special Publication.
Dupont S, Dorey N, Thorndyke M. 2010. What meta-analysis can tell us about
vul-nerability of marine biodiversity to ocean acidification? Estuarine Coastal and Shelf
Science89(2):182–185DOI 10.1016/j.ecss.2010.06.013.
Dupont S, Pörtner H. 2013. Get ready for ocean acidification. Nature 498:429–429
DOI 10.1038/498429a.
Eichner C, Hamre LA, Nilsen F. 2015. Instar growth and molt increments in
Lepeoph-theirus salmonis(Copepoda: Caligidae) chalimus larvae. Parasitology International
64(1):86–96DOI 10.1016/j.parint.2014.10.006.
Fabry VJ, Seibel BA, Feely RA, Orr JC. 2008. Impacts of ocean acidification on marine
fauna and ecosystem processes. ICES Journal of Marine Science 65(3):414–432
DOI 10.1093/icesjms/fsn048.
Feely RA, Alin SR, Newton J, Sabine CL, Warner M, Devol A, Krembs C, Maloy C. 2010.
The combined effects of ocean acidification, mixing, and respiration on pH and carbonate saturation in an urbanized estuary. Estuarine Coastal and Shelf Science
88:442–449DOI 10.1016/j.ecss.2010.05.004.
Fields DM, Runge JA, Thompson C, Shema SD, Bjelland RM, Durif CMF, Skiftesvik AB, Browman HI. 2015. Infection of the planktonic copepod Calanus finmarchicus
by the parasitic dinoflagellate, Blastodinium spp.: effects on grazing, respiration, fecundity, and fecal pellet production. Journal of Plankton Research 37(1):211–220
DOI 10.1093/plankt/fbu084.
Fields DM, Skiftesvik AB, Browman HI. 2017. Behavioural responses of
infective-stage copepodids of the salmon louse (Lepeophtheirus salmonis, Copepoda: Caligidae) to host-related sensory cues. Journal of Fish Diseases 41(6):875–884
Figueiredo J, Narciso L, Anto J, Penha-Lopes G, Lin J. 2008. Potential Fertility and Egg
Development (Volume, Water, Lipid, and Fatty Acid Content) through Embryogen-esis of Uca Rapax (Decapoda: Brachyura: Ocypodidae). Journal of Crustacean Biology
28(3):528–533DOI 10.1651/07-2937r.1.
Garrard SL, Hunter RC, Frommel AY, Lane AC, Phillips JC, Cooper R, Dineshram R, Cardini U, McCoy SJ, Arnberg M, Rodrigues Alves BG, Annane S, De Orte MR, Kumar A, Aguirre-Martínez GV, Maneja RH, Basallote MD, Ape F, Torstensson A, Bjoerk MM. 2012. Biological impacts of ocean acidification: a
postgraduate perspective on research priorities. Marine Biology 160(8):1789–1805
DOI 10.1007/s00227-012-2033-3.
Gaylord B, Hill TM, Sanford E, Lenz EA, Jacobs LA, Sato KN, Russell AD, Hettinger A. 2011. Functional impacts of ocean acidification in an ecologically critical foundation
species. Journal of Experimental Biology 214(15):2586–2594 DOI 10.1242/jeb.055939.
Hamre LA, Eichner C, Caipang CMA, Dalvin ST, Bron JE, Nilsen F, Skern-Mauritzen R. 2013. The Salmon Louse Lepeophtheirus salmonis (Copepoda: Caligidae) life cycle
has only two chalimus stages. PLOS ONE 8(9):e73539
DOI 10.1371/journal.pone.0073539.
Igboeli OO, Burka JF, Fast MD. 2014. Lepeophtheirus salmonis: a persisting challenge for
salmon aquaculture. Animal Frontiers 4(1):22–32DOI 10.2527/af.2014-0004.
Jacobsen A, Grahl-Nielsen O, Magnesen T. 2012. Effects of reduced diameter of
bag cultures on content of essential fatty acids and cell density in a contin-uous algal production system. Journal of Applied Phycology 24(1):109–116
DOI 10.1007/s10811-011-9655-6.
Johnsen A, Fiksen Ø, Sandvik AD, Asplin L. 2014. Vertical salmon lice behaviour
as a response to environmental conditions and its influence on regional dis-persion in a fjord system. Aquaculture Environment Interactions 5(2):127–141
DOI 10.3354/aei00098.
Kattner G, Hagen W. 2009. Lipids in marine copepods: latitudinal characteristics and
perspective to global warming. In: Lipids in aquatic ecosystems. New York: Springer, 257–280DOI 10.1007/978-0-387-89366-2_11.
Krkosek M, Ford JS, Morton A, Lele S, Myers RA, Lewis MA. 2007. Declining
wild salmon populations in relation to parasites from farm salmon. Science
318(5857):1772–1775DOI 10.1126/science.1148744.
Krkosek M, Lewis MA, Volpe JP. 2005. Transmission dynamics of parasitic sea lice
from farm to wild salmon. Proceedings of the Royal Society B: Biological Sciences
272(1564):689–696DOI 10.1098/rspb.2004.3027.
Krkosek M, Revie CW, Gargan PG, Skilbrei OT, Finstad B, Todd CD. 2012. Impact
of parasites on salmon recruitment in the Northeast Atlantic Ocean.
Proceed-ings of the Royal Society B: Biological Sciences280(1750):20122359–20122359
DOI 10.1098/rspb.2012.2359.
Kroeker KJ, Kordas RL, Crim RN, Singh GG. 2010. Meta-analysis reveals negative
yet variable effects of ocean acidification on marine organisms. Ecology Letters
Li S, Cheng Y, Zhou B, Hines AH. 2012. Changes in biochemical composition of
newly spawned eggs, prehatching embryos and newly hatched larvae of the Blue Crab Callinectes sapidus. Journal of Shellfish Research 31(4):941–946
DOI 10.2983/035.031.0405.
Liu Y, Bjelland H. 2014. Estimating costs of sea lice control strategy in Norway.
Preventa-tive Veterinary Medicine117(3–4):469–477DOI 10.1016/j.prevetmed.2014.08.018.
Ljungfeldt LER, Quintela M, Besnier F, Nilsen F, Glover KA. 2017. A pedigree-based
experiment reveals variation in salinity and thermal tolerance in the salmon louse, Lepeophtheirus salmonis. Evolutionary Applications 10(10):1007–1019
DOI 10.1111/eva.12505.
MacLeod CD. 2016. Parasitic infection: a missing piece of the ocean acidification puzzle.
ICES Journal of Marine Science74(4):929–933DOI 10.1093/icesjms/fsw156.
McMaster G, Wilhelm WW. 1997. Growing degree-days: one equation, two
interpreta-tions. Agricultural and Forest Meteorology 87(4):291–300
DOI 10.1016/s0168-1923(97)00027-0.
Meier S, Mjøs SA, Joensen H, Grahl-Nielsen O. 2006. Validation of a one-step
extraction/methylation method for determination of fatty acids and choles-terol in marine tissues. Journal of Chromatography A 1104(1–2):291–298
DOI 10.1016/j.chroma.2005.11.045.
Mennerat A, Ugelvik MS, Håkonsrud JC, Skorping A. 2017. Invest more and die
faster: the life history of a parasite on intensive farms. Evolutionary Applications
10(9):890–896DOI 10.1111/eva.12488.
Mordue AJ, Birkett MA. 2009. A review of host finding behaviour in the parasitic sea
louse, Lepeophtheirus salmonis (Caligidae: Copepoda). Journal of Fish Diseases
32(1):3–13DOI 10.1111/j.1365-2761.2008.01004.x.
Pan TCF, Applebaum SL, Manahan DT. 2015. Experimental ocean acidification alters
the allocation of metabolic energy. Proceedings of the National Academy of Sciences of
the United States of America112(15):4696–4701 DOI 10.1073/pnas.1416967112.
Park S, Chun S, Kim D. 2013. Cold exposure lowers energy expenditure at the cellular
level. Cell Biology International 37(6):638–642DOI 10.1002/cbin.10086.
R Core Team. 2018. R: a language and environment for statistical computing. Austria: R
Foundation for Statistical Computing.
Ramajo L, Pérez-León E, Hendriks IE, Marbà N, Krause-Jensen D, Sejr MK, Blicher ME, Lagos NA, Olsen YS, Duarte CM. 2016. Food supply confers calcifiers resistance
to ocean acidification. Scientific Reports 6:19374DOI 10.1038/srep19374.
Riebesell U, Fabry VJ, Hansson L, Gattuso J-P. 2010. Guide to best practices for ocean
acidification research. Belgium: Publications Office of the European Union.
Runge JA, Fields DM, Thompson CRS, Shema SD, Bjelland RM, Durif CMF, Skiftesvik AB, Browman HI. 2016. End of the century CO2concentrations do not have
a negative effect on vital rates of Calanus finmarchicus, an ecologically critical planktonic species in North Atlantic ecosystems. ICES Journal of Marine Science
Salisbury JE, Vandemark D, Hunt CW, Campbell JW, McGillis WR, McDow-ell WH. 2008. Seasonal observations of surface waters in two Gulf of Maine
estuary-plume systems: relationships between watershed attributes, optical mea-surements and surface pCO2. Estuarine Coastal and Shelf Science 77:245–252 DOI 10.1016/j.ecss.2007.09.033.
Samsing F, Oppedal F, Dalvin S, Johnsen I, Vågseth T, Dempster T. 2016. Salmon lice
(Lepeophtheirus salmonis) development times, body size, and reproductive outputs follow universal models of temperature dependence. Canadian Journal of Fisheries
and Aquatic Sciences73(12):1841–1851DOI 10.1139/cjfas-2016-0050.
Schlegel P, Binet MT, Havenhand JN, Doyle CJ, Williamson WE. 2015. Ocean
acidifica-tion impacts on sperm mitochondrial membrane potential bring sperm swimming behaviour near its tipping point. Journal of Experimental Biology 218:1084–1090
DOI 10.1242/jeb.114900.
Thorstad EB, Todd CD, Uglem I, Bjørn PA, Gargan PG, Vollset KW, Halttunen E, Kålås S, Berg M, Finstad B. 2015. Effects of salmon lice Lepeophtheirus salmonis
on wild sea trout Salmo trutta—a literature review. Aquaculture Environment
Interactions7(2):91–113DOI 10.3354/aei00142.
Tocher JA, Dick JR, Bron JE, Shinn AP, Tocher DR. 2010. Lipid and fatty acid
com-position of parasitic caligid copepods belonging to the genus Lepeophtheirus.
Comparative Biochemistry and Physiology Part B: Biochemistry and Molecular Biology
156(2):107–114DOI 10.1016/j.cbpb.2010.02.010.
Torrissen O, Jones S, Asche F, Guttormsen A, Skilbrei OT, Nilsen F, Horsberg TE, Jackson D. 2013. Salmon lice—impact on wild salmonids and salmon aquaculture.
Journal of Fish Diseases36(3):171–194DOI 10.1111/jfd.12061.
Tucker CS, Sommerville C, Wootten R. 2000. An investigation into the larval energetics
and settlement of the sea louse, Lepeophtheirus salmonis, an ectoparasitic copepod of Atlantic salmon, Salmo salar. Fish Pathology 35(3):137–143DOI 10.3147/jsfp.35.137.
Vollset KW, Dohoo I, Karlsen Ø, Halttunen E, Kvamme BO, Finstad B, Wennevik V, Diserud OH, Bateman A, Friedlan KD. 2017. Disentangling the role of sea lice on
the marine survival of Atlantic salmon. ICES Journal of Marine Science 75(1):50–60
DOI 10.1093/icesjms/fsx104.
Wallace RB, Baumann H, Grear JS, Aller RC, Gobler CJ. 2014. Coastal ocean
acidifica-tion: the other eutrophication problem. Estuarine Coastal and Shelf Science 148:1–13
DOI 10.1016/j.ecss.2014.05.027.
Werbrouck E, Van Gansbeke D, Vanreusel A, De Troch M. 2016. Temperature
Affects the Use of Storage Fatty Acids as Energy Source in a Benthic Cope-pod (Platychelipus littoralis, Harpacticoida). PLOS ONE 11(3):e0151779
DOI 10.1371/journal.pone.0151779.
Whiteley N. 2011. Physiological and ecological responses of crustaceans to ocean
acidification. Marine Ecology Progress Series 430:257–271DOI 10.3354/meps09185.
Wittmann AC, Pörtner HO. 2013. Sensitivities of extant animal taxa to ocean
Wood S. 2015. mgcv: mixed GAM computation vehicle with GCV/AIC/REML
smooth-ness estimation. Available athttps:// cran.r-project.org/ web/ packages/ mgcv/ index.html (accessed on 1 September 2017).