HAL Id: hal-03191084
https://hal.archives-ouvertes.fr/hal-03191084
Submitted on 6 Apr 2021HAL is a multi-disciplinary open access archive for the deposit and dissemination of sci-entific research documents, whether they are pub-lished or not. The documents may come from teaching and research institutions in France or abroad, or from public or private research centers.
L’archive ouverte pluridisciplinaire HAL, est destinée au dépôt et à la diffusion de documents scientifiques de niveau recherche, publiés ou non, émanant des établissements d’enseignement et de recherche français ou étrangers, des laboratoires publics ou privés.
Quantitative monitoring of galactolipid hydrolysis by
pancreatic lipase-related protein 2 using thin layer
chromatography and thymol-sulfuric acid derivatization
Moulay Sahaka, Sawsan Amara, Jérôme Lecomte, Jean-David Rodier,
Dominique Lafont, Pierre Villeneuve, Brigitte Gontero, Frédéric Carrière
To cite this version:
Moulay Sahaka, Sawsan Amara, Jérôme Lecomte, Jean-David Rodier, Dominique Lafont, et al.. Quan-titative monitoring of galactolipid hydrolysis by pancreatic lipase-related protein 2 using thin layer chromatography and thymol-sulfuric acid derivatization. Journal of Chromatography B Biomedical Sciences and Applications, Elsevier, 2021, 1173, pp.122674. �10.1016/j.jchromb.2021.122674�. �hal-03191084�
Preprint of DOI: 10.1016/j.jchromb.2021.122674
published in Journal of Chromatography B (2021)1173:122674
Quantitative monitoring of galactolipid hydrolysis by pancreatic lipase-related protein 2
using thin layer chromatography and thymol-sulfuric acid derivatization
Moulay Sahakaa, Sawsan Amarab, Jérôme Lecomtec, Jean-David Rodierd, Dominique Lafonte, Pierre Villeneuvec, Brigitte Gonteroa, and Frédéric Carrièrea*
a Aix Marseille Univ, CNRS, UMR7281 Bioénergétique et Ingénierie des Protéines, 31
Chemin Joseph Aiguier, 13009 Marseille, France.
b Lipolytech, Zone Luminy Biotech, 163 avenue de Luminy, 13288 Marseille Cedex 09,
France.
c CIRAD, UMR IATE, F-34398 Montpellier, France
d Gattefossé SAS, 36 chemin de Genas, 69804 Saint-Priest, France
e Laboratoire de Chimie Organique 2-GLYCO, ICBMS UMR 5246, CNRS-Université Claude
Bernard Lyon 1, Université de Lyon, bâtiment Lederer, 1 rue Victor Grignard, 69622 Villeurbanne Cedex, France
*Corresponding author: Frédéric Carrière, PhD ; email : carriere@imm.cnrs.fr
Abbreviations : C8-MGDG monogalactosyl dioctanoylglycerol; DGDG, digalactosyl diacylglycerol; DGG, digalactosyl glycerol; DGMG, digalactosyl monoacylglycerol; MGDG, monogalactosyl diacylglycerol; MGG, monogalactosyl glycerol; MGMG,
Abstract
Galactolipids are the most abundant lipids on earth where they are mainly found in photosynthetic membranes of plant, algae, and cyanobacteria. Pancreatic lipase-related protein 2 (PLRP2) is an enzyme with galactolipase activity allowing mammals, especially herbivores, to digest this important source of fatty acids. We present a method for the quantitative analysis of galactolipids and galactosylated products resulting from their digestion by guinea pig PLRP2 (GPLRP2), using thin-layer-chromatography (TLC), thymol-sulfuric acid as derivatization reagent and scanning densitometry for detection. Thymol-sulfuric acid reagent has been used for the colorimetric detection of carbohydrates. It is shown here that the derivatization of galactosyl group from galactolipids by this reagent is not affected by the bound acyl glycerol, acyl chains length and number of galactose residues in the polar head. This allowed quantifying simultaneously the initial substrate and all galactosylated products generated upon the hydrolysis of monogalactosyl di-octanoylglycerol (C8-MGDG) by GPLRP2 using a single calibration with C8-MGDG as reference standard. The reaction products, monogalactosyl monooctanoyl glycerol (C8-MGMG) and monogalactosyl glycerol (MGG), were identified and quantified, MGG being recovered from the aqueous and analyzed by a separate TLC analysis. This method is therefore suitable to quantify the products resulting from the release of both fatty acids present in MGDG and thereby shows that PLRP2 can contribute to the complete digestion of galactolipids and further intestinal absorption of their fatty acids.
Keywords: Carbohydrate; Dietary lipids; Digestion; galactolipase; Glycolipids; gastrointestinal lipolysis;
1. Introduction
Galactolipids are the most abundant lipids on earth, where they are mainly found in thylakoid membranes of plant, algae, and cyanobacteria chloroplasts [1-4]. They represent an important source of fatty acids for herbivores [5] and are the main source in Nature of the essential α-linolenic acid [6]. They also have several potential applications in pharmaceutical [7-9] and food industries [10-13]. For some applications such as in nutrition, galactolipids in their native form are sufficient, but for other applications like biofuels and surfactants, it would be necessary to transform them via acyl transfer reactions using chemical or lipase-based catalysis [14, 15]. Here, we present a method for the qualitative and quantitative analysis of galactolipids and their galactosylated degradation products, using Thin-Layer-Chromatography (TLC) coupled to scanning densitometry.
Typically, lipid quantification by TLC comprises four steps: spotting samples on silica plate, separation by elution with a suitable solvent, revealing lipid spots or bands by derivatization and finally quantification by scanning densitometry at an appropriate wavelength. Many non-specific reagents can reveal a wide range of lipids simultaneously. Among the most used and well-known methods, one can cite sulphuric acid treatment [16-19], sulphuric acid and potassium dichromate treatment [16, 20, 21], phosphoric acid and copper acetate treatment [18, 22], and iodine vapor treatment [16, 23-25]. These reagents cause cleavage, oxidation or dehydration reactions on acyl chains and produce brown to black spots of elemental carbon. The main weakness of these methods is their lack of sensitivity to saturated lipids. However, concerning polar lipids like phospholipids and galactolipids, one can use reagents that target their polar head irrespective of the degree of unsaturation of their acyl chains. Phosphorus reagents such as molybdenum blue are for instance widely used for
the detection of phospholipids on TLC plates [26]. Similarly, it is possible to detect galactolipids based on the reactivity of their galactosyl groups.
The thymol-sulphuric acid reagent, developed by Hans Molisch in 1886, was initially used for the detection of carbohydrates. Molisch reported that a sugar solution turns carmine red when mixed with a solution of thymol with 15-20% alcohol and excess sulphuric acid. He also reported that the mixture turns purple when α-naphthol is used instead of thymol [27]. In 1888, Udranszky showed that furfuraldehyde reacts with the thymol-sulphuric acid reagent in the same way as sugars. He concluded that in the sugar detection, the coloured compound formation does not directly involve sugar but rather furfuraldehyde resulting from the dehydration of sugar by sulphuric acid and cyclization [28]. In 1954, Schmor performed the first quantitative analysis of glucose in blood samples using the thymol-sulfuric reagent and photometer. Schmor's objective was to find an alternative to anthrone reagent because the latter cannot be kept for more than one day due to a darkening phenomenon. He reported that the thymol-sulfuric acid reagent could be stored and used for several months [29]. In 1965, Sumu Adachi adapted it for the first time to TLC in order to perform a qualitative analysis of sugars in dairy products [30]. In 1970, Bukharov and Karneeva also adapted the reagent to TLC and used scanning densitometry to make it both a qualitative and quantitative method for sugar analysis [31]. Later, this reagent started to be used for the analysis of glycosylated molecules. For instance, in 1979, Racusen adapted it for the detection of glycoproteins separated by electrophoresis in acrylamide gel [32]. In 1999, Kim et al. used the thymol-sulfuric acid reagent for the qualitative analysis of yeast glycolipids separated by TLC [33].
Several other reagents composed of thymol-like chromogens and excess acid were also used for the detection of carbohydrates. As examples of these chromogens we can cite cholic acid [34], resorcinol [35], naphthoresorcinol [36], benzidine [37], anthrone [38], and phenol [39]. The mechanism of action common to all these reagents can be separated into three
steps. Firstly, osidic bonds are hydrolysed by the excess acid, particularly in the case of glycosylated molecules detection. Secondly, the released sugars are dehydrated and cyclized into furfural derivatives by acid catalysis [32, 40]. Thirdly, the furfural derivatives are condensed with the chromogenic reagent, typically a phenolic compound, to give a three ring derivative (Figure 1) [41].
Pancreatic lipase-related protein 2 (PLRP2) is an enzyme expressed in the pancreas of several mammals such as mouse [42], human [43], guinea pig [44], rat [45], and coypu [46]. Its peculiarity compared to other pancreatic lipases is its combination of lipase, phospholipase A1 and galactolipase activities [47]. Among various physiological roles, one is to digest plant membrane lipids, mainly composed of galactolipids [6]. Most studies on the characterization of PLRP2 galactolipase activity were based on the analysis of the fatty acids released from galactolipids by the enzyme, but very few of these studies also examined other products released upon galactolipid hydrolysis. In 1996, Anderson et al. studied the in vitro digestion of tritium-labelled galactolipids ([3H]-labelled fatty acids or galactose) by recombinant rat and guinea pig PLRP2s. Using TLC and radioactivity detection, they observed and quantified substrate consumption and production of free fatty acid, lyso-galactolipid and of a water-soluble compound [48]. In 2000, Sugawara and Miyazawa investigated digestion of MGDG and DGDG in the rat alimentary canal. Using HPLC combined with ELSD detector, they identified among the reaction products lysogalactolipids and two products corresponding to the full deacylation of galactolipids, mobogalactosyl glycerol (MGG) and digalactosyl glycerol (DGG)[49]. In 2010, Amara et al analyzed the action of recombinant human guinea pig PLRP2s on purified spinach leaf galactolipids using TLC and Fewster's copper acetate detection. They observed the consumption of galactolipids and the accumulation of lyso-galactolipids and free fatty acids [50].
Here we investigated the use of thymol-sulfuric acid derivatization for the qualitative and quantitative analysis by TLC of galactolipids and galactosylated products resulting from their degradation. In a first part, we studied the influence of glycerol moiety, acyl chain length and number of galactose residues on the derivatization of galactolipid galactose residues by the thymol-sulfuric acid reagent. For this, we compared the detection by scanning densitometry of free galactose and galactolipids with different acyl chain lengths and polar head. In a second part, we used this detection method for the analysis of galactosylated products resulting from the hydrolysis of monogalactosyl di-octanoylglycerol (C8-MGDG) by PLRP2. Finally, we also used it to analyze natural galactolipids from spinach. This allowed validating a quantitative but non selective method for galactolipids and products resulting from their deacylation.
2. Materials and methods
2.1. Reagents
Galactolipids standards, monogalactosyl di-octanoylglycerol (C8-MGDG; Mw=506
g/mole), monogalactosyl palmitoylglycerol (C16-MGDG), and digalactosyl di-octanoylglycerol (C8-DGDG), were synthesized as previously described [51-53]. Sodium taurodeoxycholate (NaTDC), Thymol, galactose, sulphuric acid and N-tris[hydroxymethyl]methyl-2-aminoethane-sulfonic acid (TES) were purchased from Sigma-Aldrich (Saint-Quentin Fallavier, France). Calcium chloride (CaCl2) and sodium chloride
(NaCl) were obtained from Euromedex (Souffelweyersheim France). Acetonitrile, chloroform, ethanol and methanol were all HPLC grade from Carlo Erba (Peypin, France).
2.2. Production and purification of rGPLRP2
Recombinant guinea pig PLRP2 (rGPLRP2) was produced in Aspergillus orizae and purified as previously described [44].
2.3. Preparation of the thymol-sulfuric acid reagent
One gram of thymol was dissolved in 190 mL of ethanol. Ten millilitres of 96% sulfuric acid were then added gradually. The reaction being exothermic, the operation was carried out in a cold water bath.
2.4. Standards preparation
Galactolipid standards were solubilized in chloroform:methanol mixture (2/1 v:v) and free galactose standard in water:ethanol mixture (1/5 v/v) before being applied on TLC plates.
2.5. Preparation of MGDG-bile salt micelles
Monogalactosyldioctanoylglycerol (C8-MGDG) was used to form mixed micelles with NaTDC. It was added in a buffer solution containing 65 mM NaTDC, 450 mM TES, 100 mM NaCl and 5 mM CaCl2 and then dispersed using vortex followed by ultrasonic treatment
for 8 min in a water bath at room temperature. NaTDC to C8-MGDG molar ratio was 1.33. The high buffer concentration (450 mM TES) was selected from another study in order to limit pH variations due to the release of octanoic acid during the reaction (data not shown).
2.6. MGDG lipolysis
Lipolysis reactions were carried out by adding rGPLRP2 to the C8-MGDG-NaTDC micelles solution to obtain 50 nM enzyme concentration, at pH 8 and 37 °C. The total reaction volume was 200 µL. Aliquots of 25µL were collected at different reaction times and immediately mixed with 1 mL of a stop solution containing 200 mM HCl and 150 mM NaCl.
2.7. Extraction of reaction products
To extract the reaction products and residual substrate, 1.35 mL of chloroform:methanol mixture (2/1, v/v) was added to all stopped aliquots, mixed and shaken
vigorously using vortex and the organic and aqueous phases were separated by centrifugation using a Sigma 3-18K centrifuge (1 min at 1,000g). Both phases were separated in different tubes and kept at −20 °C until the TLC analysis was performed.
2.8. TLC-densitometry analysis
The organic and aqueous phases were spotted on separate TLC silica gel 60 glass plates (10 × 20 cm; from Merck, Saint-Quentin Fallavier, France; reference MC1056260001) using a Linomat IV sample spotter (Camag, Muttenz, Switzerland) equipped with a 100 µL Hamilton syringe. Besides the samples, six quantities (0.4, 0.8, 1.6, 3.2, 4.8 and 6.4 nmoles; or 0.2, 0.4, 0.8, 1.6, 2.5 and 3.3 µg) of C8-MGDG were also spotted on each plate for calibration. The elutions were then performed with chloroform/methanol/water (25/15/1.25, v/v/v) for organic phase samples and acetonitrile/water (8/15, v/v) for aqueous phase samples, respectively.
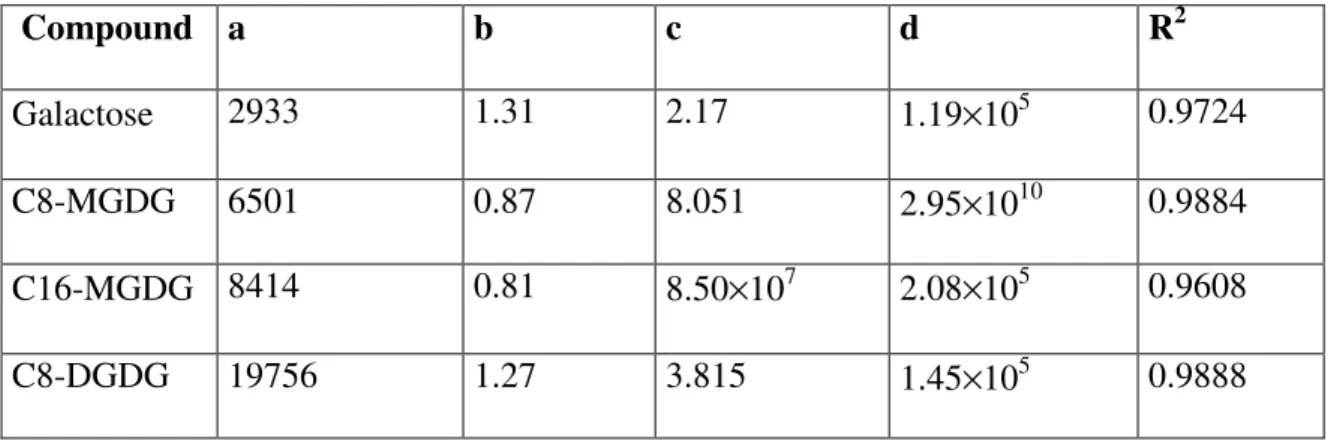
After elution, the plates were dried at room temperature, under fume hood. They were then dipped in the thymol-sulfuric acid reagent using a Chromatogram Immersion Device 3 (Camag, Muttenz, Switzerland), dried at room temperature and placed in oven at 100°C for 10 minutes. Absorbances of revealed spots and bands were measured at both 510 and 366 nm using a Camag TLC Scanner II (Camag, Muttenz, Switzerland) coupled to a D2000+ Chromato-Integrator (Merck). The quantification was carried out using a C8-MGDG calibration curve established from standards spotted on each plate. All calibration curves describing the changes in optical density as a function of the amounts C8-MGDG, galactose, C16-MGDG or C8-DGDG were obtained from data point curve-fitting using a four-parameter logistic regression available on GraphPad's Prism software program (San Diego, USA). The corresponding equation and parameters for each compound are indicated in Table 1.
2.9. Statistical Analysis
Results are shown as mean values ± standard deviation. Replicate number is ≥3 for all data analyzed. Groups of data were compared by a one-way analysis of variance (ANOVA; Microsoft Office Excel Professional Plus 2016) and specific differences between groups were statistically analyzed by Student t-test (t-test; Microsoft Office Excel Professional Plus 2016). Differences were considered significant at p≤0.05
3. Results and discussion
3.1. Choice of wavelength for analysis by scanning densitometry
Absorbance measurements at a wavelength of 510 nm were initially chosen because it corresponds to the maximum absorption of thymol-derivatized galactose [54]. However, we also tested whether absorbance at 366 nm, a wavelength commonly used for other types of staining, could be used for quantifying thymol-derivatized galactolipids.
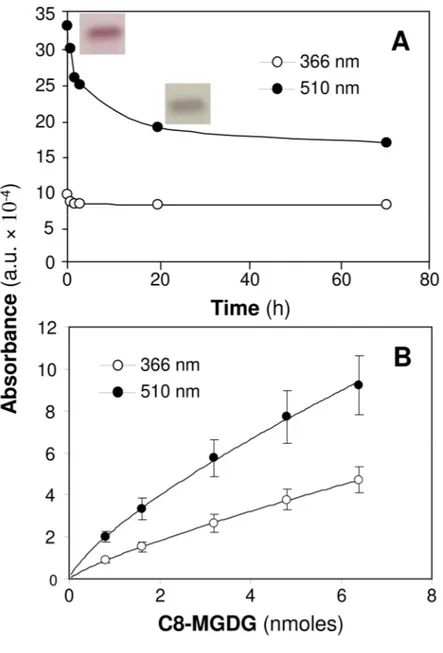
The TLC separation of C8-MGDG and its derivatization by thymol was chosen as a model system to compare the two wavelengths. As shown in Figure 2A, absorbance at 510 nm was about 3.5 times higher than the absorbance at 366 nm, right after drying and staining the TLC plate (t=0). Absorbance at 510 nm then appeared to be unstable with time and decreased gradually with 10% loss of its intensity after 40 min, and 50% after 72 hr. Absorbance at 366 nm was lower but more stable. Indeed, its intensity decreased by 15% after 2 h 40 min but then remained constant until 72h at least. After stabilization of the absorbances, the intensity at 510 nm was about 2.1 times higher than the intensity at 366 nm. The color of the band also changed with time from red to gray color. Calibration curves for C8-MGDG could be established at both wavelengths (Figure 2B), showing the higher sensitivity of measurements at 510 nm.
However, when analyzing natural lipid extracts from plant leaves, measurements of absorbances at 366 nm had the advantage of reducing the interference of colored compounds present in lipid extract on galactolipid detection, as shown by the densitograms obtained at 366 and 510 nm (Figure 3). Previous TLC analysis of lipid extracts from plant leaves containing galactolipids and photosynthetic pigments have shown that some carotenoids, absorbing light maximally between 460 nm and 550 nm, are migrating close to MGDG [12]. One can assume that absorbance measurements at 366 nm allow reducing the detection of these compounds.
Another advantage of using 366 versus 510 nm was also noticed when we analyzed the lipolysis products of C8-MGDG that are soluble in water (see next section and Figure 5B).
When hydrolysis of C8-MGDG was performed in the presence of bile salts (NaTDC), the lysogalactolipid C8-MGMG was found to migrate very close to NaTDC. In the densitogram/chromatogram obtained at 510 nm (Figure 5C), the detected peaks of NaTDC and C8-MGMG overlapped, making the integration of C8-MGMG peak less accurate. The analysis at 366 nm allowed removing NaTDC detection and peak while preserving the absorbance of C8-MGMG. Since our present and future objectives were to analyze the hydrolysis of galactolipids from various sources in the presence of bile salts, we have chosen the wavelength of 366 nm for all quantitative analysis of galactolipids. The stability of absorbance at this wavelength also allows a better repeatability of measurements.
3.2. Influence of acyl chains length and galactose residue number on quantification with thymol-sulfuric acid reagent
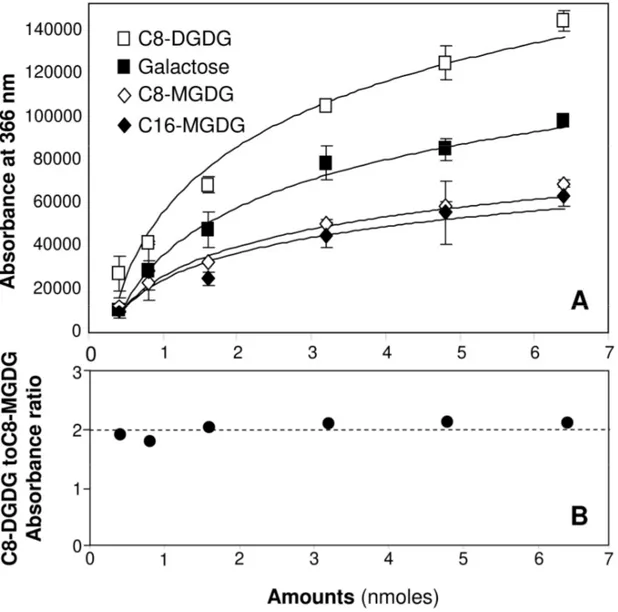
The derivatization of free galactose, C8-MGDG, C16-MGDG and C8-DGDG by the thymol-sulfuric acid reagent were compared. All four compounds exhibited similar carmine red-coloured bands as illustrated in Figure 1. We then investigated the variations in absorbance with the amount of these compounds (Figure 4A and Table 1). For each compound, six different amounts ranging from 0.4 to 6.4 nmoles (0.2 to 3.3 µg for C8-MGDG) were spotted on TLC plates and revealed by derivatization after elution. The absorbances obtained with free galactose were on average 25 % higher than those obtained with MGDGs. This deviation however increased with the amounts of compounds whereas at the lowest amount tested (0.4 nmoles) absorbances for galactose and MGDGs were very close. The colour of the bands being identical, one can raise the hypothesis that the acid-catalyzed deglycosylation step [32] releasing galactose from MGDG is not complete during
the derivatization process under the conditions used, giving less dye than with free galactose. Therefore, the use of free galactose as a calibration standard for the quantification of galactolipids does not seem possible.
The calibration curves obtained with C8-MGDG and C16-MGDG are similar (Figure 4A and Table 1) with a normalized root-mean-square deviation of 10%. On average, the difference in absorbance of their derivatized compounds is not significant (Student's test, P>0.05) for five of the six amounts tested. Therefore, all derivatization steps including the deglycosylation appear identical for both MGDGs. The length of the saturated acyl chains does not affect significantly the yield of derivatization.
The absorbances obtained with C8-DGDG were increased two-fold compared to those obtained with MGDGs (Figures 4A and B), with a normalized root-mean-square deviation of 98%. We therefore assume that the acid-catalyzed deglycosylation of C8-DGDG occurs in the same proportion as with MGDGs and that the digalactosyl polar head is further hydrolysed into two molecules of galactose, resulting in identical dyes but twice the amounts obtained with MGDGs.
3.3 Qualitative analysis of MGDG enzymatic hydrolysis
C8-MGDG-NaTDC mixed micelles were incubated with rGPLRP2. Residual substrate and galactosylated compounds produced during the reaction were extracted, separated and quantified from samples collected in the course of the reaction. The organic and aqueous phases resulting from the extraction were separated and eluted on TLC plates with two different solvent mixtures consisting of chloroform/methanol/water (25/15/1.25, v/v/v) for compounds soluble in the organic phase samples and acetonitrile/water (85/15, v/v) for
compounds present in the aqueous phase. In both cases, the separated compounds were derivatized with the thymol-sulfuric acid reagent. On TLC plates presented in Figure 5, the same extract volume was applied for all reaction times to follow the reaction progress.
Three thin bands were detected from the development of organic phase samples (Figure 5A). The middle band decreasing with time corresponds to residual C8-MGDG, as indicated by the reference standards present on the right side of the same plate. The faint lower band below C8-MGDG corresponds to a less hydrophobic compound increasing with time that we attributed to C8-MGMG. The faint upper band above C8-MGDG corresponds to a more hydrophobic compound, presumably containing additional acyl chains compared to C8-MGDG. We assume it is an acyl-MGDG, formed by the addition of one acyl chain to the primary hydroxyl group of MGDG galactosyl group (Figure 6). This type of acylation transfer reaction on galactolipids in the course of lipolysis was previously observed when using fungal and bacterial lipases in organic media [15, 55, 56] but not yet with rGPLRP2.
Three main bands were also detected from the development of the aqueous phase samples (Figure 5B). The lowest fuzzy band corresponding to the most hydrophilic product was coloured in red and its retention factor (Rf) was lower than that of free galactose (data not shown). It corresponds to the water-soluble compound previously observed by Andersson. et
al using radiolabeled compounds [48] and we attributed this band to MGG. We have then
confirmed this attribution using NMR (to be published). The fuzzy intermediate band above MGG had a green color, indicating that it did not contain galactose. Its intensity did not change during the reaction and it was attributed to NaTDC used to prepare mixed micelles. As mentioned in the previous section, the presence of NaTDC band close to that of C8-MGMG could interfere with the detection of this latter at 510 nm but densitometry at 366 nm allowed reducing this interference (Figure 5C). The last upper band had a red color and thus it corresponds to a compound containing galactose. Using organic phase samples eluted with the
same polar solvent mixture, the retention factor (Rf) corresponding to this band was identical to that of C8-MGMG (data not shown). C8-MGMG thus partitioned between organic and aqueous phases. However, its quantification in both phases allowed to estimate that 96% of C8-MGMG remains in the aqueous phase after extraction. The higher affinity of C8-MGMG for the aqueous phase than for the organic phase probably results from its high hydrophilic/lipophilic balance (HLB=15.58). Nevertheless, the micellar solubilisation of C8-MGMG by NaTDC may also contribute to its larger partitioning towards the aqueous phase. When analyzing reaction products with such a high HLB, one has to check their recovery upon extraction by organic solvents. However, we previously observed that most MGMG produced from the hydrolysis of natural long-chain galactolipids can be recovered in the organic phase, with a good stoichiometry with respect to MGDG hydrolysis [12, 50].
3.4. Quantitative analysis of MGDG enzymatic hydrolysis
All TLC detected galactosylated products were quantified using the absorbances at 366 nm of their derivatives formed upon acid-catalyzed reaction with thymol and a calibration curve established with various amounts of C8-MGDG (Figure 4), loaded on each TLC plate. The volumes of organic and aqueous phases loaded on TLC plates were however adapted for the quantification. Several volumes/amounts of extract were tested and applied for each reaction time in order to obtain for all compounds an absorbance corresponding to the central part of the C8-MGDG calibration curve, corresponding to around 3 nmoles of compound loaded on the plate (1.5 µg for C8-MGDG). This allowed quantifying residual substrate and galactosylated products in the course of the reaction catalyzed by rGPLRP2 during two hours (Figure 7).
The quantification of C8-MGDG, C8-MGMG, acyl-MGDG and MGG also allowed estimating the conservation of total galactose, as well as the variation in the concentration of free octanoic acid released during the reaction using the following equations (1) and (2).
(1) (2)
C8-MGDG was quickly hydrolyzed and had almost completely disappeared after 40 min of reaction. C8-MGMG, estimated from the sum of the amounts recovered in the aqueous and organic phases, initially accumulated up to an optimum at around 15 min and then slowly decreased over time (Figure 5). Andersson et al observed similar variations using radiolabelled galactolipids [48], while Amara et al did not observe MGMG consumption during the hydrolysis of natural galactolipids by rGPLRP2 [50]. Nevertheless, it should be noted that reaction was monitored for only 30 minutes in this latter case. One can deduce from these previous findings and our observations that rGPLRP2 can rapidly release one acyl chain out of the two present in galactolipids. Previous studies have shown that rGPLRP2 has a regioselective preference for the ester bond at the sn-1 position of glycerol in polar lipids [47, 57]. Withers-Martinez et al have modelled a molecule of DGDG in the active site of the known 3D structure of a GPLRP2 chimera and the most favourable steric organization suggested that the ester bond at sn-2 position unlike the ester bond at sn-1 position could not be hydrolyzed by GPLRP2 [58]. More recent studies performed with synthetic acylglycerol substrates bearing non-hydrolysable bonds at sn-1 or sn-2 positions have however shown that rGPLRP2 can hydrolyze the ester bond at sn-2 position at a rate that is 10-fold lower compared to the hydrolysis of the ester bond at sn-1 position [59]. It is not known yet whether GPLRP2 displays a similar regioselective preference on galactolipids, but two hypotheses can be raised concerning the slow hydrolysis of C8-MGMG and the production of MGG observed
during the enzymatic hydrolysis of C8-MGDG by rGPLRP2. After the rapid cleavage of the ester bond at sn-1 position of C8-MGDG, rGPLRP2 would either act directly on the generated 2-sn-MGMG or alternatively, an intramolecular acyl-chain migration from the sn-2 to sn-1 position could occur, thus generating 1-sn-MGMG that would be further cleaved by rGPLRP2 (Figure 6). Such an isomerisation could be favoured at pH 8 and has been shown in the case of lysophospholipids, thus explaining how a phospholipase A1 (PLA1) could release the two fatty acids present in a phospholipid molecule [60]. It is also worth noticing that a similar mechanism of sn-2 to sn-1 acyl chain migration was recently proposed to explain the role of PLRP2 in brain phospholipid remodelling [61].
Low amounts of acyl-MGDG (concentration < 1 mM) also initially accumulated and rapidly disappeared (Figure 7B). This was concomitant with the highest rate of octanoic acid release by rGPLRP2 at the beginning of the reaction and one can envision that the trapping of both C8-MGDG and octanoic acid in mixed micelles might favour the acyl-transferase activity of rGPLRP2, as observed with other lipases in organic media [15, 55, 56]. The transient production of acyl-MGDG by GPLRP2 was not detected or reported in previous studies.
MGG accumulated all along the reaction (Figure 7A) in the same way as the water-soluble product observed by Anderson et al [48]. The estimated total galactose concentration appeared to be constant all along the reaction (Figure 5A). A one-way ANOVA test on total galactose concentrations did not give any significant difference (P>0.05) between the different reaction times. Besides confirming the stoichiometry of the reaction based on product analysis, this conservation of galactose confirms that galactosyl group is revealed with the same intensity in C8-MGDG, C8-MGMG, MGG and acyl-MGDG, and by the way confirms that the number and position of acyl chains does not affect the identification of galactolipids by the thymol and sulfuric acid reagent.
The reaction scheme in Figure 6 takes into account all galactosylated products observed and quantified by TLC during the hydrolysis of C8-MGDG by rGPLRP2, considering that this enzyme preferentially hydrolyses ester bonds at the sn-1 position of glycerol or transiently formed on the galactosyl group. We did not envision the possibility that rGPLRP2 could also acylate galactosyl groups in MGMG and MGG to form acyl-MGMG and acyl-MGG, because no additional bands were visible on the TLC plates. Moreover these products, if produced, could migrate with the same Rfs as MGDG and MGMG, respectively, because of having equal numbers of acyl chains. The product variations with time shown in Figure 7 support this reaction scheme with very good stoichiometries. The amounts of octanoic acid released during the reaction could therefore be estimated with a good accuracy from the quantification of MGMG and MGG. The specific activity of rGPLRP2 on C8-MGDG, expressed in µmoles of fatty acid released per min and per mg of enzyme (U/mg), was estimated from the release of octanoic acid during the first 10 minutes of the reaction. The value obtained (1945 ± 116 U/mg; n=3) is in the same order of magnitude but 2.8-fold lower than the specific activity of rGPLRP2 reported by Amara et al (5420 ± 85) using the same substrate [50]. In this previous study, the activity was however deduced from the continuous titration of free fatty acids with the pH-stat technique. Stirring was more vigourous under these conditions and the fact that fatty acids were continuously neutralized to keep pH constant had certainly an impact on the reaction rate. Here, a high concentration of TES buffer (450 mM) was used to prevent large pH changes during the reaction but this may have also impacted the reaction rate.
3.5. Application to the analysis of natural galactolipids from plant leaves
TLC separation coupled to derivatization by thymol-sulfuric acid reagent and scanning densitometry was also applied to the quantitative analysis of natural galactolipids present in
chloroplasts prepared from spinach leaves and galactosylated lipolysis products resulting from digestion by human pancreatic juice under conditions mimicking those found in the upper small intestine (Figure 8A). In the study previously published by Wattanakul et al., the respective amounts of MGDG and DGDG were estimated from calibration curves established with purified MGDG and DGDG as reference standards [12]. Here, we used only the calibration curve established with MGDG to re-estimate the amounts of MGDG and DGDG, as well as those of the lipolysis products MGMG and DGMG obtained after 90 minutes of incubation (Figure 8B). From the individual concentrations of all galactosylated products, we could estimate the equivalent concentration of galactose (1 galactose in MGDG and MGMG, 2 in DGDG and DGMG) before (t=0) and after digestion (t=90 min) and found that it was conserved (Figure 8B). It therefore seems that the derivatization of galactose by the thymol-sulfuric acid reagent is similar in natural MGDG and DGDG, as observed with synthetic medium chain (C8) galactolipids (Figure 4A). Moreover, the quantification of MGMG and DGMG, leading to a conservation of galactose, suggests that this reaction is also similar in lysogalactolipids and is thus independent of the number of acyl chains on the glycerol backbone. The conservation of galactose in products recovered from the organic phase after lipid extraction indicates that no significant amounts of MGG nor DGG were formed under these conditions, This is in agreement with the amounts of fatty released in the course of this digestion experiments and previously reported [12]. We assume it is due to a slower lipolysis of natural long chain galactolipids under these conditions compared to C8-MGDG lipolysis by GPLRP2, as well as to a too short incubation time compared to digestion in the GI tract [49]. Nevertheless, these results pave the way to further quantitative analysis of natural galactolipids from various plants and vegetables using TLC and a simple derivatization method.
4. Conclusion
Although the comparison of galactolipids and galactose derivatization by the thymol-sulphuric acid reagent indicated that approximately 25% of galactosyl groups of galactolipids were not revealed by the derivatization reaction, further analysis on the comparison of C8-MGDG, C16-C8-MGDG, C8-DGDG and hydrolysis products of C8-MGDG showed that the number and length of acyl chains, as well as the number of galactose residues in the polar head, do not affect significantly the derivatization of galactolipids by the thymol-sulfuric reagent. A single calibration curve established with C8-MGDG could therefore be used to quantify both the galactolipid substrate and all galactosylated reaction products (C8-MGMG and MGG) released in the course of C8-MGDG micelles incubation with rGPLRP2. Thus, a simple derivatization procedure based on Molisch’s reagent for carbohydrates allowed developing a quantitative method for the analysis of galactolipids by TLC coupled to scanning densitometry. It is a very accessible method for the analysis of the most abundant acylglycerols on earth and for studying their digestion. Based on this method, we have shown that PRLP2 can release the two fatty acids present in MGDG. The overall reaction involving an intramolecular acyl chain migration prior to the release of the second chain remains to be investigated in more details, but these findings show that PLRP2 can contribute to the complete digestion of galactolipids and further intestinal absorption of their fatty acids. PLRP2 could thus be the digestive enzyme that allows the full conversion of dietary galactolipids (MGDG and DGDG) into MGG and DGG, as observed in the distal part of the small intestine in rats [49]. Production of acyl-MGDG was also observed, meaning that rGPLRP2 like some microbial lipases can acylate the galactosyl group of galactolipids. PLRP2 has therefore the capacity to both acylate and deacylate sugars as previously shown upon hydrolysis of mycobacterial glycolipid antigens, phosphatidylmyo-inositol mannosides (PIM) [62].
Acknowledgements
This work received the financial support of Agence Nationale de la Recherche (France) in the framework of the GALACTOLIPASE project (ANR-09-CP2D-06-01). The PhD thesis of Moulay Sahaka was supported by a fellowship from Aix Marseille Université, France. We are grateful to Nathalie Barouh (CIRAD, Montpellier, France), Magali Arnaud and Nicolas Ritter (Gattefossé SAS, St Priest, France) for their technical assistance, as well as to Jutarat Wattanakul (Rajamangala University of Technology Krung Thep, Department of Food Science and Technology, Thailand) and David Gray (University of Nottingham, School of Biosciences, UK) for their fruitfull collaboration regarding the digestion of spinach chloroplast galactolipids.
References
[1] P. Dörmann, in: eLS, John Wiley & Sons, Ltd, Chichester, UK, 2013.
[2] A.A. Benson, R. Wiser, R.A. Ferrari, J. Miller, J. Am. Chem. Soc., 80 (1958) 4740.
[3] K. Awai, Thylakoid Development and Galactolipid Synthesis in Cyanobacteria, in: Y. Nakamura, Y. Li-Beisson (Eds.) Lipids in Plant and Algae Development, Springer International Publishing, Cham, 2016, pp. 85-101.
[4] K. Gounaris, J. Barber, Trends Biochem. Sci., 8 (1983) 378-381.
[5] J. De Caro, C. Eydoux, S. Chérif, R. Lebrun, Y. Gargouri, F. Carrière, A. De Caro, Comparative Biochemistry and Physiology. Part B, Biochemistry & Molecular Biology, 150 (2008) 1-9.
[6] M. Sahaka, S. Amara, J. Wattanakul, M.A. Gedi, N. Aldai, G. Parsiegla, J. Lecomte, J.T. Christeller, D. Gray, B. Gontero, P. Villeneuve, F. Carrière, Food & Function, 11 (2020) 6710-6744.
[7] H. Shirahashi, N. Murakami, M. Watanabe, A. Nagatsu, J. Sakakibara, H. Tokuda, H. Nishino, A. Iwashima, Chemical & Pharmaceutical Bulletin, 41 (1993) 1664-1666.
[8] T. Morimoto, A. Nagatsu, N. Murakami, J. Sakakibara, H. Tokuda, H. Nishino, A. Iwashima, Phytochemistry, 40 (1995) 1433-1437.
[9] E. Larsen, A. Kharazmi, L.P. Christensen, S.B. Christensen, Journal of Natural Products, 66 (2003) 994-995.
[10] K.F. Finney, Y. Pomeranz, R.C. Hoseney, Cereal Chem.; U.S.A., 53 (1976) 383-388. [11] O.K. Chung, Y. Pomeranz, R.M. Jacobs, Journal of the American Oil Chemists' Society, 61 (1984) 793-797.
[12] J. Wattanakul, M. Sahaka, S. Amara, S. Mansor, B. Gontero, F. Carrière, D. Gray, Food & Function, 10 (2019) 7806-7817.
[13] B.-S. Chu, G.T. Rich, M.J. Ridout, R.M. Faulks, M.S.J. Wickham, P.J. Wilde, Langmuir, 25 (2009) 9352-9360.
[14] G. Borrelli, D. Trono, International Journal of Molecular Sciences, 16 (2015) 20774-20840.
[15] P. Adlercreutz, C. Virto, M. Persson, S. Vaz, D. Adlercreutz, I. Svensson, E. Wehtje, Journal of Molecular Catalysis B: Enzymatic, 11 (2001) 173-178.
[16] V.P. Skipski, M. Barclay, [54] Thin-layer chromatography of lipids, in: Methods in Enzymology, Elsevier, 1969, pp. 530-598.
[18] J. Bitman, D.L. Wood, Journal of Liquid Chromatography, 5 (1982) 1155-1162. [19] D.T. Downing, Journal of Chromatography A, 38 (1968) 91-99.
[20] M.L. Blank, J.A. Schmit, O.S. Privett, Journal of the American Oil Chemists' Society, 41 (1964) 371-376.
[21] O.S. Privett, M.L. Blank, Journal of the American Oil Chemists' Society, 39 (1962) 520-520.
[22] M.E. Fewster, B.J. Burns, J.F. Mead, Journal of Chromatography A, 43 (1969) 120-126. [23] D.C. Malins, H.K. Mangold, Journal of the American Oil Chemists' Society, 37 (1960) 576-578.
[24] H.K. Mangold, Fette, Seifen, Anstrichmittel, 61 (1959) 877-881.
[25] H.K. Mangold, D.C. Malins, Journal of the American Oil Chemists' Society, 37 (1960) 383-385.
[26] J.C. Dittmer, R.L. Lester, J Lipid Res, 5 (1964) 126-127.
[27] H. Molisch, Monatshefte für Chemie und verwandte Teile anderer Wissenschaften, 7 (1886) 198-209.
[28] L.V. Udranszky, The furfuraldehyde color reaction., in: American Journal of Pharmacy, Philadelphia, 1888, pp. 506.
[29] J. Schmör, Klinische Wochenschrift, 33 (1955) 449-450. [30] S. Adachi, Journal of Chromatography A, 17 (1965) 295-299.
[31] V.G. Bukharov, L.N. Karneeva, Bulletin of the Academy of Sciences of the USSR, Division of chemical science, 19 (1970) 1393-1395.
[32] D. Racusen, Analytical Biochemistry, 99 (1979) 474-476.
[33] H.-S. Kim, B.-D. Yoon, D.-H. Choung, H.-M. Oh, T. Katsuragi, Y. Tani, Applied Microbiology and Biotechnology, 52 (1999) 713-721.
[34] M. Pettenkofer, Annalen der Chemie und Pharmacie, 52 (1844) 90-96.
[35] T. Seliwanoff, Berichte der deutschen chemischen Gesellschaft, 20 (1887) 181-182. [36] C. Tollens, Hoppe-Seyler´s Zeitschrift für physiologische Chemie, 56 (1908) 115-116. [37] H. Tauber, Experimental Biology and Medicine, 37 (1937) 600-601.
[38] R. Dreywood, Industrial & Engineering Chemistry Analytical Edition, 18 (1946) 499-499.
[39] M. DuBois, K.A. Gilles, J.K. Hamilton, P.A. Rebers, F. Smith, Analytical Chemistry, 28 (1956) 350-356.
[40] C. Panagiotopoulos, R. Sempéré, Limnology and Oceanography: Methods, 3 (2005) 419-454.
[41] M. Ohta, M. Iwasaki, K. Kouno, Y. Ueda, Chem Pharm Bull, 33 (1985) 2862-2865. [42] M.J. Grusby, N. Nabavi, H. Wong, R.F. Dick, J.A. Bluestone, M.C. Schotz, L.H. Glimcher, Cell, 60 (1990) 451-459.
[43] T. Giller, P. Buchwald, D. Blum-Kaelin, W. Hunziker, Journal of Biological Chemistry, 267 (1992) 16509-16516.
[44] A. Hjorth, F. Carrière, C. Cudrey, H. Wöldike, E. Boel, D.M. Lawson, F. Ferrato, C. Cambillau, G.G. Dodson, L. Thim, Biochemistry, 32 (1993) 4702-4707.
[45] M.J. Wishart, P.C. Andrews, R. Nichols, G.T. Blevins, C.D. Logsdon, J.A. Williams, Journal of Biological Chemistry, 268 (1993) 10303-10311.
[46] K. Thirstrup, R. Verger, F. Carriere, Biochemistry, 33 (1994) 2748-2756.
[47] F. Carrière, C. Withers-Martinez, H. van Tilbeurgh, A. Roussel, C. Cambillau, R. Verger, Biochim. Biophys. Acta, 1376 (1998) 417-432.
[48] L. Andersson, F. Carrière, M.E. Lowe, Å. Nilsson, R. Verger, Biochimica et Biophysica Acta (BBA) - Lipids and Lipid Metabolism, 1302 (1996) 236-240.
[49] T. Sugawara, T. Miyazawa, J Nutr Biochem, 11 (2000) 147-152.
[50] S. Amara, N. Barouh, J. Lecomte, D. Lafont, S. Robert, P. Villeneuve, A. De Caro, F. Carrière, Biochimica et Biophysica Acta (BBA) - Molecular and Cell Biology of Lipids, 1801 (2010) 508-516.
[51] S. Amara, D. Lafont, B. Fiorentino, P. Boullanger, F. Carrière, A. De Caro, Biochimica et Biophysica Acta (BBA) - Molecular and Cell Biology of Lipids, 1791 (2009) 983-990. [52] D. Lafont, F. Carrière, F. Ferrato, P. Boullanger, Carbohydrate Research, 341 (2006) 695-704.
[53] B. Sias, F. Ferrato, P. Grandval, D. Lafont, P. Boullanger, A. De Caro, B. Leboeuf, R. Verger, F. Carrière, Biochemistry, 43 (2004) 10138-10148.
[54] M.R. Shetlar, Y.F. Masters, Analytical Chemistry, 29 (1957) 402-405.
[55] M. Persson, I. Svensson, P. Adlercreutz, Chemistry and Physics of Lipids, 104 (2000) 13-21.
[56] T. Morimoto, A. Nagatsu, N. Murakami, J. Sakakibara, Tetrahedron, 51 (1995) 6443-6450.
[57] J. Fauvel, M.J. Bonnefis, L. Sarda, H. Chap, J.P. Thouvenot, L. Douste-Blazy, Biochim. Biophys. Acta, 663 (1981) 446-456.
[58] C. Withers-Martinez, F. Carrière, R. Verger, D. Bourgeois, C. Cambillau, Structure, 4 (1996) 1363-1374.
[59] M. El Alaoui, L. Soulere, A. Noiriel, F. Popowycz, A. Khatib, Y. Queneau, A. Abousalham, J Lipid Res, 57 (2016) 1589-1597.
[60] A. Pluckthun, E.A. Dennis, Biochemistry, 21 (1982) 1743-1750.
[61] H. Kuge, I. Miyamoto, K.I. Yagyu, K. Honke, J Lipid Res, 61 (2020) 1747-1763.
[62] M. Gilleron, M. Lepore, E. Layre, D. Cala-De Paepe, N. Mebarek, J.A. Shayman, S. Canaan, L. Mori, F. Carriere, G. Puzo, G. De Libero, Cell Chem Biol, 23 (2016) 1147-1156. [63] A. Salhi, S. Amara, P. Mansuelle, R. Puppo, R. Lebrun, B. Gontero, A. Aloulou, F. Carriere, Biochimie, 169 (2020) 106-120.
Table 1: Calibration curves obtained after fitting the variations in absorbance at 366 nm (y)
with the amounts of galactolipids (x). A 4-parameter logistic regression appeared as the most
suitable to fit the experimental data and the parameters were estimated using the following equation: y = d + [(a-d)/(1+(x/c)b] or x = c[(a-d)/(y-d)-1]1/b .
Compound a b c d R2
Galactose 2933 1.31 2.17 1.19×10⁵ 0.9724 C8-MGDG 6501 0.87 8.051 2.95×10¹⁰ 0.9884 C16-MGDG 8414 0.81 8.50×10⁷ 2.08×10⁵ 0.9608 C8-DGDG 19756 1.27 3.815 1.45×10⁵ 0.9888
Figure 1: Scheme of the reaction of thymol-sulfuric acid reagent with carbohydrates, based
Figure 2: Comparison of C8-MGDG absorbances at 510 nm and 366 nm after separation by
TLC and derivatization with thymol. Panel A: Variation with time in the absorbances of
C8-MGDG TLC band at 510 nm and 366 nm. Scanning densitometry was performed immediately after derivatization and plate drying, and was repeated at various times for 72 hours. Inserts show the color of the C8-MGDG band at times 0 and 20 min. Panel B: Calibration curves obtained from the separation on TLC plate of various amounts of C8-MGDG and scanning densitometry at either 510 nm or 366 nm.
Figure 3: Chromatograms of polar lipids from spinach leave chloroplasts separated by TLC
and revealed by derivatization with thymol. Chromatograms were obtained by scanning
densitometry at either 510 nm or 366 nm. The scanned TLC lane is shown below the chromatograms, with arrows indicating the location of DGDG and MGDG bands. The chromatogram peaks corresponding to these compounds are colored in pink.
Figure 4: Calibration curves established with free galactose, C8-MGDG, C16-MGDG and
C8-DGDG (Panel A). Absorbances were measured at 366 nm after migration of various amounts (nmoles) of these compounds on TLC plates and derivatization using the thymol-sulfuric acid reagent. Absorbances values are means ± SD (n=3). Panel B shows the C8-DGDG to C8-MGDG absorbance ratio as a function of the amounts (nmoles) of compounds.
Figure 5: TLC analysis of C8-MGDG-NaTDC micelles hydrolysis by rGPLRP2. The reaction
was performed at pH 8 and 37 °C using an enzyme concentration of 50 nM. Substrate and products were extracted using Folch method, separated by TLC and derivatized using thymol-sulfuric acid reagent. Plate in panel A corresponds to the separation of compounds present in the organic phase after extraction and plate in panel B to the separation of compounds remaining in the aqueous phase. The same extract volume was applied for all reaction times to make the reaction evolution apparent. Panel C shows the scanning densitometry chromatograms at wavelength of 510 and 366 nm for the separation of C8-MGMG, NaTDC and MGG.
Figure 6: Reaction scheme for the hydrolysis of C8-MGDG catalyzed by rGPLRP2 at pH 8
and 37°C. Acyl-MGDG results from the rGPLRP2-catalyzed acylation of the galactose in
C8-MGDG. 1-sn-MGMG and 2-sn-MGMG are monogalactosyl monooctanoylglycerol with one acyl chain at positions sn-1 and sn-2 of the glycerol backbone, respectively. The mechanism of intramolecular acyl chain migration catalyzed by a water molecule is indicated.
Figure 7: Time-course variation in residual substrate and reaction products during the
hydrolysis of C8-MGDG-NaTDC micelles by rGPLRP2. Reaction was performed at pH 8 and
Figure 8: TLC analysis of galactolipids from chloroplasts of spinach leaves before (t=0) and
after hydrolysis (t=90min) by human pancreatic juice. The reaction was performed at pH 6
and 37 °C as described in [12]. From human pancreatic juice composition [63], it was estimated that the digestion mixture contained 250, 31 and 47 µg/mL (or 4.9, 0.6 and 0.5 µM) of human pancreatic lipase, PLRP2 and carboxylester hydrolase/bile salt-stimulated lipase, respectively, these two latter enzymes displaying galactolipase activities [63]. Panel A shows the TLC separation of compounds extracted using Folch method and derivatized using thymol-sulfuric acid reagent. Panel B shows the concentrations of galactolipids (MGDG, DGDG) and their lipolysis products (MGMG, DGMG) deduced from TLC scanning densitometry at 366 nm, as well as the sum of all these molecular species that showing the conservation of galactose between times 0 and 90 min. It indicates that no MGG or DGG were formed under these conditions.
![Figure 1: Scheme of the reaction of thymol-sulfuric acid reagent with carbohydrates, based on Molisch’s test [27]](https://thumb-eu.123doks.com/thumbv2/123doknet/13833324.443457/28.892.128.767.225.718/figure-scheme-reaction-thymol-sulfuric-reagent-carbohydrates-molisch.webp)