Nanoparticle adsorption to substrates pose a unique challenge to understand
uptake mechanisms as it involves the organization of complex cytoskeletal
components by cells to perform endocytosis/phagocytosis. In particular, it
is not well-understood from a cell mechanics perspective how the adhesion
of particles on substrate will influence the ease of material clearance.
By using a particle model, key contributing factors underlying cell adhesion
on nonporous silica particle surfaces, migration and engulfment, are
simulated and studied. Following a 24 h incubation period, monocyte-derived
macrophages and A549 epithelial cells are able to adhere and remove particles
in their local vicinity through induction of adhesive pulling arise from cell
traction forces and phagocytic/endocytic mechanisms, in a size-dependent
manner. It is observed that such particle-decorated surfaces can be used to
address the influence of surface topography on cell behavior. Substrates which
presented 480 nm silica particles are able to induce greater development
and maturation of focal adhesions, which play an important role in cellular
mechanoregulation. Moreover, under a chemotactic influence, in the presence
of 30% fetal bovine serum, macrophages are able to uptake the particles and
be directed to translocate along a concentration gradient, indicating that local
mechanical effects do not substantially impair normal physiological functions.
DOI: 10.1002/adfm.202002630
understand the impact of nanomaterials on biological systems, it is important to assess cellular internalization behavior and further examine how this process alters normal physiology. Nanoparticle adsorption to medically relevant surfaces, such as implants or biological barriers (i.e., endothelial and epithelial cells), can instigate unique cellular uptake mecha nisms that require complex cytoskeletal dynamics similar to those involved in pathogen (e.g., bacteria or virus) clear ance by phagocytic cells, such as macro phages.[1] For freefloating objects, a
phagocytic event requires physical contact (i.e., recognition) between the cell and the object, and then pushing and pulling by the cell cytoskeleton to efficiently uptake the objects.[2] In a strongly adherent par
ticle system, this phagocytic process is however still not well understood, more specifically, from a cell mechanics point of view.
Adhesion of particles on substrates is governed by electrostatic and van der Waals forces[3–6] which depend on the physicochemical prop
erties of particles and substrates.[7,8] It typically has a magni
tude of several nanoNewton (nN).[8] Therefore, in the event of
phagocytosis, it is hypothesized that macrophages must exert
The ORCID identification number(s) for the author(s) of this article can be found under https://doi.org/10.1002/adfm.202002630. Dr. D. Septiadi, A. Lee, Dr. M. Spuch-Calvar, Dr. T. L. Moore, G. Spiaggia, Dr. L. Rodriguez-Lorenzo, Dr. P. Taladriz-Blanco, Prof. B. Rothen-Rutishauser, Prof. A. Petri-Fink
Adolphe Merkle Institute University of Fribourg
Chemin des Verdiers 4, Fribourg 1700, Switzerland E-mail: [email protected]
Dr. W. Abdussalam
Department of High Energy Density Helmholtz-Zentrum Dresden-Rossendorf Bautzner Landstraße 400, Dresden 01328, Germany Dr. L. Rodriguez-Lorenzo
Department of Life Sciences Nano for Environment Unit Water Quality Group
Av. Mestre José Veiga s/n, Braga 4715-330, Portugal Prof. A. Petri-Fink
Department of Chemistry University of Fribourg
Chemin du Musée 9, Fribourg 1700, Switzerland
The copyright line for this article was changed on 10 July 2020 after original online publication.
© 2020 The Authors. Published by WILEY-VCH Verlag GmbH & Co. KGaA, Weinheim. This is an open access article under the terms of the Creative Commons Attribution-NonCommercial-NoDerivs License, which permits use and distribution in any medium, provided the original work is properly cited, the use is non-commercial and no modifications or adaptations are made.
1. Introduction
Exposure to nanoparticulate materials has important rami fications for human health and disease. In order to fully
a greater mechanical (i.e., push and pull) force than the stabi lizing adhesive force in order to detach the particles from the surface.
In the following work, we simulated adherence and phago cytic activity of primary monocytederived macrophages (MDMs) using a particlepresenting surface. To evaluate the consequences of size and surface charge as two of the most salient physicochemical features governing the substrate adhesion force, cellular interactions, and behavior, we gener ated surfaces using amorphous, nonporous, and biocompat ible (rhodamine Blabeled) silica particles with sizes ranging from 50 to 1200 nm[9] through electrostatic interactions
between negativelycharged colloids and a positivelycharged poly(Llysine) (PLL) coated glass surface (Figure 1a).[10] By
using timelapse fluorescence imaging, scanning electron, and micropillar traction force microscopy,[11] we demonstrate
the ability of macrophages to adhere and migrate on the par ticle surface, and mechanically remove the particles in their vicinity. We further compared our results to nonphagocytic cells, namely human alveolar epithelial type II cell (A549), which naturally uptakes particles by means of endocytosis and possess strong adherence to substrates.[12–15] In particular,
epithelial cells are relevant cells as they serve as the first cel lular barrier to protect against translocation of particles. Given that particles are likely to encounter either an epithelial cell or a macrophage, understanding the role that adhesive forces play in relative clearance dynamics is critical to evaluating par ticle fate. We further confirmed that such particledecorated surfaces could be effectively used to address open questions regarding topographical effects on cell behavior in the context of native extracellular matrix function. Finally, we investigated the possibility of concomitant phagocytic migration under chemotactic influence in the presence of 30% fetal bovine serum to preferentially control the direction of uptake and translocation.
2. Results and Discussion
2.1. Role of Protrusion Mechanics in Phagocytosis of Adsorbed Particles
MDMs were characterized and confirmed using flow cytometry measurement through the presence of surface markers associ ated to macrophages namely CD14 and CD163, respectively. To study whether these macrophages were able to phagocytose par ticles adsorbed to glass substrates, an in vitro imaging uptake experiment was conducted. Negativelycharged (rhodamine Blabeled) silica particles with a diameter of 1.2 µm (Figure S1, Supporting Information) were used as a model system. Briefly, particles were spincoated onto a glass bottom dish and left to dry under ambient conditions before slow addition of MDMs and fresh culture medium. These spincoated particles yielded agglomerates on the glass surface (Figure S2, Supporting Infor mation), which was attributed to the drying effect. These clus ters of particles were nonetheless stable in culture medium; no sign of particle detachment or reclustering was observed during live cell imaging (Video S1, Supporting Information). In vitro timelapse imaging data showed that macrophages were able to migrate closely to the particle site before phagocytosing the particles (Figure 1b). This clearance process is relatively slow; particle association through filopodium/lamellipodium protru sion and engulfment was completed in ≈20–30 min (Figure 1b; and Video S1, Supporting Information). Zstack imaging shows that membrane protrusion to assist particle internalization by pulling was applied from above the particles (Figure S3, Supporting Information). Imaging data also demonstrate that this protrusion pulling force was sufficient to pull and detach the particles from the glass substrate.
To ascertain if the adhesion of particles and substrate could influence the phagokinetic activity of MDMs, we functionalized the glass substrate with a cationic polymer, PLL, which provides
Figure 1. a) Illustration of clearance and migration by single macrophage (red) on particle surface (green). b) Time-lapse fluorescence images showing
particle phagokinetic by single MDM (red). A single MDM and cluster of particles (1.2 µm rhodamine B-labeled silica particles, green) were initially sep-arated by a distance of 20 µm which decreases as the MDM migrates toward the particles and eventually uptake the particles through lamellipodium/ filopodium expansion (i.e., actin protrusion; white arrow; 100 min). Right panel shows the orthogonal view (XZ) of distribution of intracellular particles in MDM after 190 min. c) Graphical representation of particle surface engineered by layer-by-layer deposition. Blue color indicates cationic polymers. d) Photograph of glass bottom dish fully- (left panel) and half-decorated (right panel) with particle surfaces. e) Scanning electron and f) Fluorescence confocal micrograph of particle surface consisting 480 nm rhodamine B-labeled silica particles. g) Determination of coverage of particle surface by means of image processing. Larger particles possess higher coverage in comparison to small ones.
of particles on PLLcoated substrate (Figure S5; see also fluo rescence confocal data in Figure S2, Supporting Information). Moreover, the in vitro experiment demonstrated that MDMs were still able to pull, detach and internalize the particles on PLLcoated glass, which was expected to possess a stronger adhesion interaction (i.e., higher electrostatic interaction) than on nonPLL coated glass, in a period of 20 min (Figure S7 and Video S2, Supporting Information). This result is concordant with the expectation that the protrusion pulling force exerted by macrophages is ultimately stronger than the adhesive force between the particle and the substrate. Nevertheless, no major difference in the phagocytic rate for both cases (PLL vs nonPLL system) was observed.
2.2. Fabrication of Homogenous Particle Surfaces
Our ultimate objective was to simulate the adhesion of differ ently sized and charged particles on a substrate and then assess macrophage clearance in dependence of these parameters. We realized that by varying initial particle concentrations and depo sition times, a similar layerbylayer deposition technique[10] can
be used to produce a homogenous particle surface. To fabricate this surface, we first functionalized the glass with PLL and then applied a silica suspension onto the PLL layer for 10 min, this was followed by thorough rinsing with water to remove excess particles. To study the influence of particle size on particle sur face formation and topography, we synthesized four different sizes of (rhodamine Blabeled) silica particles: 50, 180, 480, and 1200 nm. Important physicochemical characterization, such as hydrodynamic diameter and Zeta potential of the particles are summarized in Figures S1 and S4 (Supporting Informa tion). Using AFM, scanning electron and fluorescence con focal microscopy, we observed successful formation of a very homogenous, thin layer of silica particle surfaces (Figure 1d–f; and Figures S5 and S8, Supporting Information). Root mean square (Rms) roughness of surfaces describing the topography of the surfaces was identified as follows: bare glass (0.6 nm), PLLfunctionalized glass (4.7 nm), 50 nm silicafunctionalized (30.6 nm), 180 nm silicafunctionalized (78.4 nm), 480 nm sil icafunctionalized (198.9 nm), and 1200 nm silicafunctionalized (408.5 nm; and Table S2, Supporting Information). Larger par ticles generate greater topographical contrast and consequently yield surfaces with higher roughness values. Image analysis of corresponding electron micrographs shows the difference in
Postincubation, cell samples were fixed and analyzed using scanning electron and fluorescence confocal microscopy. In vitro imaging data are shown in Figure 2a,b. Particle association (i.e., cleared area in Figure 2a; and Figure S11, Supporting Infor mation) was observed, indicating adhesion and internalization alongside intracellular distribution (see the 3D image recon struction in Figure 2b) by MDMs for 180, 480, and 1200 nm particle surfaces, but no cleared region was observed for the 50 nm sample. To quantify the number of associated particles, the electron micrographs were further subjected to particle counting by measuring the cleared area. Our result depicted in Figure 2c shows that single MDMs cleared more smaller parti cles (180 nm; ≈5000 particles per cell) compared to large ones (1.2 µm; ≈500 particles per cell). We compared our result by incubating nonphagocytic cells, namely human alveolar epithe lial type II cells (A549). Strikingly, we only observed significant particle association of 480 nm (≈3800 particles per cell) and 1200 nm (≈800 particles per cell) particles by A549 cells, but not 50 and 180 nm particles (Figure 2d; and Figure S12, Sup porting Information). For the latter cases, limited particle asso ciation was observed. Moreover, in the case of 480 and 1200 nm, A549 significantly uptake more particles than MDMs, which we hypothesized was due to A549’s phenotype as a strongly adhering cell line, therefore, possessing stronger traction force, allowing A549 cells to pull and easily detach the particles from PLL substrate than MDMs. To address this, we calculated the adhesion between the particle and the PLL substrate which was previously reported to consist of both electrostatic and van der Waals forces.[4] For all particle sizes, each with different Zeta
potential values (Figure S3, Supporting Information) depos ited on the PLL substrate with a surface charge of 60 mV,[16]
the highest adhesive force calculated was 0.62 nN (for 1.2 µm; see corresponding values in Figure 2e). We further quantified the traction force (i.e., force exerted by cells on substrates) by means of a micropillar traction force assay.[11,17] By measuring
the bending of pillars upon contact with cells (Figure 2f), trac tion force was determined. The result presented in Figure 2g shows that MDM and A549 cells possess a traction force of ≈1.2 and 2.4 nN, respectively. The measured traction force values are more than two times greater than the adhesive force associ ated with particlesubstrate interactions, and therefore are suffi cient to pull particles from the substrate. In addition, the stronger traction force of A549 cells can be further seen by monitoring the maturation of paxillin focal adhesions from which the trac tion force was exerted (Figure 2h). Larger focal adhesion sizes
indicate stronger substrate adhesion[18] and are associated with
topographical features generated by these particledecorated surfaces (Figure 2i). Topographic effects are known to influence cell behavior and it has been demonstrated that rougher sur faces can be used to improve cell attachment.[19,20] It has been
hypothesized that topographical features can generate local membrane changes and recruit molecules involved in adhesion and endocytosis.[21] From this perspective, the surface topog
raphy generated by particles may facilitate preferential removal of larger objects from the surface by cells.
2.4. Mechanics of Phagocytosis on Particle Surface
To investigate the role of mechanics (i.e., cell adhesion and trac tion forces) upon detachment of particles from the substrates and subsequently uptake, live cell imaging was conducted. We used the 480 nm particle surface system, as previous data indi cated higher uptake with these in comparison to other sizes. In addition, their larger size also allowed easy monitoring via confocal microscopy. Timelapse imaging data showed the
dynamics of MDMs and A549 cells on particle surfaces. Both cells were observed to adhere on the particle surface and ran domly migrate before performing uptake. They oscillated back and forth to facilitate the removal of particles before internalization (Figure 3a; and Video S3, Supporting Informa tion). This oscillation can be seen from cell displacement data as function of time obtained by cell tracking (Figure 3b,c). In comparison with A549 cells (Video S4, Supporting Informa tion), MDMs performed the “wiggling” movement earlier (9 vs 12 h), leading to faster particle removal. Once the particle area beneath the cells was cleared, both cells randomly change their orientation, migrate, and subsequently uptake particles via leadingedge (Factin) protrusions. Scanning electron micro graphs of the cells after 24 h confirmed the clearance orienta tion, which corresponds to the direction of cell migration. A high number of distributed particles were noted at the leading edge (Figure 3c,d; and Figure S12, Supporting Information) in comparison with the trailing edge of the cells (Figure 3d), as the leading edge controls the direction of migration and therefore, particle uptake. Particles were also found on the top of cells, which can be attributed to recycling of membrane protrusions
Figure 2. a) Representative scanning electron micrographs showing the adhesion and uptake of single MDM on particle surfaces engineered with
different sizes. Particle clearance can be observed in 180 and 480 nm particle surface by analyzing cleared area on the images (see the area under red dashed line). b) A 3D-rendered fluorescence confocal micrograph of single MDM (red) clears the 480 nm particles (green) in the vicinity. Quantification of particles associated to c) MDMs and d) A549 by means of image processing. # denotes the numbers are too low to be quantified by means of image processing. e) Calculated adhesive force between particles and PLL substrate. f) SEM image shows A549 cells bend the pillars, and through measure-ment of the displacemeasure-ment of pillars from their original positions, the average force per pillars the cells generate can be measured. g) Corresponding micropillar-based traction force value. h) Confocal micrographs of paxillin focal adhesion of A549 cells culture on glass (control) and on particle surface. g) Quantification of paxillin (focal adhesion) size obtained through image processing. One-way ANOVA, *p < 0.05.
from the leading edge through actin or membrane ruffles[22] to
the upper part of the cells (Figure 3d; and Figures S12 and S13, Supporting Information). In this upper region, phagocytosis (for MDMs) or endocytosis (for A549) is able to occur.
Dynamic formation of Factin protrusion (lamellipodia/ filopodia) is a wellknown cellular process driven by both poly merization of actin monomer (Gactin) to actin filament (Factin) and depolymerization of Factin to Gactin, involving adenosine triphosphate (ATP) binding and ATP hydrolysis to adenosine diphosphate (ADP), respectively.[23] To understand the
important role of actin polymerization/depolymerization plays in membrane protrusion formation and particle clearance, two additional experiments were conducted. Our first investigation was performed by introducing a phalloidinbased drug which is known to bind and stabilize Factin,[24] therefore, reducing depo
lymerization of Factin and disturbing the dynamics of actin organization.[25] 6 h after the cell seeding, 50 × 10−9 m of Alexa
Fluor 488 phalloidin was introduced and cells were incubated for the next 18 h before cell imaging was conducted. The internali zation of phalloidin drug was successfully confirmed through the presence of Factin staining inside the cells (Figure 3f; and
Figure S14, Supporting Information). Our results demonstrate that the removal of particles, which is measured by the clear ance area by phalloidintreated cells, was impeded in compar ison with control cells, which we attribute to the alteration of the actin function due to phalloidin binding to Factin (Figure 3f,g). To highlight the importance of ATP to actin dynamics, we cul tured cells at 4 °C which is known to affect endocytic and phago cytic behaviors as well as cellular metabolism and functions.[26,27]
Previous results have demonstrated reduction of particle uptake in an in vitro suspension scenario.[28] Our results confirm that at
low temperatures normally used to arrest metabolic activity and consequently phagocytosis, particle clearance was also inhibited (Figure 3f,g), highlighting that observed particle clearance is indeed an actin dependent process.
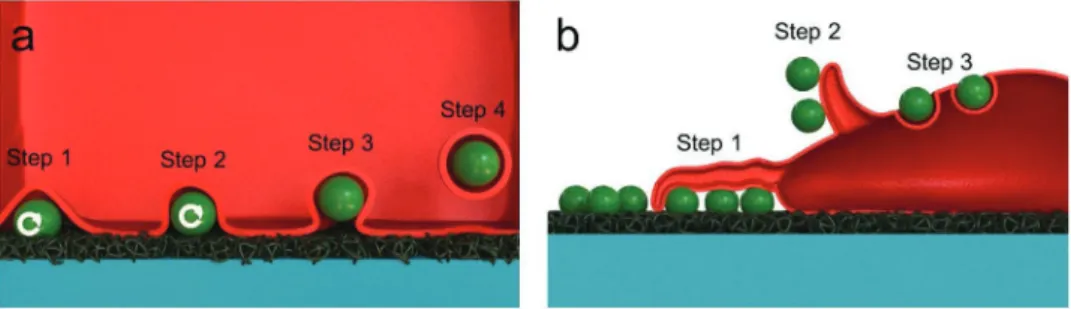
Based on these important findings, we propose a mechanism of particle clearance by adherent cells which is summarized in
Figure 4a,b. The clearance is strongly dependent on the particle
location: to remove particles beneath the cells, cells adhere, and perform the wiggling (oscillation; Figure 4a, step 1–2). Once the particles are detached and stick to the basal membrane, parti cles are internalized (Figure 4a, step 3–4). To clean particles in
Figure 3. a) Time-lapse fluorescence images showing the uptake and migration of MDMs (red) on 480 nm particle surface (green). b) Trajectory of cell
migration (white line) and c) average cell displacement over time. Black dots and gray lines are average value and standard deviation. Small displace-ment values from early time points indicates that cells do not actively move, instead they gyrate in a localized position in order to displace the particle from the surface. d) Scanning electron micrograph showing the trajectory of uptake and migration (red arrow). Red inserts show the leading edge and trailing edge of an individual d) MDM and e) A549 cell. Particles after being cleared are both observed inside and attached on the cell membranes. f) Confocal fluorescence images showing the reduction of particle clearance upon introduction of actin binding phalloidin drug and incubation at low temperature in comparison with control cells, indicating the important role of actin during particle uptake. White arrows show internalization of Alexa 488 phalloidin conjugate. g) Corresponding cleared area by single cells quantified by image processing. One-way ANOVA, *p < 0.05.
their vicinity after the particles underneath are already cleared, cells generate traction force through protrusion of Factin fila ments (filopodia/lamellipodia) in the leading edge (pulling force; Figure 4b, step 1, Figure S15, Supporting Information) fol lowed by detaching the particles. Once the particles are detached from the substrates and adhered to the cell membrane, cells eventually retract their lamellipodia/filopodia (Figure 4b, step 2) and this membrane protrusion is recycled back into the cell (Figure 4b, step 3). In this region, phagocytosis (for MDM) or endocytosis (for A549) can take place. Limitation of initial con tact of cells and particles in our system also hindered the pos sibility to shovel the particles from the bottom. Furthermore, the separation between particles and the surface is considerably small and this likely limits the ability of the cell to extend lamel lipodia/fillopodia below the particle. Therefore, due to these spa tial constraints, detachment, and removal of particles from the surface are more likely to occur via a vertical approach.
2.5. Chemotaxis on Particle Surface
To study and simulate this cell migration and clearance capacity in the presence of high chemical gradient (chemokine), which is hypothesized to take place concomitantly, we engineered par ticle surfaces on a permeable cell culture insert, which are typi cally used to study vertical cell transmigration and chemotaxis (Figure 5a).[29] Fluorescence confocal micrographs shown in
Figure 5b indicate the successful fabrication of 480 nm particle
surface on the inserts. It is important to note that, the pores of the inserts are not blocked by the particles, thereby allowing the cells to pass through. The chemotaxis procedure was performed in the following manner: MDMs, which were previ ously starved in serumfree medium at 37 °C and 5% pCO2 (for
a minimum period of 6 h prior to the experiment) were seeded and cultured in fresh, serumfree medium on the apical (top) side of the surface while high concentrations of chemokines (30% fetal bovine serum, FBS) were added to the basal (bottom) side of the inserts (Figure 5a). Post24 h of incubation, cells were fixed, fluorescentlylabeled, and analyzed using zstack fluorescence microscopy. A corresponding orthogonal view of the zstack image is shown in Figure S16 (Supporting Infor mation). On the apical side, a few MDMs were observed to clear particles in their vicinity (Figure 5c). On the basal side, by counting the transmigratory cells, we confirmed more than 40% of MDMs had translocated while carrying their particle cargo (Figure 5d). This finding confirms that both chemotaxis and particle clearance can indeed take place in parallel and local mechanical effects due to particle uptake do not substantially impair normal physiological function.
3. Conclusion
In summary, particlespresenting surfaces were successfully fabricated through electrostaticdriven assembly. The adhesion of the silica particle to the substrate (<0.6 nN) is controlled by
Figure 5. a) Illustration of particle clearance and chemotaxis on particle surface. b) Confocal micrograph showing successful fabrication of particle
surface on permeable inserts. Black holes in panel b) represent the insert pores with 8 µm in diameter. Concomitant uptake and chemotaxis by MDM in the presence of chemoattractant is observed. c) Particle clearance by MDM (red) on the apical (top side) of the inserts. A single MDM is able to clear particles in the vicinity upon migrating to the basal side containing 30% FBS. d) Single MDM after clearing the particles on the apical side move and translocate to basal side (bottom). Solid arrows show pore of the insert while dashed arrows resemble intracellular particles in the basal side.
Figure 4. Proposed mechanism of particle clearance by adherent cells. The clearance is depending on the location of particles: a) beneath the cells and
b) in cell vicinity. For particles beneath cells, by oscillating back and forth (step 1–2), cells facilitate the removal of particles before being phagocytosed from the basal membrane side (step 3–4). For particles in the cell vicinity, after the basal particles are being cleared, by generating traction force through protrusion of F-actin filaments in the leading edge (pulling force, step 1), cells detach the particles. Once the particles are detached from the substrates and adhere to the cell membrane, cells eventually retract their lamellipodia/filopodia (step 2) and this membrane protrusion is recycled back into the cell (also called actin or membrane ruffle). In this region, phagocytosis (for MDM) or endocytosis (for A549) takes parts (step 3).
and may offer a route to designing interactive biointerfaces.
4. Experimental Section
Silica Particle Synthesis and Characterization: Four different sizes of
silica particles were synthesized following the Stöber method[30] as
previously described in literature.[31,32] Initially, 5.28 mg (9.8 µmol) of the
fluorophore rhodamine B isothiocyanate (RhoB; Sigma-Aldrich, Germany) dissolved at 10 mg mL−1 in ethanol was mixed with 7.5 µL (32.1 µmol) of
(3-aminopropyl)triethoxysilane (APTES; Sigma-Aldrich, Germany) and left to stir overnight. The RhoB-APTES conjugate was then used without further purification. For small size particles (50 nm), 22 mL of the silica precursor (i.e., tetraethyl orthosilicate, TEOS; Sigma-Aldrich, Germany) was added to a preheated (60 °C) mixture of 208 mL of ethanol, 13.5 mL of deionized water and 7.8 mL of ≈25% ammonium hydroxide (Sigma-Aldrich, Germany). After 1 min of core formation, 300 µL of the RhoB-APTES solution was added to the mixture to form fluorescently-labeled silica layers around these initially formed particle cores. The reaction was further stirred overnight and purified by centrifugation at 5000 g and washed with ethanol three times, followed by redispersion in autoclaved Milli-Q water followed by three rinsing cycles. 180 nm SiO2 particles were
synthesized in the same fashion as the 50 nm particles, but by altering the reagent ratios: 11 mL TEOS, 180 mL ethanol, 36 mL of deionized water, and 24 mL 25% ammonium hydroxide. Likewise, 400 nm silica particles were synthesized with ratios of 45 mL TEOS, 348 mL ethanol, 27 mL of deionized water, and 81.8 mL of 25% ammonium hydroxide. For larger (1.2 µm) particles,[9] 2 mL of TEOS was added dropwise
(2 mL h−1) at room temperature to a mixture of 75 mL of isopropanol,
25 mL of methanol, and 21 mL of ammonium hydroxide. After 1 h of core formation, premixed solutions of TEOS (6 mL) and APTES rhodamine B isothiocyanate (300 µL) were added dropwise (2 mL h−1) to
the reaction mix. The reaction was further stirred overnight and purified by centrifugation at 100 g and washed twice with ethanol followed by redispersion in autoclaved Milli-Q water followed by three rinsing cycles. The synthesized particles were then visualized using a transmission electron microscope (FEI Tecnai Spirit, US) and their corresponding size was determined using FIJI software (NIH, US). The hydrodynamic diameter and zeta potential were measured by dynamic light scattering and zeta potential analyzer (Brookhaven, US), respectively. The particle concentration was determined by measuring the weight of 2 mL of particle suspension after evaporating the water at 50 °C.
Cell Culture: Human blood MDMs were isolated from buffy coat
suspensions provided by the blood donation service, SRK Bern. The cells were purified using CD14 Microbeads (Milteny Biotech, Germany) following the procedure reported previously.[33] The macrophages
were seeded in 6 well-plates (Thermo Fisher Scientific, Germany) in cell culture media containing RPMI 1640 (Gibco, Life Technologies Europe B.V., Zug, Switzerland) supplemented with 10% v/v fetal bovine serum (FBS; PAA Laboratories, Chemie Brunschwig AG, Basel, Switzerland), 1% v/v L-Glutamine (Life Technologies Europe), and
layer deposition technique. Briefly, glass bottom dishes (Mattek, US) possessing negative surface were conditioned with positive charge (cationic) PLL (Sigma-Aldrich, 0.1% w/v in H2O for 5 min followed by
three rinses with 1 mL of Milli-Q water). Next, 400 µL of silica suspension of different sizes (concentration 10 mg mL−1) were applied for 5 min. After
rinsing, the nonattached particles were removed and the surfaces were washed with Milli-Q water ten times to ensure only attached particles were present. The surfaces were left to dry at room temperature before cell experiments were conducted. All the surfaces were analyzed using a scanning electron microscope (SEM) Tescan Mira3 LM FE (Tescan, US), atomic force microscope and fluorescence LSM setup.
Atomic Force Microscopy Measurement: Samples were imaged using
an atomic force microscope (NX10, Park Systems, South Korea) in tapping mode in air. Images were obtained using aluminum-coated silicon probes (TAP300Al-G, Budget Sensors, Bulgaria) with a nominal resonant frequency of 300 kHz and a force constant of 40 N m−1. An area
of 5 × 5 µm2 was scanned for all particles.
QCM Characterization of PLL Layer and Particle Adsorption: 10 MHz
quartz sensor crystals (openQCM by Novaetech S.r.l., Cod: AT10-14-6-UP) were cleaned by immersion in 2% Hellmanex II solution for 30 min followed by rinsing with water and ethanol to remove any surface contaminants. Cleaned sensors were mounted in the sensor module and calibrated before use. Frequency data were recorded for bare crystals before surface conditioning with 1 mg mL−1 PLL solution
for 10 min. Excess polymer was rinsed from the surface and the sensor was dried under vacuum before being remounted to ascertain the frequency change associated with adsorption of polyelectrolyte. Similarly, silica adsorption was performed on crystals treated with PLL for 10 min before removal of the excess through rinsing and determination of the frequency response associated with particle attachment. Each frequency response was allowed to thermally equilibrate before commencing data acquisition for 5 min.
Quantification of Particle Surface: The coverage and density of particle
surfaces were measured by means of particle counting using Fiji software (NIH, US). Briefly, particles on the SEM images with the size of 10 × 10 µm2 were counted individually. The coverage was determined by
dividing the obtained numbers with the theoretical maximum number of particles allowed in a 100 µm2 area.
Calculation of Adhesive Force: The adhesive forces which consist of
electrostatic force and van der Waals interactions are calculated based on the following literature.[5,6] Briefly, the calculation steps are described
as follows: i) The electrostatic interaction between the PLL substrate and the silica particles is given by their charges, qs = 4πε0φsrs and
qp = 4πε0φprp for substrate and particles, respectively. Next, the
electrostatic interactions (F) are calculated using the following equation
F q q r w 1 4 0 s p d2 πε ε = (1)
where rd denotes a distance between cationic polymer and the silica. For
PLL surface potential, φs = 60 mV, Zeta potential of particles obtained
ε0 = 8.854 187 817 × 10−12 C2 N−1 m−2, εw = 78.5 C2 N−1 m−2, distance
range rs = 10−6 nm, and rp = 10−7 nm, and approximated rd = 10−9 nm
yields electrostatic forces F ≈ −0.27 nN, in which the negative value represents attractive interaction. ii) van der Waals forces (Fvdw) based on
Lifshitz theory[34] are calculated using the following equation Fvdw AR6rp
d
= (2)
where Rp denotes radius of silica particles and A denotes Hamaker
constant which is defined as A k T h n n n n n n n n n n n n e 3 4 3 8 2 B 1 3 1 3 2 3 2 3 1 2 32 22 32 12 32 22 32 12 32 22 32 ε ε ε −+ε εε +−εε + ν +
(
+− )(
+−)
+ + (3) where kB, εi, νe, and ni denote Boltzman constant, permittivity, naturalfrequency, and refractive index respectively. Subindices (i) 1, 2, 3 refer to PLL, particles, and water, respectively. iii) The total adhesive force (W), therefore is the sum of electrostatic and van der Waals forces
W F F= + vdw (4)
As an example, for silica 50 nm with φp = −32.09 mV, ε1 = 83,
ε2 = 3.9, ε3 = 78.58, n1 = 1.37, n2 = 1.46, and n3 = 1.3325, natural frequency
νe = 1 GHz, kB = 1.38 064 852 × 10−23 m2 kgs−2 K−1, the temperature
T = 298.14 K, and Planck constant h = 6.62 607 004 × 10−34 m2 kg s−1
(all the values are obtained from ref. [35]) yield the adhesive force with magnitude of 0.273 nN. The aforementioned calculations are repeated for other silica particles: silica 180 with φp = −21.37 mV, silica 480 with
φp = −52.42 mV, and silica 1200 with φp = −72.5 mV.
Cellular Uptake on Particle Surfaces: ≈50 000 of either MDMs or A549 cells were seeded on particle surfaces following the addition of 2 mL of fresh culture media. For live cell imaging experiments, cells (previously stained using Vybrant DiD) were allowed to adhere for 1 h inside the incubator, before the samples were monitored using LSM live cell imaging. Images of samples were acquired using z-stack and time-lapse mode. For fixed cell imaging, after 24 h of incubation, cells were fixed with 4% paraformaldehyde (PFA) in phosphate-buffered saline (PBS) 1 × and followed by immunofluorescence staining. The cells were washed twice with PBS and rinsed in 0.1% Triton X-100 Aldrich) in PBS for 5 min and subsequently in 1% BSA (Sigma-Aldrich, Germany) in PBS for another 20 min. Rabbit monoclonal anti-Paxillin antibody (abcam, Germany) was incubated following the protocols provided by the company for 1 h and followed by addition of goat antirabbit DY488 secondary antibody (Thermo Fisher Scientific, Germany) for 25 min for visualization of paxillin focal adhesions. Cells were washed three times and the cover slips were mounted onto glass slides for microscopy measurements. For SEM imaging, after 24 h of incubation, cells were fixed with 4% PFA in 1 × PBS. Samples were dried at room temperature for 1 day before being sputtered with gold (3–4 nm in thickness) for SEM visualization.
Fluorescence Imaging: All of the fluorescence images were acquired
using Zeiss LSM 710 confocal laser scanning inverted microscope set up with 20 × or 63 × magnification, numerical aperture, NA, 0.8 of Zeiss LCI Plan-NEOFLUAR objective lens (Zeiss GmbH, Germany). Different fluorophores (rhodamine B and Vybrant DiD) were excited sequentially at 541 and 633 nm and their emissions were collected correspondingly by the detector with the frame size 512 pixel × 512 pixel. For live cell imaging, the image was acquired in a z-stack and in time-lapse mode with the slice thickness 1–2 µm and time between each frame 5–10 min. For fixed cell imaging, DY488 (paxillin) or Alexa Fluor 488 (F-actin) was excited using a 488 nm laser. Image processing (i.e., mean intensity projection) was carried out directly using Zen 2010 software (Zeiss GmbH, Germany). 3D rendering was performed using Imaris software (Bitplane, Switzerland). False color images were adjusted to better distinguish
different types of cells and particles. Cell tracking is performed using TrackMate plugin[36] available in Fiji (NIH, US). In total displacement
of 10 individual cells were recorded. Data are shown as average value and standard deviation.
Role of Actin Polymerization/Depolymerization: ≈20 000 of MDMs were seeded on particle surfaces (480 nm) following the addition of 1 mL of fresh culture media. After 6 h of incubation, cells were incubated either with culture media containing 50 × 10−9 m Alexa 488 phalloidin (at 37 °C)
or with drug free media at 4 °C for the next 18 h before cell imaging experiments were conducted. Control experiments were provided by incubating cells with drug free media at 37 °C. Live cells were imaged without any washing treatment. The experiments were performed in duplicate.
Quantification of Cleared Area in Actin Study: The cleared area per
single cell was quantified manually by image processing using Fiji. The image processing algorithm followed three main steps: 1) intensity thresholding, 2) binarization, and 3) surface area calculation. Data are shown as average area and its 95% confidence interval. A parametric one-way analysis of variance (ANOVA) was performed. Values were considered significant (*) if p < 0.05.
Quantification of Paxillin Area: The size of paxillin focal adhesions
was quantified by image processing using Fiji. The image processing algorithm followed three main steps: 1) intensity thresholding, 2) binarization, and 3) surface area calculation. Data from two conditions: A549 cells cultured on particle surface and on glass (i.e., control) is shown as average area of paxillin and its 95% confidence interval. A parametric ANOVA was performed. Values were considered significant (*) if p < 0.05.
Cellular Traction Force Microscopy by Micropillar Assays: Cell traction
force exerted by MDMs and A549 cells was measured using micropillar assay developed by Microduits GmbH, Switzerland was used.[17] Briefly,
500 000 A549 cells and MDMs were cultured in a six-well plate overnight (3 wells in total). Next, 200 µL of trypsin was added for 5 min to detach the cells from the well substrate and detached cells were suspended in fresh culture media. Preparation and quantification of traction force was done by following described protocols reported in the literature.[11,17] In
total, 20 000 A549 cells and MDMs in 1 mL culture media were gently added above the micropillars and grown for 24 h. Cells were fixed using 4% PFA and stained with Brilliant Cresyl Blue ALD dye (Sigma-Aldrich, Germany) for 90 s followed by 5 washes with Milli-Q water. The sample was kept in Milli-Q water and imaging was performed using a Leica DMI6000B bright field optical microscope (Leica, Germany) with a dry 40 × magnification objective (numerical aperture 0.6). Images were recorded as RGB micrographs with the frame size 1392 × 1040 pixels. Displacement of micropillars due to the force exerted by the cells were measured using Mechprofiler software developed by Microduits GmbH and calculation of the average force was based on the following literature.[17] Important physical parameters, such as length, diameter,
and spring constant of the arrays which are needed for the quantification were provided by Microduits GmbH. Data were shown as average force per pillar. ANOVA was performed and values were considered significant (*) if p < 0.05. The measured samples were further left dried in room temperature for 1 day and sputtered with 2–3 nm gold layer for scanning electron microscopy visualization. Electron micrographs were acquired using Tescan Mira3 LM FE.
Chemotaxis on Particle Surfaces: Particle surfaces on Falcon Cell
Culture Inserts made from polyethylene terephthalate (pore size 8 µm, culture area 0.9 cm2, Thermo Fisher, Germany) were prepared in similar
fashion with the glass bottom dish one. Next, 50 000 MDMs were previously starved by culturing in serum-free culture medium for 6 h before seeding on the top part (apical side) of the insert placed in 12 well plates following addition of 750 µL of free serum culture media. In the bottom part of the inserts, 1.5 mL of 30% FBS supplemented medium was added. Cells were maintained inside incubator for the next 24 h. Cells were fixed using 4% PFA in PBS and stained with Alexa Fluor 488 phalloidin (Thermo Fisher Scientific, Germany). The number of apical and basal cells was manually counted to determine the percentage of cells migrating toward the basal side.
white blood cells (monocytes) isolated from human blood was approved by the committee of the Federal Office for Public Health Switzerland (Reference No. 611-1, Meldung A110635/2) for the Adolphe Merkle Institute. The datasets generated during the current study are available in the Zenodo repository, https://doi.org/10.5281/zenodo.3819724.
Conflict of Interest
The authors declare no conflict of interest.
Keywords
adhesion, chemotaxis, macrophage, particle surface, phagocytosis Received: March 23, 2020
Revised: April 27, 2020 Published online:
[1] F. Castellano, P. Chavrier, E. Caron, Semin. Immunol. 2001, 13, 347. [2] S. Schuerle, I. A. Vizcarra, J. Moeller, M. S. Sakar, B. Özkale,
A. M. Lindo, F. Mushtaq, I. Schoen, S. Pané, V. Vogel, B. J. Nelson,
Sci. Rob. 2017, 2, eaah6094.
[3] D. S. Rimai, D. J. Quesnel, J. Adhes. 2002, 78, 413.
[4] R. A. Bowling, in Particles on Surfaces 1: Detection, Adhesion,
and Removal (Ed.: K. L. Mittal), Springer, Boston, MA 1988, p. 129.
[5] F. L. Leite, C. C. Bueno, A. L. Da Roz, E. C. Ziemath, O. N. Oliveira,
Int. J. Mol. Sci. 2012, 13, 12773.
[6] S. N. Ramakrishna, P. C. Nalam, L. Y. Clasohm, N. D. Spencer,
Langmuir 2013, 29, 175.
[7] H. Kweon, S. Yiacoumi, C. Tsouris, Colloids Surf. A 2015, 481, 583. [8] M. Götzinger, W. Peukert, Powder Technol. 2003, 130, 102.
[9] D. Septiadi, J. Bourquin, E. Durantie, A. Petri-Fink, B. Rothen-Rutishauser, Sci. Rep. 2018, 8, 9861.
[10] G. Decher, J.-D. Hong, Makromol. Chem., Macromol. Symp. 1991,
46, 321.
[17] N. Goedecke, M. Bollhalder, R. Bernet, U. Silvan, J. Snedeker, J. Vis.
Exp. 2015, 17, e53350.
[18] D. Septiadi, F. Crippa, T. L. Moore, B. Rothen-Rutishauser, A. Petri-Fink, Adv. Mater. 2018, 30, 1704463.
[19] A. Zareidoost, M. Yousefpour, B. Ghaseme, A. Amanzadeh, J. Mater.
Sci.: Mater. Med. 2012, 23, 1479.
[20] D. Yamashita, M. Machigashira, M. Miyamoto, H. Takeuchi, K. Noguchi, Y. Izumi, S. Ban, Dent. Mater. J. 2009, 28, 461.
[21] F. Gentile, L. Tirinato, E. Battista, F. Causa, C. Liberale, E. M. di Fabrizio, P. Decuzzi, Biomaterials 2010, 31, 7205.
[22] B. Borm, R. P. Requardt, V. Herzog, G. Kirfel, Exp. Cell Res. 2005,
302, 83.
[23] B. Alberts, A. Johnson, J. Lewis, M. Raff, K. Roberts, P. Walter,
Molecular Biology of the Cell, 4th ed., Garland Science, New York
2002.
[24] L. M. Coluccio, L. G. Tilney, J. Cell Biol. 1984, 99, 529. [25] J. A. Cooper, J. Cell Biol. 1987, 105, 1473.
[26] B. J. Iacopetta, E. H. Morgan, J. Biol. Chem. 1983, 258, 9108. [27] J. Saraste, G. E. Palade, M. G. Farquhar, Proc. Natl. Acad. Sci. USA
1986, 83, 6425.
[28] T. dos Santos, J. Varela, I. Lynch, A. Salvati, K. A. Dawson, PLoS One
2011, 6, e24438.
[29] G. Giannelli, J. Falk-Marzillier, O. Schiraldi, W. G. Stetler-Stevenson, V. Quaranta, Science 1997, 277, 225.
[30] W. Stöber, A. Fink, E. Bohn, J. Colloid Interface Sci. 1968, 26, 62. [31] T. L. Moore, D. Hauser, T. Gruber, B. Rothen-Rutishauser,
M. Lattuada, A. Petri-Fink, R. Lyck, ACS Appl. Mater. Interfaces 2017,
9, 18501.
[32] D. R. Larson, H. Ow, H. D. Vishwasrao, A. A. Heikal, U. Wiesner, W. W. Webb, Chem. Mater. 2008, 20, 2677.
[33] S. Steiner, J. Czerwinski, P. Comte, O. Popovicheva, E. Kireeva, L. Müller, N. Heeb, A. Mayer, A. Fink, B. Rothen-Rutishauser,
Atmos. Environ. 2013, 81, 380.
[34] E. M. Lifshitz, Sov. Phys. JETP 1956, 2, 73.
[35] F. Bordi, C. Cametti, G. Paradossi, Biopolymers 2000, 53, 129. [36] J. Y. Tinevez, N. Perry, J. Schindelin, G. M. Hoopes, G. D. Reynolds,
E. Laplantine, S. Y. Bednarek, S. L. Shorte, K. W. Eliceiri, Methods