HAL Id: hal-02902334
https://hal.archives-ouvertes.fr/hal-02902334
Submitted on 20 Jul 2020HAL is a multi-disciplinary open access
archive for the deposit and dissemination of sci-entific research documents, whether they are pub-lished or not. The documents may come from
L’archive ouverte pluridisciplinaire HAL, est destinée au dépôt et à la diffusion de documents scientifiques de niveau recherche, publiés ou non, émanant des établissements d’enseignement et de
Self-Confined Nucleation of Iron Oxide Nanoparticles in
a Nanostructured Amorphous Precursor
Jens Baumgartner, Raj-Kumar Ramamoorthy, Alexy Freitas,
Marie-Alexandra Neouze, Mathieu Bennet, Damien Faivre, David Carriere
To cite this version:
Jens Baumgartner, Raj-Kumar Ramamoorthy, Alexy Freitas, Marie-Alexandra Neouze, Math-ieu Bennet, et al.. Self-Confined Nucleation of Iron Oxide Nanoparticles in a Nanostructured Amorphous Precursor. Nano Letters, American Chemical Society, 2020, 20 (7), pp.5001-5007. �10.1021/acs.nanolett.0c01125�. �hal-02902334�
Self-confined nucleation of iron oxide nanoparticles
in a nanostructured amorphous precursor
Jens Baumgartner,1,‡ Raj Kumar Ramamoorthy2†, Alexy P. Freitas2,3, Marie-Alexandra Neouze3,
Mathieu Bennet1, Damien Faivre1,4 *, David Carriere2,‡*
1Department of Biomaterials, Max Planck Institute of Colloids and Interfaces, Science Park
Golm, 14424 Potsdam, Germany.
2LIONS, NIMBE, CEA, CNRS, Université Paris-Saclay, CEA Saclay 91191 Gif sur Yvette
Cedex France.
3Laboratoire de Physique de la Matière Condensée, École polytechnique, CNRS, Université
Paris-Saclay, 91128, Palaiseau, France.
Abstract
Crystallization from solution is commonly described by classical nucleation theory, although this
ignores that crystals often form via disordered nanostructures. As an alternative, the classical
theory remains widely used in a “multi-step” variant, where the intermediate nanostructures merely
introduce additional thermodynamic parameters. But this variant still requires validation by
experiments addressing indeed proper time and spatial scales (ms, nm). Here, we used in situ
X-ray scattering to determine the mechanism of magnetite crystallization and in particular how
nucleation propagates at the nanometer scale within amorphous precursors. We find that the
self-confinement by an amorphous precursor slows down crystal growth by two orders of magnitude
once the crystal size reaches the amorphous particle size (c.a. 3 nm). Thus, not only the
thermodynamic properties of transient amorphous nanostructures, but also their spatial distribution
determine crystal nucleation.
KEYWORDS: magnetite, nanoparticles, nucleation, in situ SAXS/WAXS, classical nucleation
theory, non-classical crystallization
Text
Crystallization of solids from dilute solutions governs the formation of many synthetic, biogenic
and geologic minerals.1 This ubiquitous process has long been described by “classical” nucleation
theory (CNT): crystal nuclei capture or release solute monomers through thermal fluctuations;
nuclei that reach the critical size, where the energetic gain of the new phase compensates the cost
of the crystal/solvent boundary, finally grow faster than they dissolve and reach macroscopic sizes.
This model allows calculating nucleation rates, i.e. the number of new crystals formed per unit
time:2,3
𝐽st = 𝐴𝑒 ( ∗) (1)
This expression combines i) the thermodynamic parameters of the crystal, which through the
Boltzmann factor 𝑒 ( ∗) express the probability to successfully cross the activation barrier
W(N*), i.e. the minimal work of formation of a cluster of critical size N* and ii) a kinetic prefactor
𝐴 = 𝑛 𝑍(𝑁∗)𝑘 (𝑁∗), where Z(N*) is the Zeldovich factor that corrects for the width of the
activation barrier (see SI), 𝑛 is the concentration of monomers in the metastable phase, and k+(N*)
is the rate of monomer addition to a cluster of size N*. k+ relates to the rate of growth and the rate
of monomer loss by a cluster of size N+1 via k(N) = k+(N) - k-(N+1).
However, the relevance of this theory is questioned since recent experimental evidence has
pointed towards crystals forming through complex reactions with possible amorphous intermediate
states,1,4–13 in contradiction with the founding hypotheses of the CNT that overlooks any
intermediate amorphous cluster by design. In the course of the reaction, solutes may enrich in
droplets, form polymers, clusters and nanoparticles that only crystallize later, leading to a so-called
incompatible with experiments, but also the predictions of the nucleation rates are inconsistent by
several tens of orders of magnitude.5,6
To reach a better theoretical description of crystallization, a common approach is to apply the
classical nucleation theory to intermediate steps, i.e. the nucleation of an intermediate phase from
a metastable solution, followed by the nucleation of the crystals from the intermediate phase.5,14
This approach leads to the definition of the consecutive activation barriers from corrected
thermodynamic parameters: the free energy of reaction g then accounts for the reaction to or from
the intermediate phase, and the interfacial free energy 𝛾 accounts for interface creation between
the intermediate phase and the initial and the final states, respectively.5,6,10,14 These corrections to
the classical nucleation theory allow fitting the predicted nucleation rates to the measurements and
extracting effective thermodynamic parameters. In other words, the classical nucleation theory has
been made compatible with the “non classical” cases, although the retrieved thermodynamic
parameters to describe those phase transitions at the nanometer scale far from equilibrium have
remained controversial, affecting their predictive usefulness.
By contrast, there has been little consideration of the kinetic prefactor A, although it allows in
principle a strong consistency test of the classical nucleation theory. On the one hand, A can be
measured easily from the variation of nucleation rates with reactant concentration similarly to the
thermodynamic parameters. On the other hand, the classical nucleation theory imposes two
conditions: i) the kinetic prefactor must relate to the forward rate of monomer addition k+(N*) at
the critical size via 𝐴 = 𝑛 𝑍(𝑁∗)𝑘 (𝑁∗), and ii) the forward rate of monomer addition k+(N) must
relate to the net growth rate k=k+ - k- due to the constrained equilibrium hypothesis used to derive
the nucleation rates in the CNT:2
𝑘(𝑁) = 𝑘 (𝑁) − 𝑘 (𝑁 − 1)𝑒
( ) ( )
Therefore, not only the nucleation rate, but also the growth rate must remain consistent with the
thermodynamic constants of the transition and the transport properties from the metastable phase
to the stable phase. However, the coupled analysis of the nucleation rates and growth rates requires
time-resolved, structural data at crystal sizes of only a few structural units, which are out of reach
of the techniques commonly used in the seminal studies on non-classical nucleation:
potentiometry, cryo-TEM, optical microscopy, or atomic force microscopy to name a few.5,10–13,15– 17 They provide necessary qualitative information on the formation of the nanoparticles and their
aggregation (e.g. the “crystallization per attachment” process),17 but lack a quantitative assessment
of the nucleation of the primary crystals themselves as may be provided by small and wide angle
X-ray scattering (SAXS).8,18
Here we resolve at appropriate nanoscale and millisecond resolutions the crystallization of
magnetite (Fe3O4) nanoparticles, a paradigmatic example of a synthetic, biogenic and geologic
iron oxide known to crystallize from disordered precursors.10,19–22 Dispersions of magnetite
nanoparticles in water with a total iron concentration c = 5mM, 12.5mM, 25mM, 37.5mM and
50mM range were synthesized by mixing two equal volumes of a) an aqueous solution of FeCl2
and FeCl3 with respective concentrations c/3 and 2c/3, acidified with 0.1M HCl, and b) a 1M
NaOH solution (see Materials and Methods in SI). The mixing was carried out in fast millifluidic
and stopped-flow mixers and characterized by synchrotron in situ X-ray small- and wide-angle
scattering (SAXS/WAXS) on the SOLEIL/Swing beamline.23 It enabled us to resolve the
developing nanostructures over several length (0.1 – 100 nm) and time scales (0.4 - 600 s) (Fig. 1
for c = 37.5mM).
At the shortest observed reaction time (400 ms) up to 15 s of reaction, we evidence that most of
(oxyhydr)oxide particles. The lack of long-range crystalline order is evidenced by the absence of
detectable Bragg peaks in the WAXS signal, while the total scattered signal in the SAXS range is
orders of magnitude beyond the detection limit. The fractal aggregation is characterized by a
scattering signal decaying as a power low at low angles, before reaching a shoulder at q ≈
0.2-0.5 Å-1. The aggregates consisted of particles with a radius of gyration of Rg = 0.5 ±0.1 nm after
150 ms and grew to Rg = 1.2±0.1 nm within 15 s as determined from SAXS modeling
(Supplementary Figure 3). This corresponds to spherical particles of 1.3 nm growing to 3 nm in
diameter.
Afterwards, these amorphous particles crystallized to magnetite as evident from appearing Bragg
reflections in WAXS (Fig. 1b). The total volume of amorphous and crystal phases is evaluated
from the total scattering intensity (“invariant theorem”, see Materials and Methods in SI):24
𝑄 = 4𝜋 ∫ 𝐼(𝑞)𝑞 𝑑𝑞 = (2𝜋) < 𝜂 > (3)
where < 𝜂 > is the quadratic mean fluctuation of scattering length density. Observing that Q
remains constant during the amorphous-to-crystal conversion, we assume that the electron density
of the amorphous and crystal are identical within the experimental resolution, and find that the
amorphous-to-crystal conversion occurs at constant volume fraction 𝜙 (Fig. 2a), given by:24
< 𝜂 >= 𝜙 (1 − 𝜙 )Δ𝜌 (4)
with Δ𝜌 = 𝜌 − 𝜌 the constrast of scattering length density with water.
The hypothesis on the electron densities of the amorphous and crystal being equal has been
validated a posteriori by i) the consistency between the total volume fractions evaluated by the
integration of the SAXS, and expected from the total iron concentration (Fig. 2a black circles and
integration of the WAXS, and by the integration of the contribution of the crystals to the SAXS
(see below and Fig. 2a red symbols).
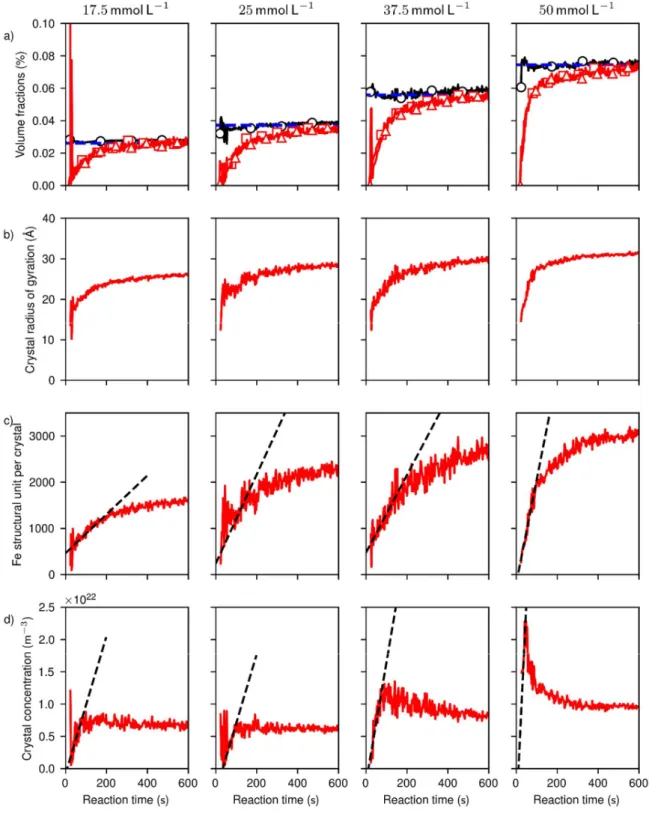
We extracted selectively the structural parameters of the crystals, i.e. the volume fractions (Fig.
2a), sizes (Fig. 2b and 2c) and concentrations (Fig. 2d). The treatment (see all details in SI) consists
in i) after calculating the advancement of reaction as evaluated by integration of the Bragg peaks,
subtracting the proper proportion of the signal of the initial amorphous network, and ii) fitting to
the thus extracted contribution of the crystals, a model describing mass fractal aggregates of
nanocrystals. We find that the crystal volume fractions evaluated by the integration of the WAXS,
and by the integration of the crystal SAXS signal are identical within experimental accuracy (Fig.
2a red symbols), supporting in particular i) the good sensitivity of the WAXS detection, ii) that the
electron densities of the amorphous and crystal phase are identical within experimental resolution,
and iii) that any evolution of the amorphous phase during crystallization do not significantly affect
our treatment.
The structural parameters of the crystals enabled us to identify a nucleation/growth stage
followed by an aggregation stage. Both stages were observable at Fe concentrations of 37.5 and
50 mM, where: (i) during the nucleation/growth period, concentrations and sizes of crystals grew
continuously, and (ii) during aggregation, crystal concentrations decreased while particles
diameters grew from 4±0.2 nm to 8±0.3 nm. Simultaneously, the total crystal volume fraction still
increased, evidencing that this “crystallization par aggregation” stage17 is accompanied by a
residual growth stage. At lower Fe concentration (17.5 mM and 25mM), no aggregation was
observed, and at Fe concentrations of 5 mM, the precursors did not crystallize within the
largest concentration (50 mM), the nucleation is ill-resolved because of the overlap with
aggregation, and the nucleation rate was excluded from the analysis.
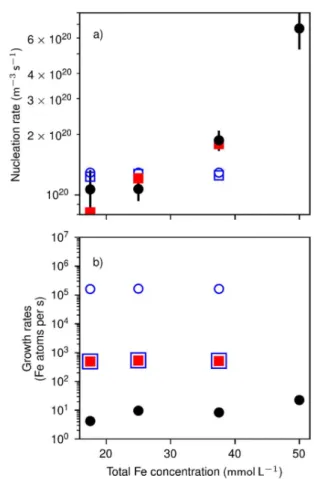
From the evolution of the volume fraction and of number of crystals, we evaluated both the
crystal nucleation rate Jst and the net growth rate k of the crystals by addition of iron units from
the amorphous precursor. The number of crystals produced per unit time and solution volume
during the steady-state regime 𝐽st = 𝜕𝑛/𝜕𝑡 , as estimated from the linear increase in crystal
concentrations during the nucleation periods (Fig. 2d, dashed lines), increases from (1.1±0.2) 1020
m-3s-1 to (6.7±1.4) 1020 m-3s-1 with concentration (Fig. 3a, circles). The lowest measurable size N0
is between 230±140 and 470±80 structural units (Fig. 2c), reached within t < 1s of reaction. At these sizes, the crystals grow at a rate k between 4.2±0.3 to 9.6±2.3 structural units per second
(Fig. 3b, circles), as evaluated from the increase in volume of the crystals (Fig. 2c).
We evidence the collapse in the growth rate by a lack of consistency between Jst, N0 and k, in
two possible scenarios: dissolution-recrystallization and crystallization within the dense phase. In
a dissolution-recrystallization mechanism, the amorphous particles are in equilibrium with ions in
solution and impose a solute concentration of ions samorph. This solubility of the amorphous phase
must be significantly smaller than c.a. 5% the nominal iron concentration (c), given that all iron
species are in the solid phases within the SAXS resolution (Fig. 2a, black lines and circles). Yet,
samorph could be higher than the solubility of the crystal scryst.25 Crystallization then occurs by
addition of dissolved iron species:
(Amorphous) ⇋ 2 Fe(OH)a3-a + Fe(OH)b → Fe3O4 + (2a+b-8) OH- + 4 H2O
where (a, b) account for the speciation of iron in the high-pH medium. To compare the
experimental and theoretical data, we have measured the standard free energy of crystallization (g0
scryst=3·10-2 µmol.L-1), and the interfacial tension of the crystal/water boundary ( = 0.16 J.m-2) by
measuring the solubility of the magnetite nanocrystals as a function of size (SI).
Estimating that the amorphous solubility cannot exceed sa = 1 mmol.L-1, an upper limit for the
activation barrier can be evaluated as 𝑊(𝑁∗) ≤ 15𝑘𝑇 by using 𝑒 ( ∗) ≃ st
[ ( ∗) ( ∗) ] with
𝐽st ≃ 10 m-3s-1, 𝑍(𝑁∗) ≃ 1, and a forward rate of attachment 𝑘 (𝑁∗) ≤ 10 s-1 that cannot
exceed the feed rate by diffusion (SI). On the other hand, 𝑊(𝑁∗) = 𝑁∗|𝑔| with the free energy
of reaction per structural unit 𝑔 = 𝑘𝑇 log cryst
amorph of the order of -10 kT. Therefore, the critical size
N* cannot exceed a few structural units. As a consequence, the mean rate of growth k0 between the
critical size N* and the minimal observable size N0, given by:
N0 = N* + k0t (5)
is in the order of k0 = 100 to 500 s-1. In other words, the mean rate of growth below N0 is
significantly larger than the rate of growth k = 4 to 10 s-1 observed above N0.
A more quantitative evaluation of the kinetics expected for dissolution / reprecipitation shows
that the slowdown of growth is even stronger. We used Eq. 1, 2 and 3 with the amorphous solubility
samorph as the single free parameter to fit the predicted and the experimental nucleation rates,
assuming that crystallization is either diffusion-limited (DL, 𝑘 (𝑟) ∝ 𝑟 as given by the
Smoluchowski equation, SI), or rate-limited (RL, 𝑘 (𝑟) ∝ 𝑟 ). In any case, the best agreements
between experimental and theoretical nucleation rates are found for amorphous solubilities that
are in a reasonable range (6 µmol.L-1 for DL, 16 µmol.L-1 for RL). But we find that the growth
rate from the critical size (5 to 10 structural units) up to N0 is indeed several orders of magnitude
faster than just above N0 (k0 = 510±25 s-1 for RL to (1.6±0.1) 105 s-1 for DL against k = 4 to 10 s
dissolution-recrystallization, but it is not physically consistent with reactant depletion in the liquid phase.
Indeed, diffusion in water feeds the crystals at a typical rate of 108 s-1 (SI), largely sufficient to
compensate for the consumption by the reaction (c.a. 510 to 105 s-1). Therefore, we rule out the
dissolution-recrystallization mechanism because of the collapse of the growth rate at N0.
Alternatively, crystallization can occur by direct transformation of the amorphous particles,
assuming that they have a net structural charge of - per iron atom: (Amorphous)- → Fe3O4 + OH- + h H2O
Crystal nucleation within an amorphous precursor belongs to the scope of the classical
nucleation theory: as assumed by the CNT, a single order parameter fluctuates (size of the nascent
phase), not two (the size and the density). Instead of the prediction for the nucleation rate expressed
per unit of solution volume (eq. 1), we use the nucleation rate per unit volume of dense metastable
phase:
𝐽dense = 𝐽solution/𝜙amorphous = 𝑘 (𝑁∗)𝑍(𝑁∗)𝑛dense𝑒
( ∗)
(6)
where 𝜙amorphous is the volume fraction of dense phase, and 𝑛dense is the density of the
amorphous phase (number of structural units per volume unit). As practically all reactants are
present in the amorphous particles, the nucleation rate expressed per unit volume of solution takes
the same expression as eq. 1, where the nominal concentration of iron species 𝑛nominal is used
instead of the solubility of the amorphous particles 𝑛solution. Furthermore, we consider that the
crystallization is rate-limited instead of diffusion-limited, owing to the short interatomic distances
in the amorphous particles. The free energy of reaction from the amorphous particles to the crystal
is unknown, but we observe that at thermodynamic equilibrium, the fraction of iron in the crystal
dominates the fraction of iron under the form of amorphous particles by at least factor of 102 (Fig.
|𝑔| ≥ 𝑘𝑇 ln 10 ≃ 5 𝑘𝑇. Following the same qualitative argument as above, the critical size N* must be significantly lower than N0 to avoid unphysical activation barriers of 500 kT.
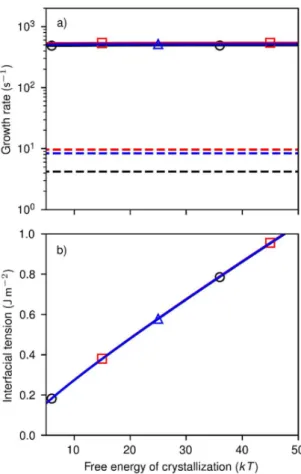
More quantitatively for a given value of g, the only free parameter in eq. 1 to 3 to fit the predicted
nucleation rates to the data is then the interfacial tension between amorphous particles and
magnetite crystals (Fig. 4). Independently on the assumed value of g, we find that the critical size
is at most 10 Fe structural units, and the growth rate from N* to N0 is 500 s-1, again up to c.a. 2
orders of magnitude faster than measured at N0 (4 to 10 s-1). Therefore, we unveil a collapse of the
growth rate when the size of the crystals reaches c.a. 3 nanometer in diameter, identical to the
diameter of the amorphous particles. In case of dissolution-recrystallization, the slowdown of the
growth would have no clear physical origin; by contrast, it is consistent with the direct
amorphous-to-crystal transition, and is assigned to reaction confinement in the solid-state amorphous matrix.
As a matter of fact, the inconsistency between Jst, N0 and k is so strong it can be unveiled on
qualitative grounds only as shown above, regardless of the details of the chemical reactions and
structural rearrangements known to occur,16 and excludes any crystallization scenario unless a
confinement by the reactants is invoked.
As a result, the values of k0 indicate that within a second, several hundreds of structural units are
transferred from the amorphous particles to the nascent crystal. The growth rate then abruptly
decays because the crystals have depleted the amorphous particles, and grow by transfer from the
ions in solution. We expect that such a self-confinement effect is dominant when the characteristic
time to reach a critical fluctuation to form a crystal in the amorphous volume of characteristic size ξ, which scales as 𝜏 ∝ dense ≃ 1µ𝑠, is shorter than the lifetime of the amorphous particle.
Therefore, the precursor nanostructure is irrelevant for a proper description of nucleation from
viscous and/or insoluble nucleation precursor (small liquid droplets, amorphous nanoparticles,
solid-state or gel-like aggregates), not only the thermodynamic properties of the amorphous
precursor, but also the characteristic length ξ has to be accounted for, in order to accurately predict
the crystallization mechanism, hence the number of crystals and their final sizes. In particular, the
dissolution / recrystallization scenario must be absent, or at least sufficiently slow, as we have
evidenced here by analysis of the kinetic constants.
Figure 1. Time evolution of the X-ray scattering patterns during magnetite synthesis with a total
iron concentration of 37.5 mM. From the SAXS patterns (a), we infer that nanostructured,
extended aggregates are formed from the lowest measured reaction time. The WAXS patterns (b)
Figure 2. Physical parameters extracted from the scattering patterns at different iron
line indicates the maximal crystalline volume fractions expected from cFe. (b) Radius of gyration
of the crystalline particles. (c) Number of FeO4/3 structural unit per crystal. (d) Numeric
concentration of crystalline particles. The dashed lines are linear regressions used to retrieve the
Figure 3. Comparison of experimental and theoretical (a) nucleation rates, and (b) growth rates.
Full black circles: experimental data. Full red squares: assuming a rate-limited growth within the
amorphous particles. Blue squares: assuming a rate-limited dissolution-recrystallization. Blue
Figure 4. Kinetic and thermodynamic parameters determined after fitting the theoretical to the
experimental nucleation rates and the crystal sizes. a) Mean growth rate between the critical size
and the minimal observable size as a function of the assumed free energy of crystallization from
the amorphous precursor, and b) interfacial energy. Black circles: using [Fe] = 17.5 mM, red
squares: [Fe] = 25 mM, blue triangles: [Fe] = 37.5 mM. The dashed lines indicate the experimental
Supporting Information.
The following files are available free of charge: Materials and methods, X-ray powder
diffraction, Size-dependent solubility of formed magnetite nanoparticles, SAXS data from a
stopped-flow configuration, Deconvolution of the crystals contribution to the SAXS signal,
Transmission electron microscopy images and Additional references (PDF).
Corresponding Author
*Correspondance should be addressed to [email protected] or [email protected]
Present Addresses
†Laboratoire de Génie Chimique, Université de Toulouse, CNRS, INPT, UPS, Toulouse, France.
Author Contributions
‡These authors contributed equally.
ACKNOWLEDGMENT
The authors acknowledge the SOLEIL synchrotron for beamtime. We thank Jeannette Steffen
(MPI) for ICP-OES, and Corinne Chevallard, Thierry Gacoin, Jean-Baptiste Champenois, Mathias
Egglseder and Yael Politi for discussions. APF, MAN, and DC acknowledge a public grant
overseen by the French National Research Agency (ANR), project DIAMONS
ANR-14-CE08-0003. RKR acknowledges support by ANR as part of the “Investissements d’Avenir” program
(Labex NanoSaclay, reference: ANR-10-LABX-0035). DF was supported by the Max Planck
Society, the DFG (DFG-ANR project (FA 835/10-1)), and the European Research Council through
REFERENCES
(1) Yoreo, J. J. D.; Gilbert, P. U. P. A.; Sommerdijk, N. A. J. M.; Penn, R. L.; Whitelam, S.; Joester, D.; Zhang, H.; Rimer, J. D.; Navrotsky, A.; Banfield, J. F.; Wallace, A. F.; Michel, F. M.; Meldrum, F. C.; Cölfen, H.; Dove, P. M. Crystallization by Particle Attachment in Synthetic, Biogenic, and Geologic Environments. Science 2015, 349 (6247), aaa6760. https://doi.org/10.1126/science.aaa6760.
(2) Kelton, K.; Greer, A. L. Nucleation in Condensed Matter: Applications in Materials and Biology; Pergamon materials series; Elsevier: Amsterdam, 2010.
(3) Becker, R.; Döring, W. Kinetische Behandlung Der Keimbildung in Übersättigten
Dämpfen. Ann. Phys. 1935, 416 (8), 719–752. https://doi.org/10.1002/andp.19354160806. (4) Lee, J.; Yang, J.; Kwon, S. G.; Hyeon, T. Nonclassical Nucleation and Growth of
Inorganic Nanoparticles. Nat. Rev. Mater. 2016, 1 (8), natrevmats201634. https://doi.org/10.1038/natrevmats.2016.34.
(5) Habraken, W. J. E. M.; Tao, J.; Brylka, L. J.; Friedrich, H.; Bertinetti, L.; Schenk, A. S.; Verch, A.; Dmitrovic, V.; Bomans, P. H. H.; Frederik, P. M.; Laven, J.; van der Schoot, P.; Aichmayer, B.; de With, G.; DeYoreo, J. J.; Sommerdijk, N. A. J. M. Ion-Association Complexes Unite Classical and Non-Classical Theories for the Biomimetic Nucleation of Calcium Phosphate. Nat. Commun. 2013, 4, 1507. https://doi.org/10.1038/ncomms2490. (6) Vekilov, P. G. Nucleation. Cryst. Growth Des. 2010, 10 (12), 5007–5019.
https://doi.org/10.1021/cg1011633.
(7) Smeets, P. J. M.; Finney, A. R.; Habraken, W. J. E. M.; Nudelman, F.; Friedrich, H.; Laven, J.; Yoreo, J. J. D.; Rodger, P. M.; Sommerdijk, N. A. J. M. A Classical View on Nonclassical Nucleation. Proc. Natl. Acad. Sci. 2017, 201700342.
https://doi.org/10.1073/pnas.1700342114.
(8) Fleury, B.; Neouze, M.-A.; Guigner, J.-M.; Menguy, N.; Spalla, O.; Gacoin, T.; Carriere, D. Amorphous to Crystal Conversion as a Mechanism Governing the Structure of
Luminescent YVO4:Eu Nanoparticles. ACS Nano 2014, 8 (3), 2602–2608. https://doi.org/10.1021/nn4062534.
(9) Legg, B. A.; Zhu, M.; Zhang, H.; Waychunas, G.; Gilbert, B.; Banfield, J. F. A Model for Nucleation When Nuclei Are Nonstoichiometric: Understanding the Precipitation of Iron Oxyhydroxide Nanoparticles. Cryst. Growth Des. 2016, 16 (10), 5726–5737.
https://doi.org/10.1021/acs.cgd.6b00809.
(10) Baumgartner, J.; Dey, A.; Bomans, P. H. H.; Le Coadou, C.; Fratzl, P.; Sommerdijk, N. A. J. M.; Faivre, D. Nucleation and Growth of Magnetite from Solution. Nat. Mater. 2013, 12 (4), 310–314. https://doi.org/10.1038/nmat3558.
(11) Gebauer, D.; Völkel, A.; Cölfen, H. Stable Prenucleation Calcium Carbonate Clusters. Science 2008, 322 (5909), 1819–1822. https://doi.org/10.1126/science.1164271. (12) Pouget, E. M.; Bomans, P. H. H.; Goos, J. A. C. M.; Frederik, P. M.; With, G. de;
Sommerdijk, N. A. J. M. The Initial Stages of Template-Controlled CaCO3 Formation Revealed by Cryo-TEM. Science 2009, 323 (5920), 1455–1458.
https://doi.org/10.1126/science.1169434.
(13) Dey, A.; Bomans, P. H. H.; Müller, F. A.; Will, J.; Frederik, P. M.; With, G. de;
Sommerdijk, N. A. J. M. The Role of Prenucleation Clusters in Surface-Induced Calcium Phosphate Crystallization. Nat. Mater. 2010, 9 (12), 1010–1014.
(14) Kashchiev, D.; Vekilov, P. G.; Kolomeisky, A. B. Kinetics of Two-Step Nucleation of Crystals. J. Chem. Phys. 2005, 122 (24), 244706. https://doi.org/10.1063/1.1943389. (15) Galkin, O.; Vekilov, P. G. Control of Protein Crystal Nucleation around the Metastable
Liquid–Liquid Phase Boundary. Proc. Natl. Acad. Sci. 2000, 97 (12), 6277–6281. https://doi.org/10.1073/pnas.110000497.
(16) Jensen, K. M. Ø.; Andersen, H. L.; Tyrsted, C.; Bøjesen, E. D.; Dippel, A.-C.; Lock, N.; Billinge, S. J. L.; Iversen, B. B.; Christensen, M. Mechanisms for Iron Oxide Formation under Hydrothermal Conditions: An in Situ Total Scattering Study. ACS Nano 2014, 8 (10), 10704–10714. https://doi.org/10.1021/nn5044096.
(17) Mirabello, G.; Ianiro, A.; Bomans, P. H. H.; Yoda, T.; Arakaki, A.; Friedrich, H.; With, G. de; Sommerdijk, N. A. J. M. Crystallization by Particle Attachment Is a Colloidal
Assembly Process. Nat. Mater. 2019, 1–6. https://doi.org/10.1038/s41563-019-0511-4. (18) Stawski, T. M.; Driessche, A. E. S. van; Ossorio, M.; Rodriguez-Blanco, J. D.; Besselink,
R.; Benning, L. G. Formation of Calcium Sulfate through the Aggregation of Sub-3 Nanometre Primary Species. Nat. Commun. 2016, 7, ncomms11177.
https://doi.org/10.1038/ncomms11177.
(19) Cornell, R. M.; Schwertmann, U. The Iron Oxides: Structure, Properties, Reactions, Occurrences and Uses; Wiley-VCH: Weinheim, 2003.
(20) Faivre, D.; Schüler, D. Magnetotactic Bacteria and Magnetosomes. Chem. Rev. 2008, 108 (11), 4875–4898. https://doi.org/10.1021/cr078258w.
(21) Laurent, S.; Forge, D.; Port, M.; Roch, A.; Robic, C.; Vander Elst, L.; Muller, R. N. Magnetic Iron Oxide Nanoparticles: Synthesis, Stabilization, Vectorization,
Physicochemical Characterizations, and Biological Applications. Chem. Rev. 2008, 108 (6), 2064–2110. https://doi.org/10.1021/cr068445e.
(22) Sun, S.; Gebauer, D.; Cölfen, H. Alignment of Amorphous Iron Oxide Clusters: A Non-Classical Mechanism for Magnetite Formation. Angew. Chem. Int. Ed. 2017, 56 (14), 4042–4046. https://doi.org/10.1002/anie.201610275.
(23) David, G.; Pérez, J. Combined Sampler Robot and High-Performance Liquid Chromatography: A Fully Automated System for Biological Small-Angle X-Ray Scattering Experiments at the Synchrotron SOLEIL SWING Beamline. J. Appl. Crystallogr. 2009, 42 (5), 892–900. https://doi.org/10.1107/S0021889809029288.
(24) Neutrons, X-Rays and Light: Scattering Methods Applied to Soft Condensed Matter, 1. ed.; Lindner, P., Zemb, T., Eds.; North-Holland delta series; Norh-Holland, Elsevier:
Amsterdam, 2002.
(25) Putnis, A. Why Mineral Interfaces Matter. Science 2014, 343 (6178), 1441–1442. https://doi.org/10.1126/science.1250884.
(26) Wallace, A. F.; Hedges, L. O.; Fernandez-Martinez, A.; Raiteri, P.; Gale, J. D.;
Waychunas, G. A.; Whitelam, S.; Banfield, J. F.; De Yoreo, J. J. Microscopic Evidence for Liquid-Liquid Separation in Supersaturated CaCO3 Solutions. Science 2013, 341 (6148), 885–889. https://doi.org/10.1126/science.1230915.