Publisher’s version / Version de l'éditeur:
Vous avez des questions? Nous pouvons vous aider. Pour communiquer directement avec un auteur, consultez la première page de la revue dans laquelle son article a été publié afin de trouver ses coordonnées. Si vous n’arrivez pas à les repérer, communiquez avec nous à PublicationsArchive-ArchivesPublications@nrc-cnrc.gc.ca.
Questions? Contact the NRC Publications Archive team at
PublicationsArchive-ArchivesPublications@nrc-cnrc.gc.ca. If you wish to email the authors directly, please see the first page of the publication for their contact information.
https://publications-cnrc.canada.ca/fra/droits
L’accès à ce site Web et l’utilisation de son contenu sont assujettis aux conditions présentées dans le site LISEZ CES CONDITIONS ATTENTIVEMENT AVANT D’UTILISER CE SITE WEB.
Technical Memorandum (National Research Council of Canada. Division of Building Research); Issue 78
READ THESE TERMS AND CONDITIONS CAREFULLY BEFORE USING THIS WEBSITE. https://nrc-publications.canada.ca/eng/copyright
NRC Publications Archive Record / Notice des Archives des publications du CNRC :
https://nrc-publications.canada.ca/eng/view/object/?id=91597dba-c971-4a0c-b8ec-705d31157b45 https://publications-cnrc.canada.ca/fra/voir/objet/?id=91597dba-c971-4a0c-b8ec-705d31157b45
NRC Publications Archive
Archives des publications du CNRC
This publication could be one of several versions: author’s original, accepted manuscript or the publisher’s version. / La version de cette publication peut être l’une des suivantes : la version prépublication de l’auteur, la version acceptée du manuscrit ou la version de l’éditeur.
Access and use of this website and the material on it are subject to the Terms and Conditions set forth at
NATIONAL RESEARCH COUNCIL OF CANADA
ASSOCIATE COMMITTEE ON SOIL AND SNOW MECHANICS
SYMPOSIUM ON THE HEAT EXCHANGE
AT SNOW AND ICE SURFACES
26 OCTOBER 1962
TECHNICAL MEMORANDUM NO.
78·OTTAWA
OCTOBER 1963
(i)
PREl"ACE
The prediction
or
the annual runoff to be expected from
snow covers and glaciers, of the rate of ice growth under
various conditions or the maximum ice thickness to be expected
at a given site, are problems of particular interest to
Canadians.
Consideration of these problems has resulted in
a growing interest in the exchange of heat between the
at-mosphere and snow
。ョセice covers.
Because the period of
interest is usually winter, the time when this heat exchange
is at a minimum, the accur.ate measurement of some components
or
the exchange is very difficult.
Observations are often
undertaken without an appreciation of the magnitude of the
quantities to be measured, the dirticulties
or
measuring
such quantities in winter and the limitations of instruments
and techniques now available.
In response to the growing interest in the heat exchange
&t snow and ice surfaces, and the need for information on
measuring this exchange, the Snow Bnd Ice Subcommittee of
the Associate
cッセセゥエエ・・on Soil and Snow Mechanics sponsored
a one-day conference at which the results and experience of
those making observations could be presented and discussed.
Information was presented on the heat exchange at the surface
of snow covers, fresh water and sea ice and glaciers, as well
as on instruments used in making measurements and some of
their limitations.
The papers presented at the conrerence,
or a sUIn.."llary of those pUblished elsewhere, and the ensuing
discussion, are presented in this procee,dings.
'TABLE OF CONTENTS
Session I Chairman - Dr. W. H. Mathews
I 1. "Energy Exchange at Glacier Surfaces" Dr. S. Orvig, d・セ。イエュ・ョエ of Meteorology,
McGill University... 1
I 2. "Energy Exchange Through an Annual Sea Ice Cover"
Dr. P. Schwerdtfeger and Dr. E. R. Pounder,
Depa rtnlE'n t of Physics, r1cGill Uni vera i ty. • • • • 10 I
3.
"A Study of Ice Growth RR tes Rela ted toEnergy Exchange"
Mr. G. P. Williams, Snow and Ice Section,
Division of Building Research...
14
I
4.
"Energy Exchane;e a t Tempera te Snow SurfacesII·Mr. L. W. Gold, Snow and Ice Section, Division
of Building Research...
27
I
5.
General discussion... 29Session II Chairman - Dr. E. R. Pounder
General discussion on instruments and methods of measuring the different components of the energy exchange with the following
presentations:-II 1. "The Accuracy of Net Radiometers"
Mr. J. R. Latimer, MeteoroloGical Branch
Department of Transport...
31
II 2. "A Field Comparison of Two Types of Net Radiometers"
Mr. D. W. Boyd, Meteorologist, seconded to Division of Builiing Research, and P. H.
Reynolds, Summer Student, Division of
Building Research... •••••••
57
II
3.
"The Measurement of Conductive Heat Flux Through Ice"Mr. P. L8ngleben, Physics Department,
McGill University...
68
II
4.
"The i1easurement of Dew Point Temperatures Under '.'!inter Condi tions"Dr. D. Stephenson, Building Services Section,
Division of Building Research...
79
II
5.
General Discussion...83
ENERGY EXCHANGE AT GIACIER SURFACES
By
Svenn
Orvig::-The oldest known descriptions of glaciers are found in Icelandic literature of 900 years ago. Scientific studies
or
glaciers were first undertaker- in Switzerland some rive hundred years later, and during the 19th .century glaciology became important in geology, as i t was evident that the glaciers were instrumental in the evolutionor
landscape(Wallen, 1949).
Regular meteorological service, with weather forecasting, was first established in France, where synoptic weather maps were published from 1863, but climatological research had been carried out before that date. It was realized that Alpine glaciers had varied much in extent, both in"historic and prehistoric times, and the study of the connection
between fluctuations in cLimate and variations of the size
or
gLaciers became an important part of phys ical geography.Step by step the science of glaciology was pursued in other parts of the world: Norway, Sweden, Iceland, and then in more remote lands: Alaska, Spitsbergen, Greenland. orten the results
or
glaciological research were reported in geo-logical publications and at geogeo-logical conrerences. The geologist's interest in the study of glaciers is easily understood when one adopts derini tions like those ot' V. Klebelsberg: "Gletscherkunde" (glaciology) has to do with the glaciers of the present day; "Glazialgeologie" '"i th those of the past. Only when the two problems are connected can one obtain a knowledge of the importance of the glaciers on the changing face of the earth.A great セ・。ャ or worK is still being done on problems
or
a descriptive nature; Morphological investigations, movement of glaciers 。ョセ variations of their margins. The more recent research in glaciology isor
a difrerent character; the in-vestigation or'the physical processes involved in the lifeor
a glacier. This work started in Sweden, and Scandinavian scientists have been pioneers in this field. The studyor
climatic rluctuations, as shown by the benaviour of glaciers, necessi tates a knOWledge 01' the rela tionship between themeteorological elements and the accumulation and ablation. Radiation measurements are
or
tHe utmost importance in adetailed study
or
a glacier's regime, and only in recent years have reasonably accurate radiation instruments been2
-used in the fieLc. The investigations of interest in this connection are mainly those carried out in the past forty
years around tne northern-most parts of the Atlanti.c. Ahlmann
(194ti}
summarized this キッイォセ listing geomorphological studies in Norway, the Swedish-Norwegian Arctic Expedition of 1931, the Norwegian-Swedish Spitsbergen Expedition in1934,
the Vatnaj8kull investigations in1936-38,
and the North-East Greenland Expedition in1939-40.
The Karss Glacier studiesof QセRUMR「 were continued from 1942 and further work has
been done in northern Sweden, in the Kebnekajse Massif, and also in Norway.
Gradually, as these investigations were unjertaKen, the problems became more precisely defined, and lately other workers nave taKen up the challenge in other parts of the world, using the methods elaborated largely by Ahlmann and Sverdrup.
Before 1950 nothing was known about the clirna te of the ablation period on any Canadian glacier or ice cap. Wood
(194t;) noted tha t i t wa s di:fficul t to recall a. single ex-ample be:fore 194ti of studies carried out in North America and devoted to the great areas of snow accumulation.
A closer understanding of the laws governing the behaviour of glaciers necessitates co-operation between glaciologists and meteorolo;;ists, since the problems of the
two :fields go hand in hand---precipitation with alimentation of the glaciers and interior temperatures of ice and firn with air temperatures. As pointed out by Ahlmann (1946), glaciology requires meteorological observations of a special kind. General and local CLimatological information is ne-cessary to determine the ablation, with observations from the glacier surface itself. The investigatloDs J during the past forty years, in the regi ons around the nortliern-mos t parts of the Atlantic were undertaken partly to determ.ine the behaviour of gla ciers in a changing cllma te partly to obtain a more detailed knowledge of the importance of tile
different meteorological factors in the process o:f ablation. They have been carried out during a period "d th generally receding glaciers. Similar investigations have until
re-cently been lacking from other parts of the Horld; particularly the knowledge of radiation at high latitudes has been unsatisfactory.
In North America, glacial studies have been undertaken for many years, particularly in Alaska and the Rocky Mountains, but these studies have dealt mainly with the extension of
glaciers, their advances and recessions. Geomorphological and botanical evidence has been used in working out the
3
-has material been pUblished on glacial-meteorological studies. Let us now turn to a consideration of energy exchange at glacier surfaces. Generally, the snow surface receives heat by incoming (short-wave) radiation from the sun and sky
K-v,
by conduc tion and convec tion from the a ir above the surface if the air temperature increases with height (Qc)' by conduction from below if the エ・ュー・イ。エセイ・ of the snow increases with depth (Qg). Heat is also received by the surface if the water content of the air increases withheight. Water vapour is then transported to the surface and condensation of the water vapour will release the latent heat on condensation. The amount of water condensed will
be indicated by E gm/sq.cm.
The snow surface loses heat by net outgoing (long-wave) radiation (L), by conduction and convection to エィセ air above the surface if the air temperature decreases with height
(-Qc)' and by conduction downwards if the temperature of the snow decreases with depth
(-Q).
Heat is also lost if the water content of the air、・」イセ。ウ・ウ
with height. Water isthen evaporated from the surface, and the heat of evaporation will be taken from the surface. The amount of water evapo-rated will be indicated by -E gm/sq.cm.
Some of the incoming solar radiation is lost due to
reflection. If the albedo of the snow is called%" (= reflected radiation divided by total incoming radiation) the absorbed part of the incoming radiation will be (1 - a) kセ = K.
The heat transported to the surface by all processes is used to raise the temperature of the surface snow to the melting point and for evaporation. After the melting point has been reached, the heat is used for melting and evapora-tion. It is convenient to give all amounts of heat in gram calories per square centimeter. The total ablation of the surface measured in cm. of water will be called H, the water equivalent of the layer which is evaporated is h, and the water equivalent of the layer which is melted is, therefore,
(H-h). To melt one gram of snow takes
eo
calories, and 「セocalories are needed to evaporate one gram of snow. The amount of hea t used tor melt ing is, therefore: 80 (H-h), and for evaporation: beOh.
If melting ana evaporation take place we have:
K + L .: Qc .: Qg
=
eo
(H-h) +beo
h (1 )or K + L .: Qc .: Qg
=
BaH
+ bUO h(2)
water vapour is transported away. place, the heat equation takes the K
.!:
L.!:
Qc. セ Q,セ=
Here
E
is negative, since When no evaporation takesform:
- lセ
-セoh - 600 E
(3)
heat liberated by condensation This equation can be キイゥエエ・ョセ
600 E + K
.!:
L セ Q.c;:!:
qセ=
(600 calories is the amount of of one gram of water vapour).
tlOH (4)
80H - 600 E
=
K.!. L .!. Qc .!. qLセ (5)This equation is therefore valid both in the case of melting and evaporation and in the case of melting only, but E must be given the proper sign; positive in the case of conden-sation, negative in the case of evaporation.
We thus see that glacial-meteorology requires the co-operation of meteorologists and glaciologists, as the term "R" (total ablation of the surface) ought to be measured in order tha t we may obtain a c.heck on the va.rious terms. The equation contains several difficult terms, indeed all of them cause difficulties. We snould like to work with real
observations as far as possible, and all glacial-meteorological investigations there1'ore involve a certain amount of instru-mentation. The first term K and the second term L, are
usually measured when the investigation is concentrated on a relatively small area like a glacier. Other speakers wi.11 discuss some of the results of experiments with various types of radiometers. Regarding the even more di.f'ficul t terms,
Qg, Q,CI and (;>UO E, the first of' these (conduction through
セセ snow ana ice) can be measured or calculated, and we shall hear later of some such measurement.s of con,jnctive heat flux
through sea ice. In applying the heat balance equation to a temperate or sub-polar e:lacier surface in the abletlon season, i t is often possible to observe en isothermal con-dition in the upper layers of snow, in which case the t.erm
qLセ may be disregarded. This will not be the case early in tfie ablation season, however.
Regarding the terms 6UO E and qセL they have been mea-sured at some of the drifting ice stations, both at the "North Pole" and American stations. However, according to Badgley
(1961), who worked on station Alpha, no one has yet measured the fluctuation of temperature and vertical air movement near the ice surface with the speed and precision necessary for a direct determination of the turbulent heat flux.
Badgley believes that both their own ana tne Russians' esti-mates are witnin +
35%
of the true values. 'fhe va.rious Russian5
-investigations do not agree between エィ・ュウ・ャカ・セN Some estimates of t.heir val ues are several times grea ter than the American values. There seems to be no way of reconciling the various estimates. The eddy flux of heat is smaller than either the upward or downward stream of radiation by a factor of 30 or more on the Polar pack ice. It is even small compared to
the difference between these streams, i.e., to the net radi-ative flux. The estimation of the energy flux essociated with evaporation and condensation at the ice surface is
subject to even greater uncertainties. Badgley has published values which are estimates of his own and the Russian North Pole investigations, but warns that they should be taken as the roughest of estimates, meant to show the order of magni-tude only.
As direct measurements of turbulent fluxes at present are impossible to perform, we are trying to obtain some estima tes of their magni tude by study·ing the proce"ss and
expressing i t analytically in terms of measurable quantities. It was, in fact, jus t for that rea son the t Sverdrup "founded" glacial-meteorology. His colleague Ahlmann, the gla.ciologist, desired information about the relative importance of the
factors which influence the ablation of the snow fields and glaciers, such as radiation and transfer of heat from the atmosphere. However, Sverdrup reasoned that a study of the exchange of heat between the snow surface and the air is,
quite independent of the application of the results to glacio-logical problems, of considerable interest to meteorology, being a special investigation within the wide field which deals wi th the exchange of hea t between the surface of the earth and the air. Glacial-meteorological observations there-fore serve a double purpose. First, they can give us inform-ation about the regional characterjstics of the Meteorological regime and explain the con trol on a pa rticular glacler. This can be used in e comparison of the seme controls over another glacier. Seoondly, glacial-meteorological observations may lead us to a better understanding of the physical processes involved in turbulent exchange, although we have some way to go yet in this respect. In fact, glacial meteorologists often trea.t the sensible and latent heat exchanges betv.!een the snow and atmosphere as a residual in the surface energy balance equation. If one wants to find the relation between heat gain or loss at the surface and meteorological factors such as wind speed, air temperature and humidity, i t is
necessary to undertake systematic meteorological observations of these elements at different elevations above the surface. Sverdrup was the first to undertake such gradient measure-ments in the Arctic, and after Sverdrup practically all field measurements taken in the Arctic have followed his
6
-lead, and calculations of heat and water vapour transport have been based on the exchange-coefficient hypothesis, and
therefore on the study of the laws governing tempera ttlre, vapour pressure and wind gradients over the surface.
Directly then, we can measure all the terms in the energy balance equation, except the eddy coefficients, which govern
turbulent flux. The following discussion is that of Lister
(1962).
It is possible to evaluate the coefficient ofverti-cal transfer of' (horizontal) momentu.m by "taking wind speed profiles, and if the temperature and humidity profiles are similar to the wind speed profiles, it will indicate that the turbulent process is the same for eddy transfer of heat,
water vapour and momentum. A coei'ficient for momentum
trans-fer found from wind observations can then be used with
profiles of temperature for evaluation of heat transfer, and with profiles of humidity for evaluation of evaporation and condensation.
As conditions depart from a neutral atmosphere, it is well established that wind and temperature profiles depart
from a logsri thmic rels tioD '-rith height and a power law
has then been found to fit observed data (Pasquill,
1949).
Near the surface the air stability is nearer neutral, i. e. , nearer a balance between buoyancy forces and turbulent mixing, and hence the variation of -wind and temperature with the log of height is generally predominant.
Many of the wind profiles from glacier sites can be fitted by a logaritllmic law over the lowest 2 m or so, but
a power law is often more applicable nt greater height. Many
of the profiles can be split into two parts and a log law
becomes more applicable when the lowest 2 -
3
m are considered.The coefficient of vertical transfer of horizontal mo-mentum due to wind shear over the ground has been expressed
by Thornthwaite and Holzman
(1942):
where
.
(
=
"C=
f'=
K,,,,,=
BZエセ == ,,;t '-.J ...i
Km;fZ"
shear stress air densitycoefficient of eddy Viscosity vertical gradient of wind speed.
Prandtl developed the ャッァ。イゥエエセゥ」 law of wind-speed
variation with height, using a constant of integration z
as a boundary condition that velocity should be zero at 0
7
-, 0']
e
where K
=
von Karman's constant - 0.4 Combining Eqs. (6) and (7):(8)
This coefficient of vertical transfer of momentum is valid only in near adiabatic conditions, but in the lowest few meters above a melting ice surface i t has been found that many observations are near to a straight line when plotted on logarithmic paper, suggesting a power law.
Assumptions made in the common mixing length theory give equality to the coefficients of vertical transfer of momentum Km, heat Kh, and water vapour
K
v ' Many workers ha.ve used a common coeffic ient and a single coeffic ient ofturbulent transfer is often thought applicable to momentum, heat and vapour over glacier surfaces.
The profiles for various glaciers frequently show divergence above 2m, the vapour pressure profile diverging at about 1m. Divergence is to be expected at greater heights where the stab.ili ty index departs further from zero. These results are similar for glaciers in various locations so that the dynamic meteorology of ablation over a very wide area seems to have definite common characteristics (Lister, 1962).
The eddy flux of heat
Q
c may be=
f
C
p
K
h
Hセ[
+
I)
expressed as: where Cp =8T
8
z "'-
=
1 - - -
=
specific heat of air at constant pressure
=
0.24 calgmOC
vertical gradient of air temperature °C/cm
dry-adiabatlc lapse rate 10-4°C/cm which may be ignored since i t is small in comparison with ob-served eイ。、ゥ・ョエウセ
8
-Substituting Km of Eq.
(8)
for Kh:Qc
=p
C
p
Uz.
K2.
Z
log
Z (10)e
Zo
vrhich, 1...rhen integr8 ted between two levels zl and z2 may be expressed
(11 )
loge
22
loS
e
Z2
Zo
Zt
Evaporation may be similarly expressed as a flux. The values in such equations of temperatures, wind speeds and vapour pressures are obtained by measurements at chosen heights.
Possibly a solution to the difficulties of theory may lie in measuring the fluxes directly. Inductive studies of observations of vertical wind speed and instantaneous devi-ation from the time-averages of vertical wind component, water vapour pressure and temperature m8Y improve our
under-standing of the processes. The principle is simple; if one
can ュ・。セオイ・ up and dOHn currents throuc:h a civen level, and
measure the humidity and temperature of eacft ed-j:r as i t passes throulh the level, one can, by inteerating all the measure-ments, arrive at the net flux. No assumptions need be made about exchange coefficients. The instrumental difficulties are considerable but, if they can be overcome, one should, by precise measurements of the actual fluxes,. be able to Let firm answers to the questions regarding the role of evapora-tion and edjy heat conducevapora-tion between the surface Bnd at-mosphere.
BIBLIOGRAPHY
1. Ahlmann, H. W: son, IlGlaciological Methodsll
, The Polar Record, Vol.
4,
pp 315 - 319, 1946.2. IlGlaciolocioal Hesearch on the North
Atlantic Coasts,1l R. Geog. Soc. Res. Ser. I, 83 pp, 1948.
3.
Ba dgley, F. 1. IlHea t BalBnce a t the Surf8 ce of theArctic Oceanll , Proc. Western Snow Conference, PP 101 - 104 1961.
4. Brunt, D. "Physical and Dynamical Meteorology", Cambridge University Press, 423 pp, QセSYN
5.
Lis ter, I1:. "lIef!t 8nd 1·18s s 138lance 8 t the Surfac e of the':Jard IIunt Ice Shelf, 196011
, Arctic Inst. North America,
9
-6.
Pasquill, F., "Eddy Diffusion of Weter Vapour end Heat
Near the Ground", Proc. Royal Soc. A., Vol.
198,
pp
116
- 140, 1949.
7 •
tィッイョエィGセL・ ite, C.
W.,end
B.Holzman, "Measurement of
Evapora tion from Lend end
Weter Surfaces",
u.
S. Dept.
of Agriculture, Tech. Bull.
817,75
pp,
1942.
8.
Wallen, C. C., "Glacial-Meteorological Investigations
on the Karaa Glacier in Swedish Lappland
1942 - 1948",
Geographical Annual, ,Vol.
30, 240
pp,
1948-49.
9.
Wood,
W.,A.,
"Project Snow Cornice", Arctic, Vol.
1,.,
ENERGY EXCHA NGE THROUGH AN ANNUAL SEA ICE COV}"R'"
By
2
Peter Schwerdtfeger and E. R. Pounder SUInmary
A micrometeorological station was set up on the ice of Hudson Bay during the winters of 1960, 1961, and 1962 for
the study of the growth of sea ice. Conductive heat flux through the ice, radiative fluxes, wind profiles, and tem-perature profiles in the ice and air were measured. The most complete records were obtained in 1961. Energy flux
totals were computed for eight-day periods in February, March and April of tha t year. The first two balanced within about
5%,
but the theoretical and experimental methods used failed completely in April. During winter months radiation was the dominant mode of heat loss f'rom the ice cover. Only a sum...'l1-ary of results is being presented in this Technical Memorandum, full dete.ils of techniques and observa tions be:i.ng available in a. Defence Research Board report (Sch'Nerdtfeger and Pounder 1962) •During the period of rrrowth of an ice cover, heat is released at the lower surface as water freezes. This heat is conducted to the upper surface 8S a heat flux Q;" and dissipated to the atmosphere as radiative flux
(Qr)'
con-vective heat loss (Qc), and loss by mass transport (Qe). Over any period of time, theoretically(1)
and a comparison of the values of the two sides of this equation computed from the observed data gives information on the accuracy of the measurements and on the reliability of the theoretical equations used in computing the fluxes. The sign conventlon adopted for the various fluxes is that a
Q
is positive if the ice gains energy.The measurements were made on a sea ice cover to study its growth. Since the thermal properties of sea ice are variable in time, the conductive flux was measured by ヲイ・・セゥョァ
into the sea ice a plug of fresh water ice of known thermal conducti vi ty, and observing the tempera ture gradient in i t . A discussion of this type of heat flux meter is given else-where in this Technical Memorandum by Laneleben. The average error in the measurements made on Qg is estimated to be
8%.
1 Contribution from the Ice Research Pro ject, Department ofPhysics, McGill University, Montreal.
2 Present address: Department of Meteorology, University of Melbourne, Melbourne, Australia.
11
-The t'Bdiatlve flux Qr was measured with 8 Beckman and
Whitely net イY、ゥッュセエ・イN It was not possible to make correc-tions for errors in this instrument cBused by wind speed or by its imperfect response to radiation incident at large
angles ("cosine-law" error). For technical reasons, measure-ments of radiation 。ョセ of the various temper8tures were made on a sampling 「。ウゥウセ readings being recorded once every two hours. Wind speed, at two heights above the snow surface, was recorded continuously. The flux Qc was calculated from wind and temperature readings using an equation of Halstead (1954> which gives only the turbulent flux. The effect of pure bUOy-ant convection was expected to be small in the win<1y area of Churchill, but i t may have been significant in April.
Evapora-tion and condensaEvapora-tion were computed through the use of part of an equation of Hofmann (1956). The part which was ignored
(for lack of dl:lta on the humidity profile) was undoubtedly irnpor tant in April.
Resul ts
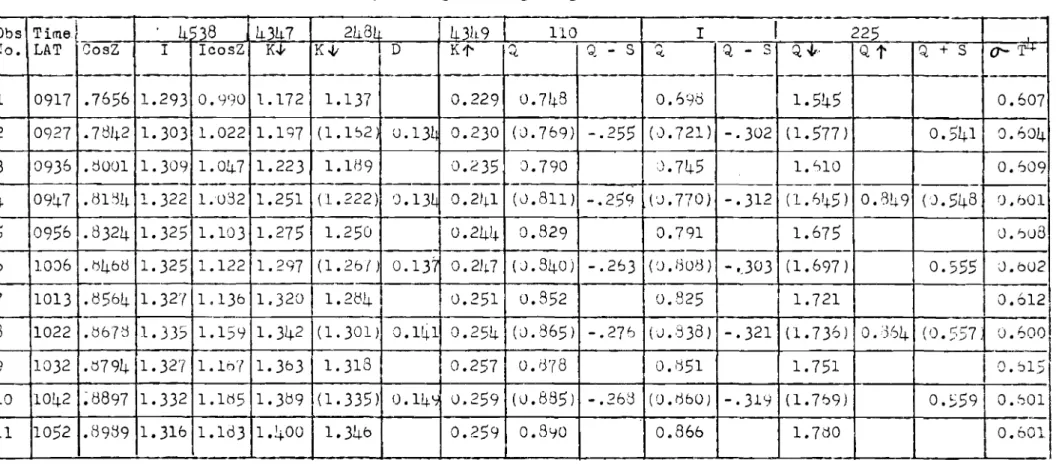
Computed data for the three eight-day periods are shown in the table. All fluxes, except the totals, are in calories cm- 2 day-I. The dates (coded as 19F for February 19, etc.) are all in 1961. It will be noted that the conductive flux
is summed for a different period of time than the "surface" fluxes. This is because Qg was measured below 20 cm of ice and a snow cover of from 40 to 70 em. Allowance had to be made for the time delay in the conduction oi' heat from the fluxmeter to the snow surface.
Table Calculated Heat Fluxes in Selected Periods
Date Q g Qr Qc Qe Qr + Qc + Qe 19F -46.0 20 -45.3 -23.1 -9.4 -4 21 -45.8 -42.0 -2.1 -1 22 -4ti.4 -36.8 -5.9 -2 23 -48.2 -25.3
MSNセ
-6
24 -35.3 -6u.tj -+9. +5 25 -2<.).5 0 -18.3-7
26 -26.1 -0.4 -22.9 -6 27 -40.0 ⦅セNX +3 -324.6 -228.4 -61.0 -18 -307.412
-Table - continued Date Qg Qr QcQ
e Qr +Q
c + Qe10M
-27.8
11
-24. 1
-52.8
-26.5
+7
Qセ-23.7
-47.H
+u.2
+b
13
-25.4
- 6.3
+21.2
-4
14
-22.1
-47.0
-52.U
+6
15
-1')·4
-53.7
+tl.5
+8
16
-14.7
-33.4
-1.5
+5
17
-17.3
-18.1
+15.4
+1
18
-13.9
-ts.5
+1
MQWTᄋセ-273.0
-43.5
3u
-2tlb.5
3A
MYNセ4
-8.
5
-9.1
4l.J.7
MRWNセ-14
b -tj.635.8
+ts.
-12
7
-8.6
22.8
+1.7
-8
8-b.t}
6.6
+36.0
-3
9
-tj.3
7'1.9
+1'( . 3
-22
10
-3.3
48 .3
0-15
11-17.9
+tl.7
+3
12
6.2
-10.8
-3
-68.7
231.4
+34.3
-74
+191 .7
13
-For the Februl;try period, the total "surface" flux is
seen to be UNSセセ lower than tne conductive flux. The agreement is encouraging even though some compensating errors must be involved since none of the instruments have accuracies tnis high. For the March period, the balance recorded by the
instruments was upset by surface flooding of the ice with subsequent freezing. Observations on the thickness and density of the new snow ice formed permitted a rough cal-culation that about 100 cal cm-2 of additional heat was released in this way. If this is added to Qg, the energy balance is accurate to
S%
or better.The complete "imbalance" of the April results (Qkg and the surface fluxes have opposite signs) is attributed to
the neglect of buoyant convection and, probably more important-ly, to a failure to compute evaporation successfully. During this period, the snow cover ch9nged visibly in texture and density and the evaporative losses must have been much higher than calculated. Direct measurement of tne humidity profile is evidently necessary under these conditions.
This work was supported by the Defence Research Board through D.D.P. cッョエイセ」エウ GC.b9-9UOl09, -uoul05, and -lvUl08 and by a National Research Council grant A-tl20. Special acknowledgment must be made for the support provided by the staff of the Defence Research Northern Laboratory.
REFERENCES
1. Halstead, M. H. 'rhe fluxes of momentum, heat, and water vapour in micrometeorology. Johns Hopkins Univ. Pub. in Climatology VII, No.2, 326, 1954.
2. Hofmann, G. Verdunstung und Tau als Glieder des
wセイュ・ィ。オウィ。ャエウN Plantae Archiv. fUr Wissenschaftliche Botanik, 47,303,1956.
3. Schwerdtfeger, P. and E. R. Pounder. Energy exchange
through an annual sea ice cover and the thermal properties of sea ice. Report S-10 from the Ice Research Project, McGill University to the Defence Research Board, 1962.
ICE GROWTH RATES AND HEAT EXCHANGE
..
.-By
G. P. Williams
In a recent paper (1) probability charts were developed for predicting the rate of growth for lake and river ice for different regions in North America. These charts were devel-oped by statistical analysis of available, ice thiclmess
records. In this paper this statistical record of ice growth rates has been used to est.imate average monthly heat losses from ice surfaces and to relate these heat losses to the radiative, convective and sublimative components of the surface heat transfer.
The purpose of the analysis was to define, by analytical means, the limits within which daily and monthly values of ice growth rates, net heat loss and the associated 'components of the heat balance parameters are likely to fluctuate. It is considered that a knowledge of these limits will be of value to those attending this symposium and particularly to those concerned with the difficuLt task of measuring heat losses from ice covers under field conditions.
Estimating Net Heat Loss by Ice Growth Analysis
Two sources of ice thickness records were used:
Ryder's study of ice thickness on lakes and rivers in the Northern Hemisphere (2), and a recent compilation of ice
thickness measurements made by the Meteorological Branch of the Department of Transport (3). Details of the analysis procedure used to classify these ice growths according to geographical region, ice thiCkness, snow cover were given preViously (l).
The recorded bi-weekly ice growth rates were converted to heat loss in cal./sq.cm./24 hr. (assuming a heat of fusion of 80 calories per gram). "rhe heat loss rates were divided in 9 class intervals, ranging from 0 to 30 cal. /sq. cm./2l.J. h:[". to greater than 240 cal./sq.cm.124 hr., and frequency dis-tributions were plotted.
Figure 1 shows the distribution curve for all freshwater lakes and rivers, and the distribution curve for all salt-water observations. The rate of heat loss from natural ice covers, during the winter ice formation period, falls within well-defined limits. The upper limit is about 200 - 250 cal./sq.cm./24 hr. (equivalent to 2.5 to 3.1 cms. of ice growth/day for a two-week period).
IS
-The heat or fusion ror salt-water ice was assumed to be the same as ror fresh-water ice. As the heat or rusion of salt-water ice is less than fresh water, i t might be expected that the distribution curve for salt-water should be displaced toward the higher rAtes of heat loss. The distribution curves shown in Figure 1 do not, however, separate ice growth rates according to region, ice エィゥ」ォョ・セウ or snow depth, a difreren-tiation that is necessary for proper interpretation of these records.
Additional frequency curves were made in which the heat loss rates were separated according to region, initial ice
thiCKness, and snow depths. For these frequency curves, the heat of fusion of sea-ice was arbitrarily assumed to be
15
per cent less than that of fresh-water ice. It was considered that this would be more realistic than assuming the heat of fusion of salt-water ice to be equal to that of fresh water ice.
Figure 2 is a comparison of the results of the frequency analysis. In order to compare several frequency curves on one drawing, a diamond-shaped diagram has been used to represent a frequency curve. The top of the diamond represents the value which is exceeded 10 per cent of the time, the lower point is the value exceeded セo per cent of the time, and the middle of the diamond represents the median or
50
per centvalue.
Figure 2a
&
b illustrates that there is a gradual de-crease in the rate of heat loss as the ice cover thickens, a decrease tha t is most apparen t for the sea-ice observations.Figure 2c shows that, for the initial ice thickness range 0-10 inches, the median rate of heat loss, and upper limits tend to increase gradually with increasing latitude. The rate of ice growth and related heat loss do not show a marked increase with latitude because, in the far north, freeze-up occurs during September whereas in the far south freeze-up occurs in early December under comparable weather conditions.
Figure 2d illustrates the marked effect of snow cover on heat loss. The upper limit (10 per cent of the time), for average snow cover depth or 2 inches during a two-week perioct, is about
175
cal./sq.CDl./24 hr., more than double the upper limit for snow cover depths 6 inches or greater. Occasionally deep snow cover can accelerate ice growth rates when the snow cover is floojed and the resulting slush freezes. The typeindicate that this effect is not frequent in Arctic and Sub-arctic areas, where the snow cover on ice is comparatively shallow, particula rly rela ti ve to the ice thic kness.
Monthl セ・エ Heat Loss Com ered to Com onents of
He9t ';xcha nge
The average monthly rate of ice growth, converted to cal./sq.cm./24 hr., for the ice I'orIllBtion periods at differ-ent latitudes was calculated from the records available. The period of ice growth was assumed to vary from
3
months, at latitude UPセ to8
months; at latitude WPセN Averege values for short-wave radiation were calculated for different lati-tudes using the results of Mateer (4). The net heat gained by short-wave radiation was estimated by assuming a value of 60% for the albedo. The sum of monthly short-wave radiation absorbed and the heat associated with ice growth was assumed equal to the hent loss at the surface due to convection, sublimation and long-wave radiation.Monthly values of sublimation loss for different lati-tudes were calculated with Penman's formulae
(5)
and using records of air temperature and air vapour pressure for differ-ent lati tudes (6). The net heat loss due to convection and long-wave radiation was then estimated by subtracting the calculated sublimation losses from the sum of short-wave radiation and heat associated with ice growth.Figure 3 shows the calculated monthly values during the ice formation period at different latitudes. The heat re-leased by ice growth decreases with increasing ice thickness, averaging from 40 to 70 cal./sq.cm./24 hr. The short-wave radiation absorbed varies from zero during mid-winter months in the far north, to 100 - 125 cal./sq.cm./24 hr. late in the ice-formation period. Calculated sublimation loss varies from about 10 - 40 cal./sq.cm./24 hr., tending to be at the lower values during the colder months in the higher latitudes. Combined convective and long-wave radiative loss varies from 50 to 130 cal./sq.cm./24 hr. with the smaller losses taking place during the mid-winter months. With the records
avail-able for analysis i t is not possible to make precise calculations. These monthly calculated values are, therefore, intended to
be only a guide. For any givon month or site there might be considerable deviation from these calculated averages.
Daily and Monthly Variations Rt One Site
In the preceding analysis, variations in bi-weekly heat losses from ice covers and mean monthly values for heat losses for different latitudes were presented. In this part of the
17
-report, daily and monthly variations in ice growth rates,
variations in the weather elements tha t affect ice growth, and the related components of the heat balance are investigated for Ottawa (1a ti tude 45 ON) for the month of December. Though
this part of the analysis is for one station during a parti-cular month, a similar analysis could be made for any region where ice sur1'aces are exposed to variable atmospheric weather conditions.
Daily and monthly variation in the weather parameters that most affect heat loss from ice covers were obtained from standard met90rological records available. In the case of albedo, records were not available and the variations were therefore estimated. Figure 4 shoWS the estimated range in values for incoming short-wave radiation, albedo, air tem-perature, air vapour pressure, wind velocity and snowfall. A diamond-snaped diagram is used to define the upper limits
(exceeded 10 per cent of tne time) and lower limits (exceeded 90 per cent of the time) as a percentage of median values. For example, in the analysis of 10 years of short-wave radia-tion records at Ottawa, the monthly values varied from a lower limit of 100 cal./sq.cm./24 hr. to an upper limit of 150 cal./ sq.cm./24 hr; approximately + 20 per cent of the 10 year medium. On a daily basis, incoming snort-wave radiation varied from
45 to 200 cal./sq.cm./24 hr., approximately + 50 per cent of
the median.
-Using these upper and lower limits of daily and monthly values of weather elements, corresponding limits for daily and monthly variation in ice growth rates, net short-wave radiation, sublimation and combined long-wave radiation and convection were calculated. A comparison of these calculated values is shown on Figure 5. Heat gains, or melting in the case of ice growth, are plotted as negative values.
The variation in the short-wave radiation absorbed was calculated by assuming values for albedo. ranging from 40 per cent for an old ice surface up to
es
per cent for a new snow surface. It was assumed that the lower limit of in-coming radiation could coincide with a high albedo, and the upper limit (high incoming radiation) could coincide with alow albedo.
The variation in sublimation was calculated by using Penman's l'orrnulae and using the range in air vapour pressures obtained from the weather records. The wind velocity was assumed constant at 5 m.p.h., and the vapour pressure of the surface was assumed constant at 5.0 mbs. If variations in wind velocity and surface vapour pressure had been used, there
would have been a greeter difference between upper and lower limits for calculated sUblimation.
Values for combined long-wave and convective heat losses were calculated by assuming these heat losses proportional to air-surface temperature differences according to a simplified formulae (7). The surface temperature was assumed constant at RQセ and the wind velocity assumed 」ッセウエ。ョエ at
5
m.p.h.The range in daily heat losses was obtained by taking the algebraic sum of the calculated limits for short-wave radiation absorbed, sublimation and combined long-wave and convection. The range in monthly heat loss was obtained from the measured values shown in Figure 1.
The purpose of these calculations is to show that daily variations in heat loss from ice covers are likely to exceed by several times the monthly or bi-\oleekly variations. In any 24-hour period when extremely cold dry air moves over ice covers with a surrace temperature clos e to 32 OP, high ra tes of heat loss will result. In the reverse situation., warm air with temperatu.res about 320fi' can produce mel'ting. As a result, jaily heat exchange at an ice cover can probably fluctuate between a loss of 3UU to 400 cal./sq.cm./24 hr. to a gain of 100 to 200 cal./sq.cm./21+ hr. at Ottawa during the month of December.
Energy Balance During Ice Formation, December 1960 - Ottewa In this section of the paper, some measurements of ice growth rates taken in a small tank, at an Ottawa site in December 1960 are compared with calculated ice growth rates
to verify that the formulae used previously to calculate ahort-wave radiation, sublimation and combined long-wave radiation and convection are reasonably accurate.
Air vapour pressure, air temperature, ice surface tem-perature and incoming silortradia tion were measured at the si te. Using these records, and formulae used previously, sublimation, convection and long-wave heat losses were cal-cula ted. The percentage of the measured short-wave radla tion absorbed was estimated by assuming values for the albedo. The algebraic sum of these heat exchange components was
assumed equal to the total heat loss from the ice cover. The calculated and measured heat losses are compared in Figure 6. The fluctuations in the measured ice-surface and air temperature are also plotted in Figure 6.
The average calculated values of ice growth (converted to heat loss) agreed reasonably well with the measurej rate of ice-growth averaged over 2 or 3-day periods. The average
19
-rate of heat loss was over 200 cal./sq.cm./24 hr. for the seven-day period (an average rate of ice growth of about 2.S cm./day). This comparatively high rate of heat loss is near the' upper limits of the heat loss frequency curves shown in Figure 1. However, during the next three weeks, the weather was relatively mild with frequent snow, so that over 90 per
cent of the December 1960 monthly ice growth occurred in the 7-day period, December 7 - 14.
Suwnary
Frequency distributions of measured ice growth rates show that average monthly heat losses from natural ice covers during the ice formation period varies from a lower limit of about 25 ca1./sq.cm. /24 hr. (exceeded 90 per cent of the time)
to an upper limit of about ISO cal./sq.cm./24 hr. (exceeded 10 per cent of the time). Heat losses from ice 」ッセ・イウ during the ice formation period gradually decreases with increasing
ice エィゥ」ォョ・ウウセ and increase slightly with latitude. Snow
cover has a marked influence on heat loss, the upper limit for average snow cover depth of 2 inChes or less (175 cal./sq. cm./24 hr.) is about double the upper limit for snow covers 6 incnes or greater.
Calculated monthly average sublimation losses vary from about 10 to
uO
ca1./sq.cm./24 hr. during the ice formation period. Combined monthly convection and long-wave radiation heat loss varies from5u
to 130 cal./sq.cm./24 hr. with thesmaller losses taking place during the mid-winter months in the higher latitudes.
It is shown that values for daily heat loss from natural ice covers are much more variable than average monthly heat loss values. Calculations and measurements made for one site, ottawa in December, indicate that the daily heat exchan&e can fluctuate from a loss as high as 300 to 400 cal./sq.cm./24 hr. to a heat gain of 100 to 200 cal./sq.cm./24 hr.
In conclusion, i t can be stated エィセエ becausfrof the vari-able nature of Ice growth and related weather ー。イ。ュ・セ・イウL
it
will be exceedingly difficult to measure or calculate these variables accurately on a daily basis. On a monthly basis, heat losses from ice covers and values for the different components of the heat exchange can be estimated with good practical accuracy from a statistical analysis of ice growth rates and appropriate calculations.
REFERENCES
1. Williams, G. P., Probability Charts for Predicting Ice Thickness, The Engineering Journal, Volume 46, No.6,
June 1963.
2. Ryder, T., Compilation and Study of Ice Thicknesses in the Northern Hemisphere. New York, American Geographical Society, June 1954.
3. Canada, Department of Transport, Meteorological Branch, Ice Thickness Data for Canadian Stations. Circular No. 3537, October 1961.
4. Mateer, C. L., A Preliminary Estimate of the Average Insolation in Canada. Canadian Journal of Agricultural Science, Volume 35, p. 579 - 594, November, December 1955.
5. Penman, H. L., Evaporation: An Introductory Survey, Netherlands Journal of Agricultural Science, Volume 4, No.1, February 1956.
6. Thomas, M. K., Climatological Atlas of Canada, Meteor-ological Division, Department of Transport, Division of BUilding Research, N.R.C., December 1953.
7. Williams, G. P. and Gold, L. W., The Use of Dust to Advance the break-up of Ice on セ。ォ・ウ and Rivers - Paper
to be published in Proceedings of the Eastern Snow Con-ference, February 1963.
-
21-50
r---r---,r---,r---,r---,r---,r---,----,-..., w40
::!: - I--lJ...30
o I--Z20
w u a::: w10
a...SALT WATER (1065 OSSJ
FRESH WATER
(858 OSSJ
o
-10-
130-160-190-1120-[150-1180-1210-1
30
60
90
120
150
180
210
240 240
>
CALORIES / SO CM /24
HR (2 WEEK PERIOD)FIGURE I
FREQUENCY DISTRIBUTION OF ICE GROWTH
RATES CONVERTED TO HEAT LOSSES
I t--.) セ I SNOW COVER ) 6 INCHE
ARCTIC AND
SUB- ARCTIC
SNOW COVER ( 2 INCHES°
セ Z 0:: W セ en <J: wFRESH
WATER
セ z <J: U セ en w 3 CD ::::> if) I I I 0 0 0 0 0 0 Io
b
CD u=>U ⦅・ョセ u セ -( J 0 U セ 0::Z cr:: U <t<t<J: cr:: <tSALT
WATER
-o
¢ I-o
0 C\J ¢-o
C\J Io
SALT WATER
-
o
¢ Io
C\JMEDIAN
MINIMUM 10%
o
( ICE THICKNESS RANGEo
<:>
C\J ¢FRESH WATER
LEGEND
MAXIMUM 10%
250
o
200
a:::
:r: セ (\J'----. 150
セ uo
en
"-.. 100
en
w
a:::
o
.-.J5
50
FIGURE 2
A COMPARISON OF RATE OF HEAT LOSS FROM ICE COVERS
45° - 50° N
50°- 60° N
60°-70°
N
70°
N
150,
•
i セ SHORT - WAVE RADIATION -I ABSORBED(50
% ALBEDO) -8 MONTHS SEPT l AVERAGE ICE GROWTHOCT
6 MONTHSセnov
4 MONTHS r-! NOV 3 MONTHS Q: :r100
I-Clセ
50
セゥャャljャjjlセャャゥjャャゥ⦅ャゥャャゥャャセ]]
__
キセZZAZ ( . ! : l - U« «
Q: (.!:l 0 0 (I)セ
I- "'" «セ セ
100
I-::c Ci:o
:i
50
I-U OL...-....L.L...I....L...-_ _.I..l-1-.L..L...-_ _---'-..L..L.-..L.L....L.._ _セ⦅NNNiNNiNNNiNN⦅NlNNNN⦅ ______'150
i . , I セ \).) I SUBLIMATION LOSS-1
COMBINED CONVECTIVEAND LONG - WAVE
-I RADIATIVE LOSS
50
t-n
frM
llitnm I
I
o
LcillL...----...J.D:flJ---50
I-100I-100
I-a:: ::c v N iMセ wHャIセ ( . ! : l O U«
...J 0 Q: (I) W I- "'->«
"-«
W (I) ::c W a::o
...J«
UO'
1111 II I I ! " " " ' " " " , , ! , ,FIGURE 3
ESTIMATED AVERAGE MONTHLY HEAT LOSS AND GAIN FROM THE SURFACE
OF NATURAL ICE COVERS DURING fCE FORMATION PERIOD
セ
MEAN
I
122
セ VALUES
CAL/SO CM/24 HR65
PERCENT
20°F
3·5
MBS
9·9
M·P·H
18·4 INCHES
SNOWFALL WIND VELOCITY AIR VAPOUR PRESSURE AIR TEMPERATURE ALBEDO INCOMING SHORT-WAVE RADIATION
+100
+ 50
o . (
•
!
"
Y,
1
,
Hセnthly
1
I- 50
fMONT:LyJ
f'o,..) セ(
I DAILY-100
>j :::I: t-Zo
セ セo
c:: lL. zo
l-e:[ > LU o t-Z LU U c:: LU a..FIGURE 4
ESTIMATED MONTHLY AND DAILY VARIATION IN WEATHER
ELEMENTS, MONTH OF DECEMBER, OTTAWA
278(,-4-300
J-
I
セ ,I ::I: " t-- >-Z --l,
,
0 <t'I
セ 0It
200
: I
0::, I
::c I , c;;t,
,
,
,
C\J I I--セ
セ
!
H
N セ100
I
'"
uI
L-J
l 0 セ en!
--
0
I
CJ')I
w -a:::t
0I
...J <{ u-100
-200
ICE GROWTH
SHORT-WAVE
RADIATION
ABSORBED
SUBLIMATION
LONG - WAVE
RADIATION PLUS
CONVECTION
FI GURE 5
MONTHLY AND DAILY RANGE IN VALUE OF DIFFERENT
COMPONENTS OF ENERGY EXCHANGE IN DECEMBER,
-
26-,SURFACE TEMPERATURE
/
o
40
⦅MセMMMLNMMMMLMMMLMMMMイMMMイMMMNNLNNNMMNLNNMMMMMML30
20
10
LL o -W 0::: :=>I-«
0:: w 0-セ WI-0:::
SHORT - WAVE RADIATION
:r:
"""
+/00
N--
セ0
ua
en-100
----
en w-200
-0::: 0 ...J-300
CONVECTION)
«
uICE GROWTH RATE
CALCULATED
8
9
10
II
12
13
14
15
DECEMBER 1960
0::: :r:"""
0
N--
セ100
ua
200
en--
en w300
-0::: 0 ...J400
«
u7
FIGURE 6
ENERGY BALANCE DURING ICE FORMATION
PERIOD DECEM BER 1960, OTTAWA
27
-OBSERVATIONS ON HEAT exchaセge AT AN OTTAWA SITE By
L. W. Gold
Paper to be submitted to Journal of Glaciology.
Summary
Observations were made at Ottawa on the heat exchange at a natural grass-covered surface, snow covered in winter.
It was found that the absolute magnitude of the average daily net radiation in winter was about one-tenth of its average daily value in summer. The average sublimative loss in winter was probably smaller than one-tenth of the corres-ponding evapo-transpirative loss in summer. The winter con-vective heat transfer was probably about one-third its summer value, but of opposite sign; net loss in summer and gain in
winter. .
In mid-winter, the average daily net heat gain to the snow surface in the daytime by radiation was about
30
cal/cm2 , the corresponding night-time radiative loss was about40
call cm2 • The net イ。、ゥ。エゥカセ heat loss for a whole day was, there-fore, about -10 cal/cm , about the same size as the day and night totals. Because of the magnitude of the daily netradiation, the accuracy to which i t can be determined is ver3· dependent on the accuracy with which the day and night totals can be measured. It is very difficult to measure net daily radiation at present in mid-winter in temperate regions with the accuracy required for heat balance calculations using radiometers now available.
It is considered that the average sublimative heat loss at the Ottawa site was about
15
cal/cm2 and that this occurred primarily during the aaytime. This heat loss rate correspondsto a maximum hourly rate of about
8
cal/cm2 hr. The averagewind ウーセ・、 associated with this mass transfer was about
65
x ャoセ cm/hr(4
mph) and air temperature about -10°C. The vapor pressure difference between the surface and thetwo meter level was between 0 and
2.5
mm Hg. This vapor pressure difference can probably be measured accurately enough for estimates of sublimation basej on empirical formulae of the Penman type, but the accuracy and speed of response of presently available instruments for measuring28
-on the applicati-on of the aerodynamic or ed3y-corre18ti-on
technique for measuring mass transfer under セゥョエ・イ conditions. This problem becomes more serious the lower the average air
tempcrDture.
The average convective heat transfer to the snow surface was about
-5
cal/cm2 in the daytime and 20 cal/cm2 at セゥlィエセThe former corresponds to a ュ。クゥュオセ rate of about
-3
callcm hr, and the lRtter to about 1.5 」。ャO」ュセィイN From field observations i t was found that the temperature gradient ゥセ the air at theエセNNLッ meter level juring daytime wa s 9bou t 10- °C per cm and
considerably larger at night. It is considered, therefore, tha t measuring the convec ti ve hea t transfer over a snoH surface by the aerodynamic or eddy-correlation technique should not be much more difficult than making the corresponjing observa-tions in sum..'ner, except for the addi ti ana 1 ins trument pro blems introduced by the colder temperatures.
Observe tions on the hea t ann mois ture tr,'H1S fer a t the earth's surface are undertaken usually for one of two princi-pal rea sons:
(a) to determine under natural conditions the s1ze of one or all of the components of the hea t transfer for applica tion to practical problems such as estimating evapo-transpiration or evaporation losses, predicting date of freeze-up of Inkes, rivers or ocean areas and ーイ・、ゥ」エゥセァ ice growth rates and ice thickness;
(b) to obtain informa tion on the vBrious processes by r,.rhich heat and mass are trDnsferred, and the relationship between
these processes and the occurring '...,eather.
When applying knowledge on heat and moisture transfer at the earth's surface to practical problems, the lnterest is usu811y in the avera ge exc Ita nge tha t occurs dur ing rer iods of one day or longer. :-lhen studying the transfer processes, the interest is usually in instantaneous values of the heat and moisture flow 8nd components of the weather.
aャエィッオセィ considerable progress has heen made in
under-standing the transfer processes, and in developing techniques and instruments for measuring for short periods the values of the components of the heat exchanS8, the progress in applying this knowledge to measuring the average value of the components for periods of one day or longer, has not been so encouraging. Difficult problems associated with the physics of the heat
transfer process and the analysis of' the observations have still to be solved. In adjition, past experience has shown
29
-tha t to use the ins tru.."1lents and techniques devel.oped in the study of the transfer processes to determine average values over long periods, is usually time-consuming and expensive and requires considerable skill in instrumentation. As a consequence, those concerned with calculating for practical application the values of the components of the exchange over long periods, normally use a semi-empirical approach in which the average values of the heat and mass transfer are correlated with average values of the appropriate weather elements. This approach was used in the investi[ation at ottawa along with direct observations, with emphasis placed upon obtaining field experience with available instruments and techniques. It was possible to establish approximately the average summer maximum and winter minimum values of the components of the exchange, and their probable diurnal variation in winter. It is con-sidered that further development of techniques and instru-mentation is necessary before the components of the exchange can be measured in winter with the 。」」エセ。」ケ required for
heat balance determinAtions. In this development work, care-ful attention should be given to the experience and knowledge obtained from studies of the heat Xョセ mass transfer processes.
MORNING SESSION DISCUSSION Dr. Orvig
Dr. Longley
M'r. Gold
I have often wondered whether.the losses by evaporation from a snow cover during a chinook are large. As Dr. Longley is from Alberta, I would ask him to comment on this.
I have no information on this, but I would like to ask Mr. Gold why, in his graph, the time of minimum air tempera ture doe s not coincide wi til the time of zero radiation.
Our observations for the Ottawa area do show that the time of minimum air temperature does almost coincide with the time of zero net 'l"adia tion.
Mr. Williams In answer to Dr. Orvig's question, I w01lld suggest tha t much of the di sappearance of snow during a chinook is due to consolidation and melting of the snow pack. As i t requires
approximately セo calories per gm. to melt ice compared to 675 calor ies to sublima te i t , the mass of ice melted is usually large compared to the mass evaporated. it[hen the snow-rnelt per iod is short, such as dur ing the chinoo k condi tions reported by Hoover-::-,
-:l-Hoover, O. H., "Effects of Chinook (Foehn) hfinds on Snow Cover and Runoff", In l.U.G.G.I.A.S.H., August, 1941).
evaporation should be tnLlcb less than sno'N-melt. The only time '..:hen sno'..: evaporation amounts might be 」ッュー。イセ「ャ・ to snow-melt, is when the snow-melt period is extenaed over several weeks. Mr. Latimer In regard to radiation calibration, I would like to report on
a
calibration technique which uses an integrating sphere. We heve founa thatinstruments calibrated by this technique have maintained their calibration within one-half
of one per cent over a period of a year. Each radiation-instrument has some disadvantage, and the choice of instrument for a particula.r
job will depend on what the instrument is to be used for. :,<[i th the Kip?, one gets a "cusp" effect, and one can also [et some peculiar effects with the Eppley. There is also always
the difficult problem of correctinc for cosine error.
Dr. Hitschfeld I have two questions to ask セイN Gold regarding the use of Fourier analysis. Did he have any particular purpose in using thiR type of analy-sis, and vJh3t 'Nfls the magn i tude of the third
and fourth he rmonic.
Mr. Gold The purpose was to describe the observations in
a sim?le analytical way. We are ッ「ウ・イカャョセN 8S
well, ground temperRtures at various depths below the surface. We wish to relate our ground tem-perature observations to the observations that we have made above the surface. At this time, we are analyzing our observations using the
Fourier technique, and will look for correlations between Fourier components with the same period. The third and fourth Fourier components were not worked out. I do not anticipate that their amplitude will be very large, but we will check this, pa r ticula rly wi th the ground tempera ture observations.
Dr. Hitschfeld I would say the second harmonic is not very interesting unless the third and Fourth are small. The second harmonic seemed to be about 1/30 from your graphs. For a yearly study, all that you might require is the first harmonic. Dr. Munn informed the audience that 8 tower recording wind
velocity and air temperature profiles for pollution studies was now being set up on the
NRC
grounds, and invited エィセ participants to look at the instrumentation.31
-THE ACCURACY OF TOTAL RA:nOMETEH9
By
J. R. La timer .:.. SUffi:r1a ry
Two radiometers are surveyed, a Suomi Model ventilated net radiometer and a Funk Model polyethylene-sheilded radio-meter. Both instruments have been investigated during field and laboratory tests. At present, the ventilated raJiometer would appear to be the more suitable, provided the user can accept periods of missing data, caused by wind and weather. The shielded radiometer could be improved by sacrificing the high response in favour 01' a lower output and shorter time constant; and providing forced ventilation of the polyethylene hemispheres.
1. Introduc ti on
An ideal total radiometer is one responsive
to
hemispheric radiation of all wave-lengths of meteorological interest, that is from about
0.3
micronsto
beyond30
microns. Total radiometers can be conveniently classified as:(a) those measuring effective radiation flux at a horizontal surface, either upward or downward faci.ng; and
(b) those measuring net flux of radiation through a horizontal surface.
The total radiometers surveyed are a ventilate1 net
radiometer, patterned after the Suomi (1) Model anj manufactured by the Meteorological Service of Canada; and polyethylene-shielded net and effective radiometers, patterned after the Funk (2) or CS IRQ (Com.l'noDVreal th Sc ien tific and Indus trial Research Organi-zation) Modelanj manufactured by ll!liddleton & Co. of Australia. 2. Field Testing
Field tests are useful in that they provide simul-taneous data from a group, or set, of ゥョウエイオセ・ョエウ under similar exposure conditions. The comparison should be designed to
indicate:
(a) relia bili ty, tha t is the degree of dif ficul ty experienced in maintaining the instrument in a satisfactory manner under operating conditions;
*
This paper is presented with the permission of the Director,(b) precision, or the variability or scatter of the data to be experienced under these conjitions; (c) accuracy, since the accuracy of the data can
only be estimated if a knO'N'n independent measure-men t of the flux of rHdi9ti on is 8vai Ie bie.
Care must be exercised in the interpretation of
field trial data. For example, when radiometers are compared, the following factors will, to a varying' degree, influence the quality of the data:
The first factor is the important one of calibration; the accuracy of the experiment can only be determined after
a complete assessment of the ins trumental standard and the method of calibration has been made. A history of subsequent s tandardiza tion vlill ,urovide dsta on ins trurne nt s tabili ty as well as establish confidence limits on the quality of manu-facturing and calibration.
The next factors influencing a comparison are the corr-ections made to the data. The precision, as well as accuracy, of the data is generally improved by application of appropriate correc tions for any 0 bscura tions to the l'ield of view, for
temperature variations, for variations in instrument level, and for effects of rain, frost, dew, etc., and microfluctua-tions caused by wind.
The last factor is functional compatibility, that is, certain features of the experiment may render the validity of a comparison as dubious, since laree differences in registra-tion can exist between radiometers because of differences in time constant, spectral responsef!, cosine response, the type of recording apparatus Dnd the technique of abstracting the data.
3.
The Ventilated Net RadiometerAn analysis of the behaviour of a ventilated net radiometer indica tes tha t one of' the important de sign fea tures is the ventilating system. The improvement incorporated in the Suomi Model is a ventilation adjustment control and heater winding that allows the forced convective heat exchange to be equalized on both sides of the thermopile plate.
This type of instrument has been tested in the Radiation Laboratory at Scarborough, as well as being sUbjected to
ex-tensive outside field tests. One of the best methods of comparison is one performed between essentially duplicate radiometers.
33
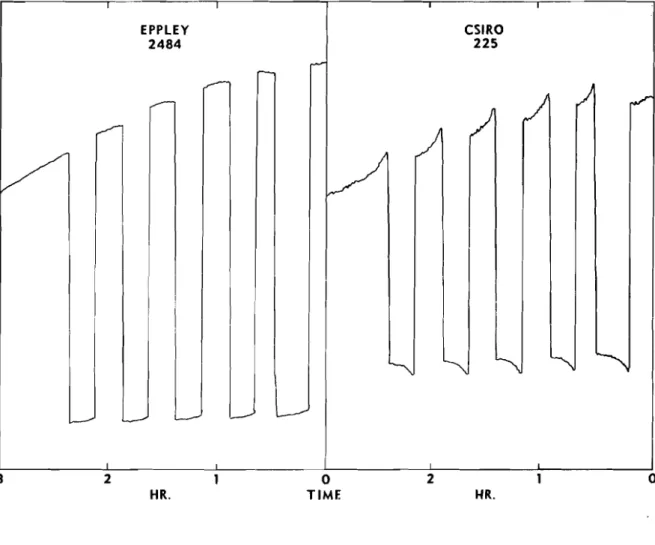
-A comoarison of カ・ョエゥQYエ・セ net イXセエッュ・エ・イウL Serial Eos. 1 and ti, キセ s condl;C ted 、セjイ ing .June 19j2. The :19エセ 3re s ,10Hn
in P :i.Sure l , '"r:1i eh is a typi cal sCG tエ・イ{Gセイ。ュ ot' hou r 1 y val ue s
of positive net raJiation as recoriej bJ エセBッ instru:'1ents under similar con1itions. The scatter of the inJiviJual values is an indication of the variability to be expecteJ. The line with unit sl.ope is drnwn for comparison.
Aside from the random error to be expected of all ex-perimental data, the only aJdition81 variability here is that produced by wind. The experiment was conducted. with both
instruments mour:ted six feet above a level grnss plot. The plot is loc a ted a bou t 150 fee t north of a s hart) セQイッー of 225 feet to Lake Ontario. A ventilated rndiometer is adversely affected at tnis site by winds from the soutn and east. In addition, aerodynamic ー・イエオイセ。エゥッョウ are caused by other in-struments and stands in the area.
Figure 2 ShOHS a plot of the sa:ne as tA, except tha t the individual values are classified in decndes and the means computed for each class. Again, the line 'ATith unit slope is drawn for comparison. Note tha t a non-linearl ty exists for low and negative values. Since the negative values of net radiation occurred after sunset, the instrmnellts were res-ponding to lone-wave radiation. Hence, the non-l.inearity of the plotted mC8ns can be attrLbutei.i, in some part to a differ-ence in the long-Have balance of the two instrurnenr.s. This differenc e could exi st sine e no a t tempt ws s n18de be forehand
to equalize the instrument response to both long セョ、 short-wave radiation and calibration \·18S conl'inej to the short-'..;ave
or solar spectrum.
Equalization of response to both lone-wave and short-wave rH:.1intion (;311 be made by re:JIJcirH':: the response of the
instrument in Lhe ellort-wave region. 'l'nis is accompllsned by painting a fraction of the thermopile surfoce with an overcosting of highly reflective paint
(3).
Tnis r.echnique wa s not used for the cons true tion of the l"ie teorolog:ica 1 Service experimental Suomi Eodel since equipment !'or 10n£;-wave investigation of the instrument was not available and further testing seemed desIrable.A calibration history of instrument No.1 was commenced in June 196u ana continues until r.he present. This instru-ment has been exposed continuously over this period, except for a few jAyS during July 1961, 'AThen A neH bloHer motor was
installed. '1'11e ventilation rate is now sliGhtly reducej. Solar calibrations have been conducted over this period. No signi1'icant change in instrument response can be detected in