CYCLING INFRASTRUCTURE AS A FIRST MILE SOLUTION FOR MASS TRANSIT ACCESS IN SINGAPORE -A STUDY OF MRT RIDERSHIP IN SINGAPORE TOWNS
By
Hengky Tay
Bachelor of Engineering (Civil) (Hons) Nanyang Technological University
Singapore (2003)
Submitted to the Department of Urban Studies and Planning in partial fulfillment of the requirements for the degree of
Master of Science At the
MASSACHUSETTS INSTITUTE OF TECHNOLOGY
ARCHIVES
'AASA( V rTh1rT1 "UTEL 17/
June 2012
© 2012 Hengky Tay. All Rights Reserved
The author hereby grants to MIT the permission to reproduce and to distribute publicly paper and electronic copies of the thesis document in whole or in part
A
of Urban Studies and Planning May 2 4' 2012
Certified by
Assdciate Pro or .Christopher Zegras Ford Career Development Associate Professor of Trais n and Urban Planning Thesis Supervisor
/74 /4
Accepted
by-Professor Alan Berger Committee Chair Department of Urban Studies and Planning Author
CYCLING INFRASTRUCTURE AS A FIRST MILE SOLUTION FOR MASS TRANSIT ACCESS IN SINGAPORE -A STUDY OF MRT RIDERSHIP IN SINGAPORE TOWNS
By
Hengky Tay
Submitted to the Department of Urban Studies and Planning On May 24, 2012 in partial fulfillment of the requirements
for the degree of Master of Science in Urban Studies and Planning
ABSTRACT
The first and last mile problem of public transport is an area of growing research interest as cities confront challenges to improve public transport alternatives to support urban activities. First and last mile solutions such as cycling are becoming increasingly popular in many cities around the world as a cheap and environmentally friendly solution. Investments in bicycling infrastructure provide cyclists and potential cyclists a safer environment to cycle to work and to public transit nodes. Singapore is also rolling out its National Cycling Plan with dedicated bike paths in residential towns and bicycle parking lots at Mass Rapid Transit (MRT) stations, hoping to use cycling as a potential first mile solution to encourage more people to cycle as a feeder mode for public transport.
This thesis provides a preliminary investigation of bike infrastructures as a first mile solution by examining MRT ridership during morning peak hours. A multivariate regression model predicts MRT ridership as a function of bike infrastructure variables, controlling for other modes of access, built environment characteristics, and socio-economic and demographic factors. The models find that bike paths connecting to and bike lots located at MRT stations in Singapore are statistically insignificant in explaining MRT ridership variation. This could be due to the infancy of the bike infrastructure resulting in poor bike-to-transit usage. However, a 'porousness' measure of walkability near the stations was significant. While there are limitations on the data and shortcomings in the approach, this research identifies many potential areas of further investigation into the first and last mile problem of public transport.
Thesis Supervisor: Chris Zegras
Acknowledgements
This thesis has been almost a two year journey right from the moment when I had to conceptualize it as part of my application to MIT. This journey has been extremely
rewarding and fulfilling and it would not have been possible for several people for whom I would like to express my unreserved gratitude and appreciation.
To Chris, thank you for your guidance and advice and for pointing me out to the right resources and persons. In the limited time that I have to complete this work, this was certainly much appreciated.
To Joe, thank you for agreeing to be my thesis reader and also for providing me with timely suggestions.
To Jae Sung, thank you for your time and effort to coach me on bootstrapping and also for your advice on the data analysis.
To my bosses and colleagues in URA, thank you for supporting my decision to pursue a postgraduate degree here at MIT.
To my family, thank you for the understanding and support through the year and also for all these years.
Finally, to my dear loving wife Li Theng, thank you for putting your own career on hold for the year and taking the time to be by my side and motivating me.
TABLE OF CONTENTS
1 Public Transportation and the First and Last Mile Problem...9
1.1 Background... 9
1.2 O bjective ... 11
1.3 Scope of Study and Organization ... 12
2 Literature Review ... 13
2.1 First and last mile of public transport - a definition ... 13
2.2 The first and last mile of public transport and its importance in the public transport trip chain... 15
2.3 Catchment Area of Transit Station and Station Access Modes...16
2.4 First and last mile solutions ... 22
2.5 Cycling as a first mile solution and as a feeder mode to transit...24
2.6 The role of cycling infrastructure and its impact on cycling levels ... 24
3 An Overview of HDB Towns and Public Transport System in Singapore...28
3.1 Population density and HDB public housing ... 28
3.2 Public Transport System in Singapore... 30
3.3 Payment of fares on public transport in Singapore - The EZ-Link automated fare collection system... 34
3.4 Getting to the MRT and first/ last mile problems in Singapore...35
3.5 Cycling in Singapore - the story so far ... 36
3.6 Park and Ride scheme ... 47
3.7 Summary of First Mile Solutions in Singapore ... 48
3.8 Focus on Morning Peak Travel Behavior ... 48
Figures
Figure 2-1 - D epiction of first and last m ile ... 15
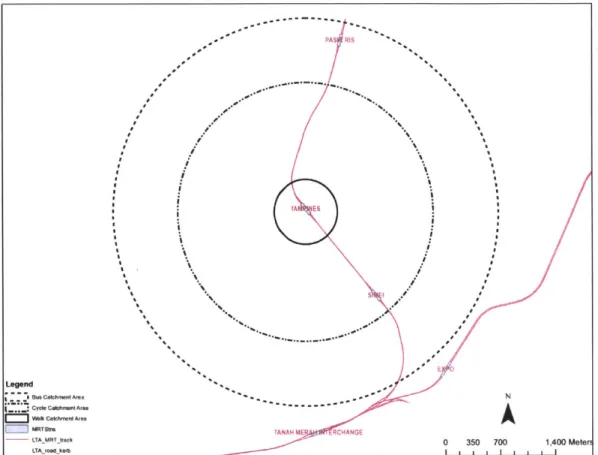
Figure 2-2 - 5-minute euclidean buffers of various modes around Tampines MRT Station...18
Figure 2-3 - 5-minute network buffers of various modes around Tampines MRT Station...18
Figure 2-4 - Declining public transport mode share with increase in access distance at home end and activity end in the Netherlands (Keijer & Rietveld, 1999) ... 19
Figure 2-5 - Access mode share distribution at home-end in Netherlands (Keijer & Rietveld, 1 9 9 9 ) ... 2 1 Figure 2-6 - Egress mode share distribution at activity-end in Netherlands (Keijer & Rietveld, 1 9 9 9 ) ... 2 1 Figure 2-7 - Access mode share distribution in Mumbai India (Rastogi & Rao, 2003) ... 22
Figure 2-8 - 2-way bike segregated bike lanes in Paris (Source: http://www.streetsblog.org/2007/03/29/should-dot-install-separated-bike-lanes-on-9th-street/).26 Figure 2-9 - Segregated bike lanes in Copenhagen, Denmark (Source: http://www.streetsblog.org/2007/03/29/should-dot-install-separated-bike-lanes-on-9th-street/).26 Figure 2-10 - Bicycle parking facility at Amsterdam Central Station (Source: http://cyclingwithoutahelmet.blogspot.com/2009/1 2/bike-parking-at-other-centraal-stations. html) ... 2 7 Figure 3-1 - Location of HDB Towns and Estates in Singapore (HDB, 2011) ... 29
Figure 3-2 - Changes in daily trip generation from 1997 to 2008 (Source: Choi & Toh, 2010) ...30
Figure 3-3 - Decline in public transport mode share from 1997 to 2008 (Source: Choi & Toh, 2 0 1 0 ) ... 3 1 Figure 3-4 - Singapore MRT system map (Source: SMRT)... 32
Figure 3-5 - Photo of MRT train at an elevated MRT station (Image source: Wikipedia) ... 32
Figure 3-6 - SBS service 157 stopping at a bus stop with passengers alighting (Image source: http://www.sgbuses.com/v/sbst/b7rle/SBS8030L-157.JPG.html)... 33
Figure 3-7 - EZ-Link cards (Image source: http://www.ezlink.com.sg/ez-link-card/)...34
Figure 3-8 - EZ-Link card reader on public buses (Image source: Google) ... 35
Figure 3-9 - EZ-Link card reader integrated with fare gates of MRT station ... 35
Figure 3-10 - HDB Towns under National Cycling Plan...38
Figure 3-11 - Photo of completed cycling path in Pasir Ris (Image source: MOT)...39 Figure 3-12 - Existing and proposed cycling network in Tampines Town (Source: Tampines T o w n C o u n c il) ... 4 0
Figure 3-13 - Existing and proposed cycling network in Pasir Ris Town (Image source: (LTA, 2 0 1 1 a ) ... 4 1
4.2 Selecting relevant MRT stations... 50
4.3 Dependent variable (Ridership at MRT stations) ... 54
4.4 Selection and measurement of explanatory variables ... 54
5 Findings and Analysis ... 65
5.1 Regression model specification and Estimations ... 65
5.2 Discussion of regression results ... 68
5.3 Im plications for first m ile connectivity ... 70
6 Conclusions...72
6.1 Lim itations of current research ... 72
6.2 Areas for future research... 75
APPENDIX ... 78
Figure 3-14 - Existing and proposed cycling network in Taman Jurong Town (Image source: (L T A , 2 0 1 1 )...4 2 Figure 3-15 - Existing and proposed cycling networks in Yishun and Sembawang (Image
source: Sembawang-Nee Soon Town Council)... 43 Figure 3-16 - Singapore Park Connector Network ((Graphic Source: Straits Times) ... 44 Figure 3-17 - Photo of a park connector (Eastern Coastal Loop) along a canal in Pasir Ris town
... 4 5
Figure 3-18 - PCN connectivity with MRT stations ... 46 Figure 3-19 - Bicycle parking facilities near Pasir Ris MRT Station (Image source: Panoramio)47 Figure 4-1 - Example of Type 1 (AM Peak) ridership pattern (Tampines Station) on 11 Apr 2011
... ... -. ---... 51 Figure 4-2 - Example of Type 2 ridership pattern (dual peaks) (Potong Pasir Station) on 11 Apr 2 0 1 1 ... 5 1 Figure 4-3 - Example of Type 3 (PM Peak) ridership pattern (Tanjong Pagar Station) on 11 Apr 2 0 1 1 ... ... - . --.. ---.-- .... ... 5 2
Figure 4-4 - Type of MRT stations and their locations in Singapore ... 53
Figure 4-5 - Photo of sheltered link through HDB public housing void decks (Image source: G oogle)... . ---... ---.. ----... . ---... . . . 56
Figure 4-6 - Shorter walking paths through HDB estates ... 56
Figure 4-7 - Woodlands MRT station integrated with bus interchange (Image source: Google) 58 Figure 4-8 - Jurong East MRT station integrated with bus interchange (Image source:
S tre etd ire cto ry .co m .sg )...5 8 Figure 4-9 - Lakeside MRT with connected bus stop (Image source: Google)... 59 Figure 4-10 - Kembangan MRT with connected bus stop (Image source: Streetdirectory.com.sg)
Tables
Table 2-1 - Modal Speed Characteristics ... 17
Table 2-2 - Access and egress mode shares for transit stations ... 20
T able 2-3 - First/last m ile solutions... 23
Table 3-1 - A comparison of gross densities of selected cities ... 28
Table 3-2 - Changes in population size and density in Singapore from 1980 to 2010 (Singstat, 2 0 1 0 ) ... 2 9 Table 3-3 - Cycling towns and their existing and proposed cycling infrastructure... 39
Table 3-4 - First mile solutions implemented in Singapore ... 48
Table 4-1 - Summary of stations according to types... 52
Table 4-2 - List of variables and descriptive statistics... 61
Table 4-2 - Correlation matrix between dependent and explanatory variables ... 64
I
Public Transportation and the First and Last Mile Problem
1.1 Background
Major cities around the world have some form of public transport network to meet the transportation needs of its citizens and support the myriad of activities that take place every day. In recent years, the growing emphasis for cities to develop in a sustainable manner has led to an increasing focus on the role of public transport and how it can also play a part in cities' sustainable development agenda.
In Singapore, the public transport system is made up of the Mass Rapid Transit (MRT), Light Rail Transit (LRT), public bus routes and taxi services. A hub-and-spoke model is adopted where buses and Light Rail Transit (LRT) serve as feeders to bring people to transfer hubs (i.e. MRT Stations or bus interchanges). Heavy travel demand corridors and long distance trips are served by the MRT and trunk bus services provide access to areas not well served by the rapid transit system (LTA, 2008)
With limited land resources, an important consideration for sustainable development in Singapore has been to make the best use of the limited land so that we can still
accommodate all the varied uses and support all the necessary activities for live, work and play without compromising the ability of future Singaporean generations to do the same.
According to the Department of Statistics (SingStat), Singapore's total land area stands at 714.3sq.km as of 2011 with an average population density of 7,257 persons per sq.km. (Singstat, 2011). In 2008, the Land Transport Authority of Singapore (LTA) published the Land Transport Master Plan (LTMP) outlying strategies for land transport development in Singapore up to the year 2020. In the publication, the amount of land dedicated to road space was reported to be at 12% and this was comparable to the total area dedicated to housing (which was about 15%). At the same time, the LTMP also reported declining public transport mode shares between 1997 and 2004. The falling trend was also observed in the latest Household Interview and Travel Survey (HITS) in 2008 (Choi & Toh, 2010). In order to preserve valuable land resources for the country to support other uses and activities, the demand for private transport and road space needs to be controlled.
In order to position public transport as a choice mode, one of the key proposals in the LTMP was to expand the MRT network from 175km as of end of 20111 to 278km by 2020. Doing so would allow more Singaporeans to have greater access to the stations and also relieve the congestion on the existing MRT. However, like other public
transport systems around the world, the public transport system in Singapore suffers from not being as efficient as the private automobile in providing individuals a flexible, single mode and "door-to-door" commuting experience. Journeys completed using the public transport mode requires commuters to switch modes at the connecting ends of the journey (i.e. between the origins to the station at the access end and between the stations to the destinations at the egress end). As a result, there could be disutility created from additional waiting and transfer times, service reliability and inflexibility that can erode the overall appeal of public transport.
The connecting ends of the public transport journey form what is known as the first and last mile of public transport. The problems associated with these connecting ends such as additional waiting times and service reliability issues are seen as the weakest links in public transport chain and strongly influence the availability and convenience of public transport (Krygsman, Dijst, & Arentze, 2004). Essentially, this constitutes the first and last mile problems (FLMP) of public transportation.
Cities around the world have tried various strategies to deal with the FLMP. In a report submitted to the Southern California Association of Governments (SCAG) in Dec 2009, Nelson\Nygaard Consulting Associates compiled a comprehensive list of first and last mile strategies to maximize mobility in the city of Los Angeles. These strategies include car sharing, car-pooling, taxis, short-term car rental, folding bikes on transit, and bike sharing programs (Nelson\Nygaard, 2009). In other parts of the world such as the Netherlands and China, cycling has been and still is an important part of the
transportation system. Other major cities like Paris and London are also jumping into the public bike sharing bandwagon with their respective bike share programs Velib and Barclays Cycle Hire.
In Singapore, FLMP solutions have been quite limited as the general public transportation policy depends largely on buses as feeders to the MRT system. However, in recent years, cycling as a recreational activity and also as a form of commute to work is becoming increasingly popular. This is seen in many cities like
Boston, London and Paris having their own bike share schemes. Responding to calls for more provisions for cycling in Singapore, LTA has included in the LTMP plans to
facilitate cycling by leveraging on existing infrastructure such as the park connector network to bring cyclists to transport nodes like MRT stations and bus interchanges where bicycle parking will also be provided. Since the LTMP, a major development in
planning for cycling is the launch of the National Cycling Plan in Feb 2009. Under this plan, $35 million will be spent to build dedicated cycling paths in 7 Housing
Development Board (HDB) towns to link commuters to transport nodes and major amenity centers (LTA, 2010a). However, the link between cycling provisions and its impact on public transport in Singapore is not well established. Given the public investment necessary and the amount of land space that cycling infrastructure will
require in land-scarce Singapore, there is a need to better understand the relationship, if any, between cycling infrastructure investments and increased public transport
accessibility.
1.2 Objective
The objective of this research is to understand the relationship between the first mile of a commuter's journey on the public transportation system and its impact on public transport ridership in Singapore. Specifically, it aims to reveal evidence of cycling as a first mile solution for Singapore's MRT. To do so, the following questions are asked:
Why is there a need to address the first mile issue?
What are the available measures of the first mile and what are the available metrics to measure public transit ridership?
What are the appropriate methods to establish a link between the two?
What relationship between the first mile and public transport ridership can be expected and how do these findings inform development of public policy and infrastructure investment decisions with regard to the first mile?
What are the limitations of the methods employed in this research and how might such studies be improved in the future?
1.3 Scope of Study and Organization
The MRT system forms the backbone of the public transport system in Singapore. While there is also the public bus system, buses play a subservient role and are viewed as a
system which complements the MRT. As such, this thesis will emphasize ridership on the MRT system as a measure for the effectiveness of first mile solutions.
As the proposals under the National Cycling Plan are essentially implemented within HDB towns and attempt to improve connectivity between homes and transport nodes, the thesis will focus more on aspects of the first mile instead of the last mile.
While first mile problems are associated with all forms of public transport trips, this thesis will also focus more selectively on trip making during the morning peak hour on a weekday as this is typically associated with the highest travel volume between homes and the MRT stations and where it may be more likely to observe the impact of first mile solutions. Another reason for selecting the morning peak hour is the government's use of morning peak hour mode share on the public transport system as a key performance
indicator and for target setting2.
A review of literature on factors influencing transit ridership and cycling as a feeder mode will be provided in Chapter 2. Chapter 3 provides an overview of the Singapore HDB towns, public transport network and recent developments in cycling. Research data and methodology will be covered in Chapter 4. Chapter 5 discusses the results from the regression models estimated to relate bicycling infrastructure and MRT ridership in Singapore. The chapter will also discuss the implications for planning for solutions to overcome first mile problems in Singapore. Lastly, Chapter 6 will conclude the research with a critique and provide suggestions for future directions in the area of first and last mile research.
2 Literature Review
2.1 First and last mile of public transport - a definition
First and last mile issues essentially refer to connectivity between public transport nodes and the user's origins and destinations. This connectivity issue exists because public transport service cannot be supplied at a level that is readily accessible and immediately available to the user at a level that is similar to the experience of having a car and being able to drive it at any time to anywhere. For example, at the current state of technology, it is inconceivable for a single metro system to stop at the entrance of every home or allow each commuter to alight at the doorstep of his destination. Users of public transport often have to find ways to bridge the divide between their destinations and public transit nodes. If bridging the divide becomes onerous for user, the appeal of
public transport to the user or potential users will decline.
Scans of current literature for definitions of the last mile often return with definitions of last mile in the field of telecommunications. These definitions often describe the last mile as the last leg of service connectivity to the end user. The actual distance of this final leg can be more or less than a mile.
In the context of public transport, the term "last mile" has been referred to from time to time and there is growing interest in this issue as researches seek to better understand its influence on public transit use. Yet, the current state of literature has not established an accepted common definition for first/last mile with respect to public transport
research. First and last mile issues are commonly studied in terms of access and egress trips to and from a public transport station. Martens (2004) referred to access trips as home-end trips and egress trips as activity-end trips. Krygsman et. al. (2004) also focus extensively on access and egress trips and their potential in reducing public transport trip times although they did not provide a clear definition. In exploring the role of the bicycle as an access mode, Rietveld (2000) referred also to entry and exit modes to a transit station with entry meaning access and exit meaning egress.
First and last mile definitions currently can also be inferred based on problems that have been observed and which solutions have been conceived. For example,
Nelson\Nygaard (2009) talked about first mile / last mile barriers for commuters who
"could potentially take transit but whose starting point or final destination cannot be conveniently accessed from the nearest transit stop/station due to distance, terrain (hills, street patterns), or real or perceived safety issues (traffic, crime)"
(Nelson\Nygaard, 2009). The inferred meaning for first and last mile in this statement relates to the ability or difficulty in connecting the commuter between his origin/ destination and the transit node.
The various definitions for first and last mile generally converge, revolving primarily around connectivity between homes or destinations of commuters to the main transit node. Building from the various precedents, I propose the following definitions:
First mile of public transport - In a journey originating from the home, the first mile of public transport refers to connectivity between the origin (home-end) of a
user's journey and the main public transport mode stop or station (see Figure 2-1).
Last mile of public transport - In a journey terminating at a workplace or other destinations, the last mile of public transport refers to connectivity between the
main public transport mode stop or station and the destination (trip-end) of a user's journey (see Figure 2-1).
User - Refers to any person using the public transport system for trip making
Main public transport mode - In a long journey using public transport, a main mode of public transport is the mode that the user relies on to cover the longest section of the journey. This mode could be by train or trunk buses or any
combination of the two (see Figure 2-1).
Adopting the above definitions for first/last mile has the following implications for this research:
The user's first mile commences from the time of his departure from his home and ends at the time of his arrival at the transport node where he transfers to the main mode. It includes the travel time, cost and experience (including waiting) associated with whichever mode used to access the transport node. It excludes i)
iii) his experience and time spent on the main mode as they are treated as a characteristic of the main mode which are independent of first mile factors.
The commuter's last mile commences from the time of his departure from the transport node to the time of his arrival at his destination. It includes the travel time, cost and experience (including waiting) associated with whichever mode
used to access the transport node.
Any forms of transport that function as feeder services connecting the user from his home/destination to the public transport node is treated as part of the first/ last mile of the journey. In the context of Singapore, this includes feeder bus services and light rail transit (LRT) which ferry passengers to MRT stations from more distant parts of the town.
ACCESS
MAIN
EGRESSMODE
MODE
MODEHOME STATION STAT1ON DESTINATION
FIRST MILE LAST MILE
Figure 2-1 - Depiction of first and last mile
2.2 The first and last mile of public transport and its importance in the public transport trip chain
A trip made on public transport usually requires the user to utilize more than one mode of transport. Some research differentiates between the use of multiples modes within a given time period as multimodal and use of multiple modes within the same trip as intermodal (Block-Schachter, 2009). In this thesis, I used multimodal to refer to using multiple modes within a single trip or tour..
The attractiveness of public transport as a mode therefore depends not just solely on the quality and attributes of the main mode but also on the quality and attributes of the
entire multimodal chain. Researchers studying the multimodal public transport chain have generally found the connecting ends to be its weakest link and that they can significantly influence the overall appeal of public transport given their substantial contribution in terms of travel time and travel discomfort (Krygsman, et al., 2004) (Rietveld, 2000).
In a typical public transport trip, connectivity issues can be identified at multiple sources. For example, the commuter could find disutility in the low speed modes of walking and cycling which also require additional physical effort compared to faster modes such as the automobile. Walking and cycling in extremely hot or extremely cold climate may also cause discomfort and add to the displeasure. In waiting for feeder bus services to travel to the transport node, additional waiting times are also incurred. Service reliability can also be an issue if the commuter is not able to board the bus due to congestion or if the bus is not following the prescribed schedule. As a public service route, the feeder bus often travels on a less direct route to the transport node and this will be considered negatively by the commuter (Rietveld, 2000). At the transport node, transferring
between modes also incurs transfer penalties (Zhan & Wilson, 2004). Even the quality of the transport nodes and facilities can become a factor that erodes the appeal of the overall commuter experience in public transport (Givoni & Rietveld, 2007).
The combined effect of these weak links in the multi-modal transport chain especially at the connecting ends causes the public transport mode to be seen as inconvenient when compared to the private automobile. However, if these weaknesses can be overcome
by implementing measures that can improve the experience of walking, cycling or taking feeder buses to transit nodes, there is potential to overcome first and last mile problems
and increase the appeal of public transit. Some of these measures will be discussed further below.
2.3 Catchment Area of Transit Station and Station Access Modes
For any given transit station, its total potential user base comes from a geographical area known as the catchment area. The size of this catchment area is affected by several factors. The first factor is the number of access or egress modes that are available to the commuter at the home end or the destination end of the trip. Stations
which have more modes have the ability to attract people from more places and hence this increases the size of the catchment area.
The second factor is related to the characteristics of the access/ egress modes. Stations which allow motorized modes such as feeder buses and parking facilities for park and
ride users for access and egress will have a larger catchment than those which rely purely on non-motorized form of access modes such as cycling and walking. Assuming the modal speed characteristics in Table 2-1, Figures 2-2 and 2-3 show the size of the
catchment that correlate to each mode in an equivalent 5-minute travel time to
Tampines MRT station in Singapore. Clearly, there is a strong case to design for modes with higher speeds to access the station. Even for cycling, the size of the catchment
based on network is almost twenty times that of the walk catchment area!
Even within each access mode and its corresponding catchment, there could be specific factors that affect its catchment area. For example, in Jinan China, studies have shown that the walk catchment area is affected by street design, density, distance to CBD and station typology (Jiang, Zegras, & Mehndiratta, 2011).
Table 2-1 - Modal Speed Characteristics
Mode Average Distance Total catchment area Total catchment area
Speed covered in based on Euclidean based on network
(km/hr) 5min (m) buffer (ha) buffer (ha)
Walk 5 417 55 21
Cycle 20 1,667 873 408
Legend
Cycle Calchment Area
Wilt Catchment! Are
E IMRTSft ITAMRTtreck LTAtOdkev4 -*PAS RIS TA Es S S I ' -,,.. -*4 E 0 TANAH ME RCHANGE 0 350 700 1,400 Meter I I I I I I I I I
Figure 2-2 - 5-minute euclidean buffers of various modes around Tampines MRT Station
Figure 2-3 - 5-minute network buffers of various modes around Tampines MRT Station
The third factor which affects the size of the catchment is the inter-station spacing. For stations that are generally further from other stations, their catchment areas tend to be larger than stations that are located closer together as there will be a higher likelihood for the latter to have overlapping catchments. However, it is important to qualify that stations that have a smaller catchment due to proximity to other stations may not mean that they suffer from lower patronage. For instance, in the case of downtowns where there is higher density development, smaller catchments for stations located in the downtown are compensated with higher density development which generates higher
ridership per unit area.
The preceding argument therefore leads us to further study the modes used by commuters to access the stations. Research on public transport tends to observe the decline of public transport mode share as access distance increases (Keijer & Rietveld,
1999; O'Sullivan & Morrall, 1996; PARSONS BRINCKERHOFF QUADE & DOUGLAS, 1996). Such a decline is seen in Figure 2-4.
16%
- 14% o 12% 10% E 2 6%/ 4% 2% 00/ in 0 In I 0 In 00 V V V V V V V V Vdtance dam (Im*
Figure 2-4 - Declining public transport mode share with increase in access distance at home end and activity end in the Netherlands (Keijer & Rietveld, 1999)
A possible way to increase public transit mode share would be to exploit the access mode characteristics and increase the shares of access modes that serves a larger
catchment. The relative distribution of access and egress mode shares from various literatures are be summarized in Table 2-2. In the Asian cities, walking predominates in access and egress. In suburban-oriented USA, where radial, CBD-oriented public
transport service is common, car predominates as an access mode, while walking is the last mile solution. In bicycle-friendly Holland, the bike has the largest access mode share.
Table 2-2 - Access and egress mode shares for transit stations
Netherlands' USA (San Japan China Singapore4
Francisco) (Tokyo (Shanghai)
Access Egress Access Egress Access Egress Access Egress Access Egress
Walk 24% 48% 24% 76% 60% 88% 51% 81% 70.3% 67.3% Cycle 39% 12% 1% 1% 17% 2% 11% 1% 0.3% 0.5% Public 24% 27% 24% 19% 17% 9% 29% 13% 28.1% 31.3% transport Car 13% 10% 51% 4% 4% 1% 1% 2% 1.1% 0.9% Others 0% 3% 0% 0% 5% 0% 8% 3% 0% 0%
*Public transport includes feeder buses, LRT and taxis
1 (Givoni & Rietveld, 2007)
2 (Olszewski & Wibowo, 2005)
3 (Pan, Shen, & Xue, 2010)
4 (LTA,2010b)
Theoretically, each mode has a range within which it is effective. Hence, the share of access mode across distance to the station is not constant but varies up to a maximum
range. Table 2-3 shows example effective ranges for different modes as derived from the literature.
Table 2-3 - Access modes to transit station and operating range
Mode Range (kin) Source
Walk 1 - 1.6 (Chalermpong & Wibowo, 2007)
Up to 1.5 (Keijer & Rietveld, 1999)
Cycle 2 - 5 (Martens, 2004)
1 -3.5 (Keijer & Rietveld, 1999)
Public Transport 2 - 6 (Keijer & Rietveld, 1999)
(feeder buses)
Car (kiss and ride) 1 - 7 (Keijer & Rietveld, 1999)
Consistent with intuition, non-motorized modes tend to have a higher share over
further from the station. This trend is depicted in Figures 2-5 to 2-7 which also show that peak mode shares for motorized access modes are not higher than those for walking.
1P C! If
0
0
0-Access mode share
CY c' N ~ q' distribution at home-end 0 E 0 6 *A -S S Lu S U) a U 0) 90% 80% 70% 60% ...bike , 4 50% - -walk > 40% " * * - * . public transport * car 0 30% -C 0% CC Ct sow U4) 00 %n 0 1 f " V V V V V V V V V V o If) 0; If n 0 n 0 distance class
Figure 2-6 - Egress mode share distribution at activity-end in Netherlands (Keijer & Rietveld, 1999)
21 80% * ike walk """ public transport - - -car distance class
in Netherlands (Keijer & Rietveld, 1999) C 0 70% 60% 50% 40% 30% 20% 10% 0% Figure 25 -N
20
15
10
0
0
1
2
3
4
5
Access Distance (in kilometers)
Figure 2-7 - Access mode share distribution in Mumbai India (Rastogi & Rao, 2003) The observed popularity of walking as an access and egress mode re-emphasizes the importance of the first and last mile research. The fact that the access modes do not have the same shares and that walking has the highest share implies that non-walking modes have some intrinsic quality that makes them less attractive and as a result, they fail to capture a larger share in areas further away from the station. One can attribute this to relatively higher disutility in using these other modes. For example, lack of cycling facilities may cause a low mode share because of the perceived riskier environment. Additional walking and waiting times for feeder services and service reliability and comfort can also contribute to lower mode shares for public buses.
To increase the catchment area of transit stations, one strategy is therefore to reduce the connectivity barriers in the first and last mile of public transport trips. A cheap and effective way in which this can be done is to improve the ability for cycling to function more effectively as a feeder mode.
2.4 First and last mile solutions
If first and last mile problems are framed essentially as connectivity issues between the public transport node to the commuter's home and destination, what are the possible solutions or strategies? Table 2-3 categorizes the various solutions that have been aimed at resolving first/last mile connectivity issues.
Amongst these solutions, some are more costly while some are more cost effective. The aim of the thesis is to investigate the effectiveness of cycling as a first mile solution given its success and rising popularity in many countries.
Table 2-3 - First/last mile solutions
Classification Solutions
Physical (infrastructure) * Expanding rail network to bring stations closer to
Solutions homes and destinations
* Adding stations on existing network
* Creating more direct walking / cycling paths to transit nodes
* Bike share infrastructure
Land use (urban * Transit-oriented development to encourage high
design) Solutions density developments near transit stations so that more people can stay/work nearer transit stations and walk directly to the station
* Safeguarding of corridors in developments to allow greater porosity and encourage direct access to the station
* Integration of development with transit nodes * Integration of transit nodes to reduce walking
distance between modes and improve inter-modal transfer convenience for commuters
Modal solutions Increasing frequency of feeder services
* Synchronization of feeder service frequencies and headways with main public transport mode service and headways to reduce inter-modal waiting times * Improving travelling comfort on feeder modes * Improving service reliability of feeder modes * Bike share programs
* Car share programs
Technological solutions * Providing real time service information on arrivals and
departure of feeder services
* Providing free trip planning service for commuters using public transport mode based on commuter preferences
* Integration of fare payments between feeder and main modes
* Use of smart card and cashless transaction for fare
2.5 Cycling as a first mile solution and as a feeder mode to transit
The use of cycling as a feeder mode to transit can be accomplished in the form of bike and ride (B&R) or bike, park and ride (B,P&R). The first form allows transit users to bring their bikes onto the main mode of transit, while the second form requires cyclists to leave their bikes at the transit stop. Research has shown that high speed public transport modes, such as trains, can rely on the cycling mode to increase its catchment (Martens, 2004) (Martens, 2007). However, the ability to rely on cycling as a feeder mode is more evident at the access end of the trip compared to the egress end as one is more likely to have a bicycle at home which he can use to cycle to the station than at his work place (Rietveld, 2000). As a feeder mode, cycling also offers a viable and much cheaper alternative to other feeder modes such as feeder buses and park and ride where larger investments are necessary (Pucher & Buehler, 2009).
The literature available suggests that more cities around the world are following in the footsteps of Dutch cities (see Table 2-2) and are attempting various ways to integrate cycling with public transit. In the city of Shanghai, for example, researchers are
optimistic about approaches to enhance bike-rail integration to supplement the rapidly expanding metro system (Pan, et al., 2010). In new Delhi, researchers concluded from
commuter surveys that more cycling infrastructure can help to increase the number of people willing to cycle to public transit stations (Advani & Tiwari, 2006). Last but not least, a network of intra-town bicycle paths have been built in a few HDB towns in Singapore to connect residential blocks to the MRT stations under the National Cycling Plan. The common underlying theme in all these cities is to encourage more people to cycle and take public transport.
2.6 The role of cycling infrastructure and its impact on cycling levels Cycling infrastructure such as bike lanes and bike storage facilities play an important role in encouraging more people to cycle. Dedicated cycling lanes allow, at minimum, the perception of a much safer environment for cycling, by separating cyclists from faster moving road traffic. Bike parking facilities such as those located near homes and transit stations allow cyclists to park their bicycles at a convenient location when they are not in use. Figures 2-8 and 2-9 show typical bike lanes segregated from road traffic
while Figure 2-10 shows an example of a bike parking facility in Amsterdam near a transit station.
In a survey conducted on the campus of the University of Maryland College Park, both non-biking and biking commuters agreed that "bicycle lanes, trails and paths would encourage them to ride a bike or ride more often to the campus" as their underlying concern was due to the perceived lack of safety in cycling alongside vehicular traffic when such dedicated lanes are not available (Akar & Clifton, 2009). The same attitudes on safety of bike lanes that are separated from traffic is also found in a survey of over 1,400 current and potential cyclists in Vancouver (Winters, Davidson, Kao, & Teschke, 2011). A study of 90 US cities identified a positive correlation between cycling levels and the supply of bike paths and lanes (Buehler & Pucher, 2011).
The well-developed cycling network in Netherlands is also likely to be the reason for Dutch cities having the highest average mode share for cycling in the industrialized world (at about 27%) (Pucher & Dijkstra, 2000).
While the literature does provide strong empirical evidence suggesting that provisions of bike paths and bike facilities (i.e. built environment) leads to higher cycling mode share, Pucher and Dijkstra (2000) also argue that the popularity of cycling in high bike mode share cities can lead to a demand for such facilities to be built. This suggests a positive feedback loop: cycling-oriented cities demand cycling facilities which further orients the city towards cycling.
Figure 2-8 - 2-way bike segregated bike lanes in Paris (Source:
http://www.streetsblog.org/2007/03/29/should-dot-install-separated-bike-lanes-on-9th-stree/)
Figure 2-9 - Segregated bike lanes in Copenhagen, Denmark (Source:
r-igure z-lu - bicycle parKing Taciiity at Amsteraam uentrai ttation (bource:
3 An Overview of HDB Towns and Public Transport System in
Singapore
3.1 Population density and HDB public housing
Singapore is a city state in South-East Asia with a total population of 5.08 million as of
2010 (Singstat, 2010). As a country, Singapore has one of the highest population
densities (gross density) in the world. However, a more meaningful comparison is done
at the city level with other cities as shown in Table 3-1.
Table 3-1 - A comparison of gross densities of selected cities
City Population City Size Gross Density Source
('000) (km2) (persons per km2 ) Singapore 5,076.7 712.4 7,126 1 Hong Kong 7,108.1 1,108 6,415 2,3 Shanghai 23,019,148 6,340.5 3,630 4,5 Tokyo 35,682,460 13,572 2,629 6 London 7,825.2 1,580 4,863 7
New York City 8,175.1 789.4 10,356 8
1 - Singapore Department of Statistics (Census 2010)
2 - Population from Census and Statistics Department estimated in mid-2011
3 - City area as of 18 Oct 2011 from Planning Department
4 - Municipal area of Shanghai as of end 2008 from Shanghai Government website
5 - Municipal population of Shanghai based on 2010 census from National Bureau of Statistics, China 6 - Metro population area and land area from Tokyo Metropolitan Government
7 - Population of London and city size (including London city and its 32 boroughs) as of July 2010 from
Office of National Statistics
8 - New York City population 92010 census and city area from US Census Bureau
Table 3-2 summarizes the population and density changes for Singapore over the last 2
decades. As of March 2011, about 3.1 million of the resident population is housed in
HDB flats in the 26 HDB towns and estates shown in Figure 3-1 (HDB, 2011).
Table 3-2 - Changes in population size and density in Singapore from 1980 to 2010 (Singstat, 2010)
Total Resident Land Population
Year Population* Population Area Density
('000) ('000) (sq kIn) (per sq Ian)
1980 2.413.9 2.282.1 617.8 3.907 1990 3.047.1 2.735.9 633.0 4.814 2000 4.027.9 3.273.4 682.7 5.900 2005 4.265.8 3.467.8 697.9 6,112 2006 4.401.4 3.525.9 699.5 6.292 2007 4.588.6 3.583.1 705.1 6.508 2008 4.839.4 3,642.7 710.2 6.814 2009 4.987.6 3.733.9 710.3 7.022 2010 5.076.7 3.771.7 712.4 7.126
*Total population comprises Singapore residents and non-residents. Resident
population comprises Singapore citizens and pennanent residents.
i egend
M Compleweo
M Un1def ConIsIJLion
M HDB Developmenit Holdiiy
Map ot
3.2 Public Transport System in Singapore
The daily transportation needs for Singapore's residents are met primarily by the public
transport system which comprises the MRT system and public buses. From the
Household Interview Travel Survey (HITS) conducted in 2008, about 9.9 million
motorized trips were generated on an average every day, 56% on public transport.
While the total number of trips represents a 20% increase since the 2004 HITS survey,
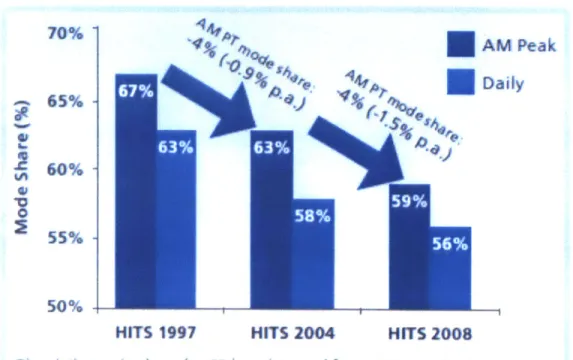
the mode share for public transport has declined over the same period. The AM peak
hour mode share has dropped from 67% in 1997 to 63% in 2004 to 59% in 2008. Figure
3-2 shows the increasing daily trip generation in Singapore and Figure 3-3, the declining
mode share for public transport.
Total 12,000 ~Trips: Total 9,900 10,000 Total Trips: Trips:--20 g 8200 8,000P 4, 6,000 23 4,000 2,000 --, ---
1---HITS 1997 HITS 2004 HITS 2008
Nore Numbers are rounded off
The number of trips grew rapidy over the decade w ith pro'ate
tranpo r? tnps growmng faster than pubbe transport
Figure 3-2 - Changes in daily trip generation from 1997 to 2008 (Source: Choi & Toh, 2010)
----
k
MMP
70%
H
AM Peak 0.2
41 ~0 0 65% 60% -55% 50% -DailyHITS 1997 HITS 2004 HITS 2008
er~ d&} il m code & *or PT
r~as
droppe-d from 63%._ Pn 1997 to 56%, ifFigure 3-3 - Decline in public transport mode share from 1997 to 2008 (Source: Choi & Toh, 2010)
Based on the HITS Survey in 2008, MRT and LRT account for 17% of the daily mode. share, buses 31.4% and, and taxis 7.9%3. In the Land Transport Master Plan, LTA views the MRT system as the backbone of the public transport system in Singapore
(LTA, 2008). As of April 2012, the MRT system is made up of: i) the North-South Line; ii) the East-West Line; iii) the North-East Line and iv) the Circle Line. The entire network
has a total of 76 stations and is 148.9km in length. Figure 3-4 shows the MRT system map in Singapore and Figure 3-5 shows the MRT in operation.
To arrest the decline in public transport mode share, the Land Transport Authority (LTA) is planning to expand the length of the entire network to 278km by 2020 as one of its strategies under the Land Transport Master Plan (LTMP) announced in 2008.
3 Taxi trips excludes trips made by non-residents and tourists 63%
59% 58%
JO onUBooni
FOOTlgwt
6,. o- . i an .*A ft"*
Figure 3-4 -Singapore MRT system map (Source: SMRT)
Besides the MRT system, public buses operated by SBS Transit4 and SMRT5 form the
other component of the public transport system. The various public bus routes in Singapore can be categorized broadly into trunk services and feeder services. Trunk services are routes that run between different HDB towns (i.e. inter-town) and other parts if Singapore while feeder services are short haul routes that run within a HDB town that connects the outlying town areas to the town center which has a larger transport node (i.e. typically a bus interchange and an MRT station). As of April 2012, SBS Transit is the largest public bus operator in Singapore, operating 185 bus routes (133 are trunk services and 52 feeder services). SMRT operates 48 trunk services and
14 feeder services. A picture of an SBS bus service in operation is seen in Figure 3-6.
Figure 3-6 -SBS service 157 stopping at a bus stop with passengers alighting (Image source:
http:Ilwww.sabuses.com/v/sbst/b7rle/SBS803L-157.JPG.html)
In the context of the first and last mile research, the main mode of public transport in Singapore is therefore MRT and trunk bus service. But given the MRT's more dominant
4 For more information on SBS Transit, visit http://www.sbstransit.com.sg/
5 For more information on SMRT, visit http://www.smrt.com.sg/main/index.asp 33
role, this thesis will focus more on MRT as the main mode and, thus, its first and last mile challenges.
3.3 Payment of fares on public transport in Singapore - The EZ-Link automated fare collection system
Payment for fares on public transport is largely done through a stored value contactless smart card system called EZ-Link. EZ-Link cards, shown in Figure 3-7, can be
purchased at all MRT stations and bus interchanges and allow commuters to pay for their rides on public buses and the MRT. The EZ-Link system is a "tap-in, tap-out"
system. On buses, commuters tap their cards on card readers located at the entrance as they board and tap out on readers located at the exit. Figure 3-8 shows a photo of a reader installed on public buses. For MRT, commuters tap in and tap out at the fare gates at the MRT station such as those seen in Figure 3-9.
Figure 3-8 - EZ-Link card reader on public buses (image source: Google)
A1 4
t-igure ;-U - ::-tInK cara reaaer integratea Witn Tare gates of MRKT station
3.4 Getting to the MRT and first/ last mile problems in Singapore
According to LTA's 2008 HITS survey summarized in Table 2-2, walking and public transport account for over 98% of all access and egress trips to the MRT station. The remaining 2% comes from those who cycle or travel by car to/from the station.
Currently, no literature has characterized the nature of first and last mile problems in Singapore and how it affects transit ridership. Despite this, the Ministry of Transport
announced the National Cycling Plan (NCP) in 2009 which emphasize cycling as a potential solution to the first mile problem. As the new bike paths under the NCP are located in HDB towns where most commuter trips originate, the thesis aims to examine whether these and other bike paths have had any effect on transit ridership so far.
3.5 Cycling in Singapore - the story so far
Cycling milestones in Singapore
Cycling has not generally been supported as a commuting mode for the mass public until 2009 when the Ministry of Transport officially announced a change in policy position to accept cycling as a transport mode during the budget debate. Some of the key milestones in cycling development in recent history are summarized below:
14 May 2007 - Announcement by LTA of a study to allow cycling on footways in Tampines Town from 27 May 2007 to 30 May 2008.
27 May 2007 - Commencement of cycling on footways study in Tampines Town. 21 May 2008 - Announcement of trial to allow foldable bicycles on trains and
buses every weekday during non-peak hours and all day on Saturdays, Sundays and public holidays from 24 May 2008 to 24 November 2008.
24 May 2008 - Commencement of foldable bike trials on trains and public buses. 1 Jul 2008 -Announcement by LTA to extend Tampines Town cycling study by 6 months.
14 Aug 2008 - LTA announces plans to install cycling signs along popular cycling
routes.
12 Feb 2009 - LTA announces approval of foldable bike scheme on trains and public buses during off-peak hours.
12 Feb 2009 - MOT unveils the National Cycling Plan with a budget of S$43mil to implement cycling networks in selected HDB towns including Tampines, Yishun, Sembawang, Pasir Ris and Taman Jurong by 2012.
3 Aug 2009 - The NCP was reiterated under the Sustainable Development Blueprint of Singapore.
13 Dec 2009 - Following the end of the cycling on footways trial in Tampines, it was found that there was a general level of acceptance of the trial provided that bike paths, enforcement and education are implemented together. A framework was introduced to regulate safe cycling on footways in Tampines on 1 Mar 2010 which included amendments to town council by-laws and allowing the Town Council to take enforcement action against reckless cyclists on footways.
15 Jul 2010 - Completion of 1.2km of cycling paths in Tampines under the NCP. Announcement of 2 additional HDB towns (Changi-Simei and Bedok) under the NCP.
30 Jan 2011 - Completion of 1.4km of cycling paths in Taman Jurong under the NCP.
April 2011 - Completion of 1.7km of cycling paths in Yishun under the NCP
May 2011 - Completion of 1km cycling paths in Sembawang under the NCP
18 Sep 2011 - Completion of 1.1km of cycling paths in Pasir Ris under the NCP.
Figure 3-10 shows the location of these towns in Singapore. Table 3-3 summarizes paths that were built by town councils and paths planned and implemented under the NCP in the 5 HDB towns. A completed section of the bike path in Pasir Ris is shown in Figure 3-11. The plans for each town are displayed in Figures 3-11 to 3-14 below.
Other bicycle paths
Before dedicated cycling paths under the NCP were implemented in 2009, some town councils responsible for maintenance of HDB town facilities had already implemented their own dedicated bicycle paths due to calls from the local community.
I
P*AR RtS Pasir Ris7
Changi-SimeiLEGEND
NCP Towns (2009) P o n ?010)Figure 3-10 - HDB Towns under National Cycling Plan ... ...
Table 3-3 - Cycling towns and their existing and proposed cycling infrastructure Pre-existing Proposed NCP Implemented
TowpePath NCP Path (as Proposed NCP Paths
TownCycling
cy of Mar 2011) to be completed by7
paths (kin) Length (kin) (kmn)
Tampines 2.3 6.9 1.2 June 2012
Pasir Ris 4.0 5 0 March 2012
Taman Jurong 0 10 1.4 September 2012
Yishun 0 7.5 0 December 2011
Sembawang 7.1 1 0 March 2011
Figure 3-11 - Photo of completed cycling path in Pasir Ris (Image source:
6 Implemented by respective town councils
cycling network in Tampines Town Council)
Phase 1 (Launch on e Sept 2011) i
- Phase 2 (by end 2012)
Existing cycling path by Town Council Under Pasir Ris 21
onmmiunitv Mall PrniAe.t
Park Connector
Figure 3-13 - Existing and proposed cycling network in Pasir Ris Town (image source: (LTA, 2011a)
/% 'O 1, Lake Holm Lakeside Family Activity Zone Jurong Lake Pi f Gdn 9 japamn*,
I
I
I I awconne FS.R~(
Figure 3-14 - Existing and proposed cycling network 2011) ark R41 Completed section (1.4km) surong ft Section to be completed by 2012 Park Connector Network (PCN)
in Taman Jurong Town (Image source: (LTA,
I
'1he'Town Council, HIDB and LT A will work together ont a 7.5km cdmg track alng Yishun Rmng Roa.'lhe prowec, costmg some $63 milhon, wil be tompleted by 2012 and NParks will add Skm to as network ofpark connector along the M RTttaduct. Ihere wdl
be more park onnectors by NParks to eventuayll link all the parks i the north, nduhding the upcoming Coastal Promenade.
Upcoming Coastal Promenade by the URA, (TaZrget completion - 2010)
r' Ir
Existing and Future
Network of Cycling
Tracks in the North
Legend:
Cydle tracks by Sembawang Town Council (Comphtted) April 2009) nonnan ilmsting Pork Connectors Existung park or Proposed Par* Connector linking Yiaisn, Sembawang and Woodlands Towns .e e * Pur Connecirs approvred or tnderconstructien (Target compketon -FY2009-2010) open space (Target completion -FY200-201 t0) * * 0 * * Pork Connectors pending approoal (Target completin -PY 20hO) Propoed Park
Cyde tracka by M & Sembalawang Town Council (Tgol completoen -2012) awanna Park Connectors undler study (Lin" indicate wentatimepacenment, target competion -PY201 3) M RT Station
Figure 3-15 - Existing and proposed cycling networks in Yishun and Sembawang (image source: Sembawang-Nee Soon Town Council)
For the two new towns (Changi-Simei and Bedok) that were included as part of the NCP in 2010, no details have been made available on the alignment for the bike paths.
Besides dedicated cycling paths, commuters who wish to cycle in a safe environment can also utilize the Park Connector Network (PCN). The PCN is a network of paths
designed primarily for recreational purposes and to connect various parks around Singapore. The National Parks Board (NParks) is the government agency responsible for the planning, implementation and maintenance of the PCN. As of Jan 2012, NParks has implemented about 200km of PCN in Singapore (MND, 2012). Figure 3-16 shows the island-wide PCN network in Singapore and Figure 3-17 a photo of an existing park connector in Pasir Ris town (part of Eastern Coastal Loop).
Y
- e~J
Yamarlens AYE hi... .. a ... SembawangPark Yishun Park
I
Jurong sland Re LEGENDParks and nature reserves
Western 7Northern Eastern
Adventure Explorer Coastal
Loop Loop Loop
Park
CONNECTORS
Par
... Nlorth astern Loop
Southern Kallang-
Siglap-Lopoo n ainLo
Figure 3-16 - Singapore Park Connector Network ((Graphic Source: Straits Times)
SLE Ae Bishan Park seTa ToaPayoh serve
SINGA
KIES
PARK
Sunge uloh Wetland_.. ResenveY,
VE I Ulot
East CoastPark West Neighourhood ParkFigure 3-17 - Photo ot a parK connector (tastern Uoastal Loop) aiong a canai in rasir KIs town As the park connectors are built more to serve recreational needs and less for
commuting purposes, not all of them are connected to MRT stations. Figure 3-18 shows an example of Choa Chu Kang MRT station which is connected to the park connector while Yew Tee MRT station is not. For this thesis, only PCNs that are within 5km from the station and connected to the MRT stations are considered.
A N
0I
MRT Station (Yew Tee) Not connected to PCN
MW
I
,fi
I
.-
I .
MRT Station (Choa Chu Kn Connected to PCN
ChMh cf Wr
LEGEND
Park Connector c
-M~iBN Road
IIOBiking Trail KanOV
11,11in i MRT Line Building_ Park River/Reservoirs % ,, I Overhead Bridge as Footbridge K* l 4f Shelter C Fitness Corner I
Bicycle Parkinq
Free bicycle parking facilities at transit nodes such as MRT stations (such as those seen in Figure 3-19) allows cyclists to have a designated place to park their bicycles so that they can transfer to the public transport system for longer distance travel. The NCP also includes plans to increase the number of bike parking facilities at MRT stationsa
r-igure a-1v - tsicycie parKing Taciiies near r'asir KIS MKI station (image source: Panoramio) 3.6 Park and Ride scheme
Another form of commuter connection that complements the public transport system is the Park and Ride scheme. The scheme allows commuters who own a car to be able to drive to designated car parks near a public transit facility where he or she can then continue the rest of the journey using public transport. The aim of this scheme is to discourage driving into the Central Business District and to reduce the level of road congestion during peak travel hours. The scheme provides drivers with an EZ-Link Park and Ride (P&R) card which can be used on buses, LRT and MRT systems and also a season parking ticket (SPT). The total cost for enrolling in the scheme is $70 per month.
8 No specific numbers are available on how many additional lots will be provided at the stations
($40 for the P&R card and $30 for the SPT). More details on this monthly scheme and the location for all the car park are available online9.
3.7
Summary of First Mile Solutions in Singapore
Current first mile solutions that have been implemented in Singapore are summarized in Table 3-4.
Table 3-4 - First mile solutions implemented in Singapore
Access Mode Solution Type
Walk Expanding MRT network to bring Physical
stations closer to homes
Integration of bus stops/ Land Use interchanges with MRT (Urban design) Cycle Implementing cycling paths and bike Physical
parking
Public Increasing reliability of feeder bus Modal Transport services.
Providing real time information on Technological feeder bus services
Integrated fare payments
Car Designating Park and Ride car parks Land Use
near MRT stations
3.8 Focus on Morning Peak Travel Behavior
The morning peak hour public transport mode share is a key performance indicator for public transport policy making in Singapore. Towards the goal of making public
transport "a choice mode", LTA targets to increase public transport mode share "during morning peak hours" to 70% by 2020 (LTA, 2008). In order to gauge the effectiveness of first mile solutions such as bicycling and bicycle infrastructure against other policy measures and solutions, morning peak hour travel behavior is used.
Another reason for focusing the analysis on morning peak hour travel is to control for trip-making purpose. Morning peak hour trip making is typically associated with journey to work and journey to school commuting trips. Outside morning peak hours, trip