Building a Biomedical Cluster: A Comparative Study of MIT and Singapore
By
MA Kenny Hwee Seong Ching
B.S. Biomedical Engineering (2003)
The Johns Hopkins University
Submitted to the Engineering Systems Division in Partial Fulfillment of the Requirements for the Degree of
Master of Science in Technology and Policy at the
Massachusetts Institute of Technology September 2004
@2004 Massachusetts Institute of Technology. All Rights Reserved.
Signature of Author
Technology and Policy Program, Engineering Systems Division July 15th, 2004
Certified by
" Fiona E. Murray
Assistant Professor of Management of Technology, Inno 'on and Entrepreneurship MIT Entrepreneurship Center, Sloan School of Management Thesis Supervisor
Accepted by
(
Dava NewmanProfessor of Aeronautics and Astronautics and Engineering Systems Director, Technology and Policy Program
ARCHVES
SSACHUSETTS INSTItUTEOF TECHNOLOGY
MAR 2 5 2009
LIBRARIES
Building a Biomedical Cluster: A Comparative Study of MIT and Singapore By
Kenny Hwee Seong Ching
Submitted to the Engineering Systems Division on July 15th, 2004 in Partial Fulfillment of the
Requirements for the Degree of Master of Science in Technology and Policy
Abstract
Clusters comprise of a particular set of ingredients, which includes researchers, entrepreneurs, venture capitalists, well-trained and educated workers, and specialized professional services. The importance of each ingredient is undeniable, yet the proximity to research centers and institutions is perhaps the most critical element of success for technology clusters. This thesis focuses on the Massachusetts Institute of Technology (MIT), and examines its role in the development of the biomedical industry cluster in Cambridge, Massachusetts.
However, while the important role that academic institutions play in the process of transforming science to marketable technology is acknowledged, the question of who are the actual researchers most intimately involved in this process remains unanswered. Drawing on quantitative data, we show that the majority of commercially related research work is performed by a small fraction of the researchers, and this group is heterogeneous in characteristics. Moreover, through a novel way of examining publication data, we also show that the commercial productivity of each researcher is positively related to the researcher's relative level of applied science research.
Over the past two years, Singapore has been among the most aggressive of the East Asian countries in pursuing the development of its biotechnology industry. By benchmarking Singapore against MIT, we recommend that Singapore raise its level of applied science research, to improve the integration of academic research into the marketplace.
Thesis Supervisor: Fiona E. Murray
Title: Assistant Professor of Management of Technology, Innovation and Entrepreneurship
Acknowledgements
I not only use all the brains that I have, but all that I can borrow.
- Woodrow Wilson
This thesis has been an immense challenge from start to end, and there are many to whom
I owe my deepest gratitude.
I would like to thank the Dupont-MIT Alliance for awarding me their fellowship, whose
financial support made everything possible. My sincere thanks go to Professor Fiona Murray, for her patience, guidance and support throughout this past year. Your ideas and careful direction of the thesis have given it shape, clarity and cohesion. And many thanks as well to the Singapore Economic Development Board, for their support and help.
I give my utmost thanks to Isilme. "Gil sifla na lfi govaded, Le melon." My eternal
gratitude goes to my great friend Stanley Yong, at the University of Illinois at Urbana Champagne, who helped me immensely with the statistical modeling in this thesis; and to Kenneth Huang at MIT for his guidance and advice.
A shout out of thanks goes to all my friends in MIT and Johns Hopkins University
-Sydney, Ayaka, Dulles, Kelvin, Tony, Ling, Ramesh, Chintan, Maggie, Alisa, Bhuvan, Ankit, and Joselin, amongst others. I really appreciate the friendships we have forged over these four years. And to my best friends in Singapore - Shuhao, Vengadesh and Timothy - thanks for keeping me sane in these trying times.
And last but not least, I would like to thank my family for their love and support throughout these years. I dedicate this thesis to my mother.
One can never run out of people to thank, and my list stretches very far. For all who have been not mentioned here, you have my deepest gratitude.
Table of Contents
Abstract ... ... 3 Table of Contents ... .. ... ... 5 List of Figures ... 6 List of Tables... ... 7 I Introduction ... ... 8 1.1 Thesis Overview ... 91.2 Conceptual Fram ework ... ... ... 10
2 Related W ork... 14
2.1 Concept of Cluster... ... 14
2.2 Academ ic Research Underlying Industrial Innovation ... 15
3 Data and M ethods... ... 18
4 Analysis of Results ... 22
4.1 M IT Results ... ... ... ... 22
4.1.1 Patents ... 22
4.1.2 Profiling the Researchers ... 28
4.2 Biology Department ... 32
4.3 Singapore... ... ... ... 43
Appendix ... ... .. ... ... 48
List of Figures
Figure 1: Commercial Activity versus Commercial Opportunity ... 11
Figure 2: Patent data... Error! Bookmark not defined. Figure 3: Publications data... ... 21
Figure 4: Patents versus Faculty Member ... 23
Figure 5: Top 10% of faculty members hold 57% of total number of patents ... 23
Figure 6: Patent Rate versus Faculty M ember ... 24
Figure 7: Patent Rates versus Faculty Member... ... 25
Figure 8: Mean Forward Patent Citation versus Faculty Member ... 26
Figure 9: Publication Rate versus Mean Forward Patent Citation... 33
Figure 10: Number of Patents versus Faculty Member... 44
List of Tables
Table 1: Descriptive statistics for MIT faculty ... 22
Table 2: Correlation Matrix for Patents, Patent Rate and Mean Forward Patent Citation 27 T able 3: Faculty groups... ... 28
Table 4: Variables values ... 29
T able 5: T -test for G ender ... 29
Table 6: T-test for Tenured Status... 29
Table 7: T-test for Scientific Advisory Board Membership ... .30
Table 8: Mean Forward Patent Citation as a function of researcher characteristics. Saturated model. Standard errors in parentheses. ... 31
Table 9: Mean Forward Patent Citation as a function of publication behavior. Fixed effect models. Standard errors in parentheses ... ... 35
Table 10: Correlation Matrix for number of basic research articles, number of applied research articles, ratio of applied research to basic research articles, and total number of articles ... ... 37
I
Introduction
Clusters are groups of inter-related industries. They have two key elements. Firstly, firms in the cluster must be linked. Secondly, groups of inter-linked companies must be located within close proximity of one another. Professor Michael Porter refers to clusters as "Geographic concentrations of interconnected companies, specialized suppliers, service providers, firms in related industries, and associated institutions (for example universities, standards agencies, and trade associations) in particular fields that compete but also co-operate." (Porter, 1998) The links between firms are both vertical, through buying and selling chains; and horizontal, through complimentary products and services, the use of similar specialized inputs, technologies or institutions, and other linkages. Most of these linkages involve social relationships or networks that produce mutual benefits for the firms involved. Co-location encourages the formation of contacts between firms and can enhance the value creating benefits arising from networks. The geographic area covered by clusters can vary dramatically. There may even be multiple operating scales, with regional, national and even international dimensions to some clusters.
Clusters comprise a set of ingredients that includes researchers, entrepreneurs, venture capitalists, well-trained and educated workers, and specialized professional services. The importance of each ingredient is undeniable, yet the proximity to research centers and institutions is perhaps the most critical element of success for technology clusters. This thesis focuses on the Massachusetts Institute of Technology (MIT), and examines its role in the development of the biomedical industry cluster in Cambridge, Massachusetts. Cambridge has emerged today as one of the most advanced centers in the United States for biomedicine, and a large number of researchers and faculty members in MIT are deeply involved in biomedical science research. This thesis examines the characteristics of researchers in departments that have made a significant contribution to commercialization in the life sciences. It examines what proportions of scientists are commercially active and if they have specific identifiable characteristics. Lastly, the thesis also addresses the extent to which commercial activity is a tradeoff or substitute for basic research work.
However, while the important role that academic institutions play in the process of transforming science to marketable technology is acknowledged, the identities of the researchers who are most intimately involved in this process are largely unknown. Little is known about the actual proportion of researchers involved in this aspect of research work among the entire population. And little is known about the organizational structures that would be most conducive towards the development and promotion of commercial work. This thesis attempts to fill in these gaps, by examining MIT and its faculty members' research work and developing quantifiable statistical measures. We examine and study a total of 143 researchers, and associated with them, 776 patents and 5259 journal articles.
Over the past two years, Singapore has been among the most aggressive of the East Asian countries in pursuing the development of its biotechnology industry. Last year, Singapore's Economic Development Board (EDB) committed a total of S$2 billion toward investment funds to help develop the country's R&D infrastructure, half of which will be spent in the biotechnology and health sector. During the past few years, the Singapore government has spent some $120 million on biotechnology investments through existing funds.' The new initiatives are geared toward positioning Singapore as a premier biomedical cluster in East Asia. This thesis will seek to address some of the key policies that would be critical towards the development of such a cluster in Singapore, by benchmarking Singapore against Cambridge/MIT.
1.1 Thesis Overview
Chapter 2 discusses some of the recent related work on cluster development, as well as focusing on research conducted on development of biotechnology clusters. In addition,
the Chapter examines ideas behind innovation, knowledge flows and spillovers.
Chapter 3 describes in detail, the data employed in our analysis. In particular, the Chapter focuses on the various measures of commercial productivity developed in the
'Singapore Economic Development Board has a SG$1 billion (US$588 million) investment fund committed solely to biomedical sciences research and development.
course of research. The Chapter discusses in detail how the collection of the data as well as the sources.
Chapter 4 builds on the previous chapter, and will describe the results from our research into MIT and Singapore. It will present the key quantitative results derived from our research. The Chapter goes into detail the results derived from applying these measures in the analysis of the research activities of MIT and Singapore. This chapter will discuss in detail data sets and sources collected, as well as highlight and describe the importance of the different fields of the dataset. It will briefly describe the accuracy and validity of the datasets.
Chapter 5 discusses the policy implications of the findings and suggests recommendations. It will attempt to answer questions such as if Singapore's science researcher recruitment policies are conducive to the overall cluster's development, and make policy recommendations to increase the growth and development of the cluster. It will serve as a conclusion to the thesis and suggest possible directions for future research.
1.2 Conceptual Framework
In this thesis, we begin to look at this issue by focusing on a select group of researchers, draw from six departments at MIT, one of the nation's preeminent research institutions. These researchers are selected based on their active work in the life sciences. Drawing on comprehensive quantitative information about each faculty member's patenting and publication behavior, we explore the distribution to which commercially related research work is being conducted at MIT, and attempt to find characteristics that can distinguish
these researchers.
It is helpful to envision academic research and its interaction with industry along two axes. We call the first axis Commercial Activity. This axis indicates how active a researcher chooses to be in commercializing their research, as measured by his patenting history. This has been the area that most current and past research has focused on. However, there is a need to describe a second axis. We call it Commercial Opportunity.
This axis measures how active the researcher is involved in commercially applicable research.
The difference between the two concepts is subtle but important. While Commercial Activity is concerned with ostensible measures such as patenting histories, Commercial Opportunity is an indication of the area of research the researcher is involved in. Figure
1 describes the two dimensional model that we are proposing here.
Commercial Activity
X
Commercial Opportunity
Figure 1: Commercial Activity versus Commercial Opportunity
Previous studies have concentrated on measuring how active researchers are commercially, based on their patenting and patent citation histories. This is represented
by representation of faculty members along the vertical axis (Commercial Activity).
However, this does not represent the full picture. A researcher could be deeply involved in research with high commercial potential but choose not to patent it. In other words, his research work has high Commercial Opportunity but he has low Commercial Activity. On the graph, he would be at point X. It is unclear if researchers are commercially active due to their explicit choice of research materials. On the other hand, a researcher could be
engaged in commercially relevant research but choose not to patent, preferring to have the knowledge in the public domain through publication only (or perhaps engaging only in consulting etc. which is unobservable with the measures we are using)
Past studies have failed to capture this dimension. This is in part due to sheer difficulty; beyond using patent data, it is hard to ascertain the commercial potential of the research work. In this thesis, via a novel method of studying publication data, we will present a set of quantitative measures that will allow us to capture this dimension.
Collectively, what we seek to achieve from our research is to paint a definitive profile of the researchers who are commercially most active. We seek to understand if they can be distinguished by a set of characteristics. We want to understand if their commercial activities are affected by other variables, such as their publishing activity. And very importantly, we want to understand if their commercial activity is related to their commercial opportunity. In other words, we like to know if researchers are commercially active due to a conscious choice in their research material, thereby giving them the opportunity to be commercially active. The alternative scenario is plausible as well, that there could exist researchers who are engaged in research with high commercial potential, but just choose not to patent it. By representing researchers on the graph via the two axes, we seek to paint an accurate picture that best model academic research.
Our study builds most strongly work by Zucker and Darby and their collaborators (Zucker, Darby and Armstrong, 1998; Zucker, Darby and Brewer, 1998), who have demonstrated the importance of geographic proximity, research collaborations, and personal relationships in the transfer of knowledge, as well as Henderson and Agrawal and their collaborators (Henderson and Agrawal, 2001; Henderson, Trajtenberg and Jaffe, 1998; Henderson, Trajtenberg and Jaffe, 1996) for their work on knowledge transfers from academic settings to industry, as evidenced by patent citations.
In summary, these are the salient questions we seek to answer:
* Are these researchers different from other researchers? If so, how are they different?
* How does Singapore compare with MIT?
2
Related Work
This thesis builds upon several well researched areas. In particular, we focus on the concepts of cluster formation, measurements of innovation, as well as the overarching issue of academia and industry interaction.
2.1 Concept of Cluster
The cluster concept was originally developed in 1990 by Harvard Business School (Cambridge, MA, USA) professor Michael Porter in a book called The Competitive Advantage of Nations, which describes clusters as the geographic concentrations of
interconnected companies, specialized suppliers, service providers, firms in related industries and associated institutions in particular fields that compete but also cooperate.
Today's economic map of the world is dominated by clusters or critical masses-in one place -of unusual competitive success in particular fields. Clusters are a striking feature of virtually every national, regional, state, and even metropolitan economy, especially in more economically advanced nations. Silicon Valley and Hollywood may be the world's best-known clusters. Clusters are not unique, however; they are highly typical and therein lies a paradox: the enduring competitive advantages in a global economy lie increasingly in local things -knowledge, relationships, motivation -that distant rivals cannot match.
Clusters are geographic concentrations of interconnected companies and institutions in a particular field. Clusters encompass an array of linked industries and other entities important to competition. They include, for example, suppliers of specialized inputs such as components, machinery, and services, and providers of specialized infrastructure. Clusters also often extend downstream to channels and customers and laterally to manufacturers of complementary products and to companies in industries related by skills, technologies, or common inputs. Finally, many clusters include governmental and other institutions - such as universities, standards-setting agencies, think tanks, vocational training providers, and trade associations - that provide specialized training, education, information, research, and technical support.
Clusters represent a kind of new spatial organizational form in between arm's-length markets on the one hand and hierarchies, or vertical integration, on the other. A cluster, then, is an alternative way of organizing the value chain. Compared with market transactions among dispersed and random buyers and sellers, the proximity of companies and institutions in one location-and the repeated exchanges among them fosters better coordination and trust. Thus clusters mitigate the problems inherent in arm's-length relationships without imposing the inflexibilities of vertical integration or the management challenges of creating and maintaining formal linkages such as networks, alliances, and partnerships. A cluster of independent and informally linked companies and institutions represents a robust organizational form that offers advantages in efficiency, effectiveness, and flexibility.
Previous studies and economic analysis demonstrate that clusters can raise innovation and productivity in a number of ways. Companies benefit from sharing knowledge with academic institutions about best practice and reduce costs by jointly sourcing services and suppliers. Frequent interactions between industry and academic institutions facilitate formal and informal knowledge transfer and encourage the formation and efficiency of collaboration between institutions with complementary assets and skills. There is also the "general importance of being in the midst of the buzz". (Krugman, P, 1998) The critical mass effect attracts further companies, investors, services, and suppliers into the cluster,
as well as creating a pool of skilled labor.
2.2 Academic Research Underlying Industrial Innovation
In recent years there have been great interest in the process by which firms benefit from externally performed R&D, and the extent and importance of such spillovers. In particular, Jaffe, Von Hippel and others have shown that technological changes in several key sectors of the economy have been influenced by academic research. (Jaffe, 1988; Von Hippel, 1989)
Beyond technological changes, research has also shown that research in universities contribute to the economy. About 11% of all new product innovations and 9% of all process innovations can be directly attributed to academic research in universities.
(Mansfield, 1995) This is especially relevant in high tech industries such as the biotechnology industry, where an even greater proportion of total research takes place in academic settings. In summary, universities represent a key component of a cluster, especially critical to knowledge formation and dispersal.
While there is a widespread belief that publicly funded research conducted at universities has a significant impact on the rate of economic growth, estimating the magnitude and describing the nature of this impact remains extremely difficult. Recent quantitative work in the area has focused particularly on patents as a measure of university "output" (Jaffe, 1989; Henderson, Jaffe and Trajtenberg, 1998), on licenses and on the new firms created by licenses (Gregorio and Shane, 2000; Jensen and Thursby, 1998; Thursby and Thursby, 2000), or on patents and licensing considered simultaneously (Mowery et al, 1998). As a logical extension, patent citation data has been widely used in a variety of studies concerning university innovation (Jaffe, Trajtenberg and Henderson, 1993; Jaffe, Fogarty and Banks, 1998; Jaffe and Trajtenberg, 1996).
Patent and license data has become particularly important in this context for three reasons. First, the patenting process requires that inventor names, dates, assignee institutions, locations, and detailed descriptions of invention claims be recorded. Such systematically recorded innovation-related details are very rare outside of patent records. Second, innovations that are patented are expected, by definition, to be commercially useful. Third, patenting data has recently become widely available in machine readable form, and aggressive research programs, coupled with the generous efforts of AUTM (The Association of University Technology Managers), has recently made much university licensing data available.2 A focus on patents and licensing as an important mechanism of knowledge transfer from universities to the private sector is thus understandable.
2 The Association of University Technology Managers was founded in 2001 with the aim of promoting, supporting and enhancing the global academic technology transfer profession through internal and external education, training and communication. <http:// www.autm.net/index_ie.html>
However while the role of academic research is acknowledged, the characteristics of the most active researchers in commercial life sciences research is largely unknown. Henderson and Agrawal (Henderson and Agrawal, 2001) suggest based on qualitative research work, that researchers largely do not embark on research agendas with either patent or paper outcome in mind. However, their quantitative results suggest that there exists a group of researchers who patent disproportionately more than their peers. While these results provide us with some intriguing preliminary insights into entrepreneurial faculty, as they authors point out, they raise as many questions as they answer. We still need to understand who are these researchers and how are they different from the other researchers.
3
Data and Methods
The heart of the thesis is an in-depth quantitative study of professors who are currently on the faculty at MIT, who are most active in life sciences or biomedical sciences related research. A total of 143 active full time faculty members are selected. Their affiliations are spread across six departments, namely Biology, Biological Engineering, Chemistry, Chemical Engineering, Whitehead Institute and Health Science and Technology (HST). Some of them hold joint appointments with more than one department.
MIT was chosen as the focal university as it is one of the premier research institutions in the United States. In 1998, MIT claimed almost 4% of all the patents given to American universities and received over 1.5% of all federal funding for science and engineering at universities and colleges in fiscal year 1999.3 Beyond that, MIT has been very important to the development of the biomedical hub in Cambridge, Massachusetts. Hence, a study of MIT is likely to yield useful insights for aspiring clusters such as Singapore.
For Singapore, we chose 145 researchers who are based in Singapore. These researchers are drawn from the 4 semi-autonomous institutions set up since 1998, with each institution focusing on specific areas of the biomedical sciences.4 They are the Institute of Cellular and Molecular Biology (IMCB), the Institute of Bioengineering and Nanotechnology (IBN), the Genome Institute of Singapore (GIS), Institute of Chemical and Engineering Sciences (ICES). These researchers were selected based on their affiliation, as well as their research work, which are in the life sciences.
For our study, we employ three main classes of information: * Patents
* Publications
* Other characteristics
3 NSF report: Federal Science and Engineering Support to Universities, Colleges, and Nonprofit
Institutions: Fiscal Year 1999.
4 The research institutes are semi-autonomous, with a central governing body called the Agency for Science, Technology and Research (A*STAR)
o Tenured status o Gender
o Scientific Advisory Board membership
Our research strategy is to first do a broad survey of the patent histories of all 143 MIT faculty members, as a means to identify those who are the most commercially active. To this end, we apply our set of quantitative methodologies to the patents. We then examine other pertinent characteristics of the researchers, such as their tenured status, gender and scientific board membership, to gain a complete holistic understanding of their interactions with industry. The essential aim of our research at this point, is to profile the researchers according to their Commercial Activity level.
The general survey done, we then focus on just the faculty members in the Biology department, where we attempt to tackle the more difficult question of the intent of the researchers, via a novel way of examining publication data. This would then allow us to profile researchers according to their Commercial Potential level.
This quantitative analysis is the repeated with Singapore's faculty members as the sample, before benchmarking Singapore against MIT.
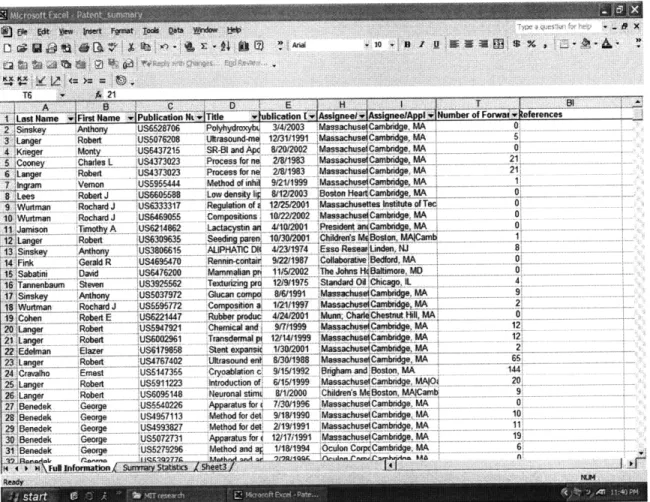
Our final data set includes information about 776 patents and 5,259 journal articles assigned to the sample faculty. We also explored 102 patents held by researchers in Singapore. The patent data was collected from the Delphion Research database5 and the United States Patent and Trademark Office (USPTO) website.6 We conducted keyword searches of the patents using the researcher names, irregardless of the assignee. Where ambiguity arise, we cross check with the researchers' listed patents on his curriculum vitae. The patents collected are only United States patents awarded by the USPTO and represents all patents awarded to the researchers, as of 9th of January, 2004.7 Figure 2 shows a sample of our patent data,
5 www.delphion.com
6 www.uspto.gov
8 Lees Robert J U:uS6055 Low ns~yu wzu 9e oston a,
Wurman Rochard J US633317 Regulation of 12/25/2001 Mass achusettes tnstitute of Tec 0
10 Wutman Rochard J US6469055 Compositons 10/2212002 MassachuseiCamrnbrdge, MA 0
arrison limoothy A UJS6214862 L acystn art 4/10/2001 Presd m bde, MA 0
12 Langer Robert US6309635 Seed pare 1013012001 Chidredts MBoston, MArarnb 1
14 Fink Gerald R US4695470 Rerinmcontarr 91221987 Coaboratie'Bedford, MA 0 1 Sabat... David .. U:6476200 Mammalian p 11/5/2002 The Johns H: Baltimore. M 0 iTarnnenbaum Steven U3925562 Tet g p 2/91975 Standard O Chicago 4
17 iSinskey Anthony US5037972 Gl ucan conpo 8/611991 Massachuse Cambridge MA 9 i1W artman Rochard US5595772 Cornposte am 101u MaihusesCamb rodgeA 2
SCohen RobetE 6221447 Rbber produ 4/24/2001 M ChaeChestnu ,MA 0
Robert S5947921 1999 Massachus Camb iMA 12:
2 Langer Robert US6002961 Tranqdermal pi 12/14/1999 MassachusetCamrbndge MA 12
2 Edelman Elazer US6179858 Stent expans 1130/2001 AMassachuseCam 2
23 'Laer Robert US4767402 Ultrasound er* 8/30/1988 Massachuse(CambnrdgeMA 6 2N4Crevatho Ernest US514735S Cryoablatron c 9/15/1992 Brgham and Boston. MA 144
2Langer Robert US5911223 Introduction of 615/1999 MassachuseiCambndge MAIO 20 2Langer Robert US6095148 Neuronal stmt 8/1/2000 Childrens MeBoston, MACamb 9
27 Benedek George 5540226 Apparatus for 7/30/1996 MassachuseCambndge, MA 0
28 Benedek George US4957113 Method for det 9/18/1990 MassachuseiCambrdge, MA 10
29 Benedek George .US4993827 Method for det 21191991 MassachuseiCambndge, MA 11
30 Benedek George 1US5072731 Apparatus for 12/17/1991 MassachuseCambndge, MA 19 31 'Benedek George US5279296 Method and 1/18/1994 , Oculon CorprxCambndge MA 6
Figure 2: Patent data
Publication data was collected from the Institute of Scientific Information's Science Citation Index8. We conducted key-word searches using the names of the researchers,
irregardless of assignee. Where ambiguity arise, we cross check with the curriculum vitae of the researchers. Only full journal articles are used in our analysis. Figure 3 shows a sample of our publication data.
Swww.webofscience.com
Figure 3: Publications data
4
Analysis of Results
4.1 MIT Results4.1.1
Table
Patents
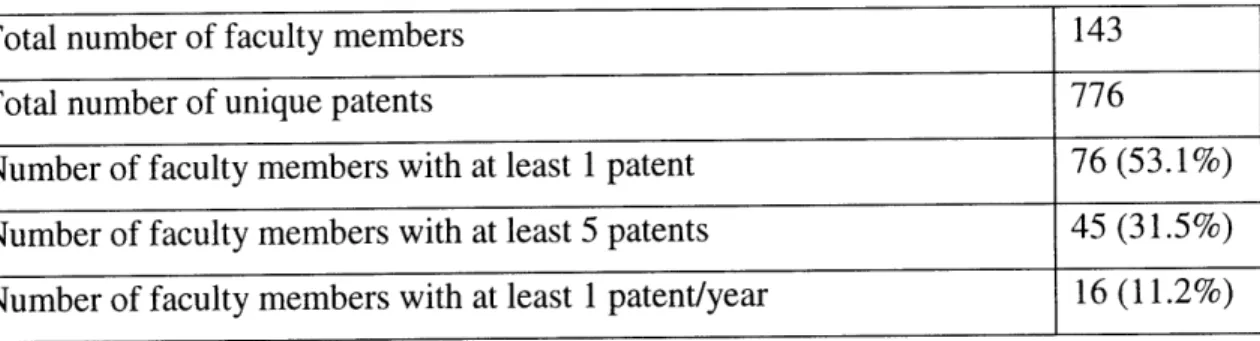
1 summarizes the descriptive statistics for the MIT faculty members.
Total number of faculty members 143
Total number of unique patents 776
Number of faculty members with at least 1 patent 76 (53.1%)
Number of faculty members with at least 5 patents 45 (31.5%)
Number of faculty members with at least 1 patent/year 16 (11.2%)
Table 1: Descriptive statistics for MIT faculty
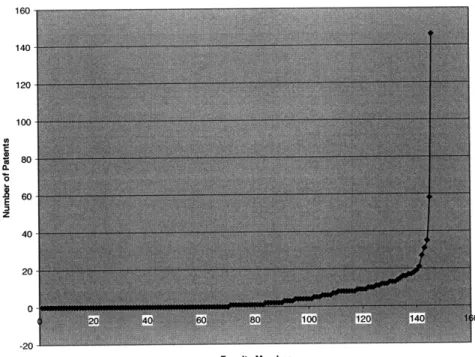
Figure 4 shows the distribution of the patents among the faculty members. We see that the patent ownership is strongly skewed towards a minority of researchers. Only about 11% of the faculty members have at least 1 patent/year. 47% of all the faculty members do not hold a single patent.9 On further analysis, it would be worthwhile to note that the top 10% (14) of the faculty members hold more than 57% (444) of the total number of patents. This is clearly seen in Figure 4.
9 This is based on what have been able to identify from the USPTO and Delphion databases and it is accurate barring no mistakes in spelling of the patent holders' names in the databases or incomplete records in the databases.
NUMBER OF PATENTS
--- NUMBER OF PATENTS
Faculty Member
Figure 4: Patents versus Faculty Member
Total Patents
U Rest of Faculty
ITop 10% Faculty
Figure 5: Top 10% of faculty members hold 57% of total number of patents.
The patent rate also shows that the majority of the patenting work has been performed by a minority of faculty members.
Patents per Year (Overall)
8
5
4 * Patents per Year (Overall)
2
0 20 40 60 80 100 120 140 160
Faculty Member
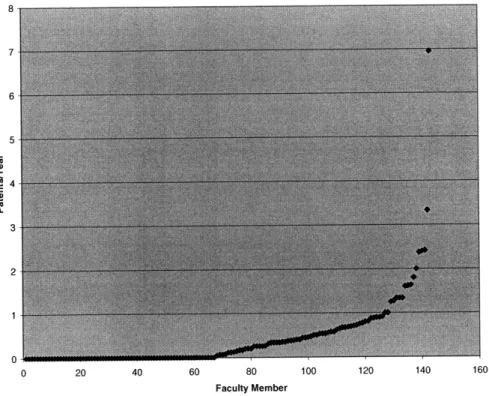
Figure 6: Patent Rate versus Faculty Member
This data is representative of the researchers' entire career to date, hence older faculty members would naturally be more heavily represented, due to their relatively longer careers. To prevent unfairly discounting relatively junior faculty, we now concentrate on patents that have been awarded only in the last 5 years (1999 to 2003) of our study. Figure 7 shows the patent rate of the faculty members in this period of time.
Patents per Year versus Faculty Member
12
ca I* Patents per Year (Overall)
a Patents per Year (1999-2003) " 6
2
0 20 40 60 80 100 120 140 160
Faculty Member
Figure 7: Patent Rates versus Faculty Member
This gives us a partial understanding of how commercial applications related research is conducted within the academic setting. However in our analysis, we also need to adjust for the quality of the patents to obtain a more comprehensive picture. Much work has already been done to investigate the patent-citation relationship, and we adjust the quality of the patents based on seminal work done by Trajtenberg (1990) and Henderson (1998). A widely cited patent has been shown to be an important contribution to technical
progress and to be of economic significance (Trajtenberg 1986). We use the measure of Mean Forward Patent Citation to account for the relative importance of each patent, adapted from Henderson's generality measure (Henderson, Jaffe and Trajtenberg, 1998).
Mean Forward Patent Citation = I# forward citations / I# patents
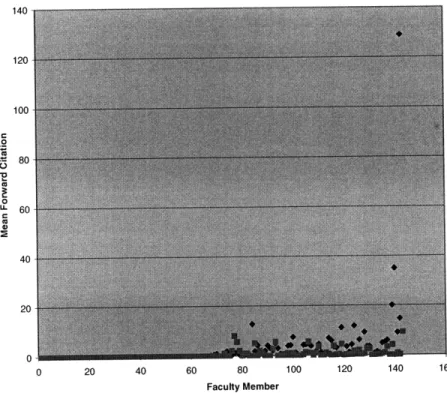
The higher the faculty member's Mean Forward Patent Citation, the more commercially productive his research work is. Figure 8 shows the Mean Forward Patent Citation of the researchers, for both their overall research career, and for the last 5 years.
Mean Forward Citation
* Mean Forward Citation (Overall)
I Mean Forward Citation (1999-2003)
20 40 60 80
Faculty Member
100 120 140 160
Figure 8: Mean Forward Patent Citation versus Faculty Member
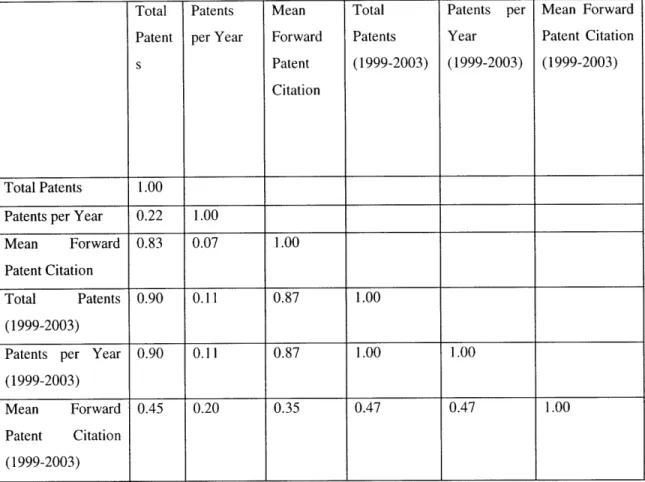
Table 2 extends this current line of analysis by showing the correlation coefficients between the patent rates, total patents and the Mean Forward Patent Citations, for both the researcher's overall active career and the last 5 years. The analysis is conducted for faculty members who have at least one patent.
Total Patents Mean Total Patents per Mean Forward Patent per Year Forward Patents Year Patent Citation
s Patent (1999-2003) (1999-2003) (1999-2003)
Citation
Total Patents 1.00
Patents per Year 0.22 1.00
Mean Forward 0.83 0.07 1.00
Patent Citation
Total Patents 0.90 0.11 0.87 1.00
(1999-2003)
Patents per Year 0.90 0.11 0.87 1.00 1.00
(1999-2003)
Mean Forward 0.45 0.20 0.35 0.47 0.47 1.00
Patent Citation
(1999-2003)
Table 2: Correlation Matrix for Patents, Patent Rate and Mean Forward Patent Citation
The results are interesting. The overall patent rate and the patent rate for the last 5 years show a strong correlation (0.90). This suggests that researchers who are active in commercially related research tend to be active throughout their careers.
We also see that the Mean Forward Patent Citation shows little correlation to the actual patent rate, both for the overall career (0.07) and for the last 5 years (0.47). This is an important result. This suggests that quality adjustment for the patents are critical in determining who are the researcher who have been most active in translating academic research into useful technology. As such, Mean Forward Patent Citation will form the key measure for our subsequent analysis.
We note that the Mean Forward Patent Citation for the overall career is not highly correlated to the Mean Forward Patent Citation for the last 5 years. This suggests that there may exist a considerable lag between the development of a technology, and the end of its usefulness in the market. Indeed literature suggests even after 25 years, forward citations do not tail off for the average patent. (see Jaffe and Trajtenberg, 2002, Chapter
13) Hence for our subsequent analysis, we will explore data for the last 5 years only, so
that junior researchers would not be discriminated against in our analysis.
4.1.2 Profiling the Researchers
The collective results thus far provide us with clear information as to who has been the most active in commercial related research. It is clear here that the majority of commercial related work is done by only a minority of the researchers. This allows us to capture the Commercial Activity dimension, of the researchers. However, while we can identify the most active researchers from our productivity measures, we still want to know if these "star" researchers can be distinguished by a set of characteristics.
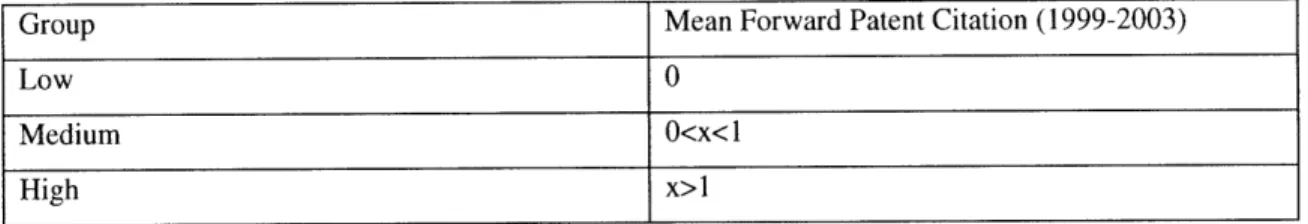
Towards this end, we conduct further statistical analysis. We first separate the faculty members into different bins, based on their Mean Forward Patent Citation for the period
1999-2003. We chose a set of threshold values to separate the researchers into 3 groups.
Group Mean Forward Patent Citation (1999-2003)
Low 0
Medium 0<x<1
High x>1
Where x is the Mean Forward Patent Citation (1999-2003)
Table 3: Faculty groups
We also compile a set of descriptive statistics of these researchers. These are: * Tenured status
* Scientific Advisory Board membership in commercial firms
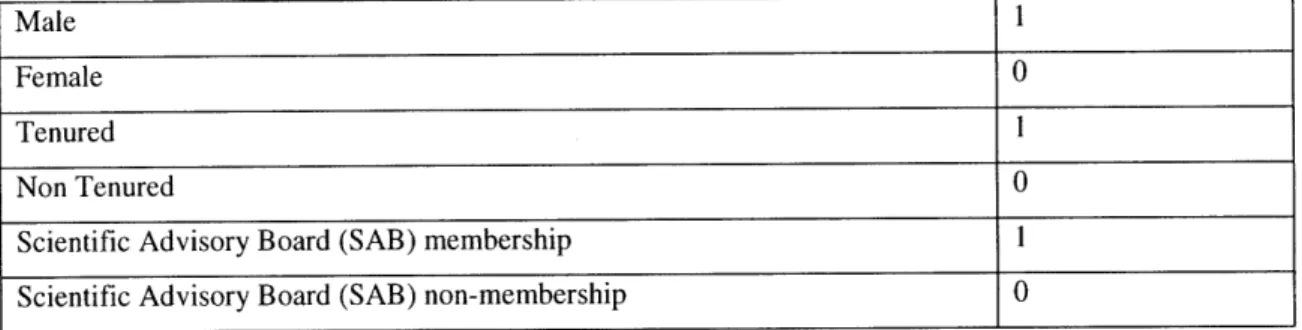
The research idea is to understand if Mean Forward Patent Citation is related to these variables. We assign a value of 1 or 0 for the tenured status, gender and scientific advisory board membership. This is summarized in Table 4.
Male 1
Female 0
Tenured 1
Non Tenured 0
Scientific Advisory Board (SAB) membership 1
Scientific Advisory Board (SAB) non-membership 0
Table 4: Variables values
We then run a series of T-tests for these variables, between each group of researchers. The aim is to find if there are any variables that are statistically significant, with regards to the researchers' variations in Mean Forward Patent Citations. The key assumption is that the underlying distribution of the variables is Poisson and random. The results of the tests are summarized in Table 5, 6 and 7.
Gender: Ho: mean(a) - mean(b) = 0
Low-High t= -0.1596, P= 0.8734
Medium - High t= 1.8406, P = 0.0724
Low - Medium t= -1.9508, P = 0.0536
Table 5: T-test for Gender
Tenured: Ho : mean(a) - mean(b) = 0
Low - High t=-2.3845, P = 0.0186
Medium - High t= -1.1216, P = 0.2681
Low - Medium t= -0.8752, P= 0.3834
Tenured: Ho: mean(a) - mean(b) = 0
Low - High t= -1.3068, P = 0.1937
Medium - High t= 0.5381, P = 0.5932
Low - Medium t= -1.7975, P= 0.0750
Table 7: T-test for Scientific Advisory Board Membership
The results are decidedly ambiguous. None of the comparisons for Gender, suggest that
the mean Gender variable is different across the comparison groups. For Tenured Status, only in one comparison group (Low-High) is the P value sufficiently low to reject the null hypothesis. This may be significant. It suggests that the Tenured status of the faculty may interact with the extent of the participation of the faculty members in commercially related research. For the Scientific Board Membership, comparisons between the Low and High groups, and the Low and Medium groups both suggest there is some statistical evidence, that the mean SAB membership variable is different. We investigate this further by regressing Mean Forward Patent Citation as a dependent variable against tenured status, gender and SAB membership, as independent variables.
We adopt a log-linear model with a underlying Poisson statistical distribution.l0 We model the equation as:
Ln(Fij) = p + )iA + jB + kijAB (2)
Ln(Fij) = is the log of the expected cell frequency of the cases for cell ij in the contingency table.
p, = is the overall mean of the natural log of the expected frequencies
A= terms each represent "effects" which the variables have on the cell frequencies
10 The above model is considered a Saturated Model because it includes all possible oneway and two-way
effects. Given that the saturated model has the same amount of cells in the contingency table as it does effects, the expected cell frequencies will always exactly match the observed frequencies, with no degrees of freedom remaining (Knoke and Burke, 1980).
A and B = the variables (Mean Forward Patent Citation, Tenured status, Gender and Scientific Advisory Board membership)
i andj = refer to the categories within the variables Therefore:
XiA = the main effect for variable A jB = the main effect for variable B
AijAB = the interaction effect for variables A and B
Low group is assigned value of 0, Medium is assigned 1, while High is assigned 2. The null hypothesis is that there are no interactions among the variables. Refer to Table 8 for the detailed regression results.
Dependent variable Mean Forward Patent Citation (1999-2003)
No. of observations 143
Tenured Status 0.98 (0.40) *
Gender 0.08 (0.35)
Scientific Advisory Board 0.35 (0.26) Membership
Intercept -1.64 (0.47)
Log Likelihood 0.13
*p<0.05; **p<0.01
Table 8: Mean Forward Patent Citation as a function of researcher characteristics. Saturated model. Standard errors in parentheses.
The P values for Tenured Status (0.01), Gender (0.538) and SAB membership (0.18) suggest that Gender and SAB membership is not a significant factor in determining the Mean Forward Patent Citation, but the Tenured Status is. This is potentially an important result. However, we run into the risk of misrepresenting the causality direction -- that is the Mean Forward Patent Citation or the commercial productivity of the faculty
members, could be influencing the Tenured Status of the researchers, instead of the other way round. Nevertheless, the results suggest there is interaction between these variables.
Collectively, the results suggest that the researchers are highly heterogeneous in their characteristics, and no clear set of characteristics appear to be uniquely associated with high patenting activities. The results do suggest that the tenured status could potentially be a factor in determining the commercial activities of a researcher. In the next section, we pry into the publication data of the researchers, and develop a set of statistical measures to compare them, to understand the relationship between patenting and publishing behaviors.
4.2 Biology Department
In this section, we introduce a novel way of examining publication data. The sample researchers are the faculty on Biology Department, a total of 61 faculty members. We choose to focus on a single department here because publication rates tend to differ substantially for different fields of research. Hence it might not be wholly fair to compare across departments.
Figure 9 shows the scatter plot of Mean Forward Patent Citation versus Publication Rate, for the period 1999 to 200311 , where the unit of observation is the faculty member. No
clear relationship is evident.
Publications per Year versus Mean Forward Citation (1999-2003) 20 18 16 14 > 12 . z=8 2 0 0 1 2 3 4 5 6 7 8 9
Mean Forward Citation
Figure 9: Publications per Year versus Mean Forward Patent Citation (1999-2003)
We next check for the correlation between total publications and total number of patents. The correlation is low, only 0.43. This suggests that patent activity does not appear to be significantly related to publishing activity.
Our aim now is to examine the publication stock of each researcher, and determine its kind. We broadly define journals to belong to three categories: basic research, applied
research and medical research. Then we categorize each published article according to its source journal. For example, an article published in Nature Biotechnology is categorized as an applied research article, while an article published in Science is categorized as a basic research article.
This classification could potentially be too sweeping. Moreover, some areas of research cannot be clearly defined as applied or basic, but rather is at the boundary. 12 However,
12 There is much debate with regards to the definition of basic and applied research. However, Basic
certain journals such as Nature Biotechnology and Protein Technology are clearly focused on applied research. We take a cautious approach here, by only defining a journal as Applied when it is completely unambiguous; otherwise the journal is labeled as Basic.
We establish the ratio of applied research articles to basic research articles for each researcher, and compare them to their respective Mean Forward Patent Citation for patents. The assumption here is that faculty members with a higher proportion of published articles that are applied in nature, have engaged in research that are more likely to translated into market innovations. Thus by examining their publication stock for the ratio of applied to basic research articles, we are also uncovering the respective research areas and focuses of each faculty member.
We estimate specifications of the general form
Mean Forward Patent Citation (patents) = flo + P/32 Ratio of Applied to Basic Research
Publications +6xit + c (3)
Where xit is a vector of control variables and e is the error term.
Refer to Table 9 for the full regression results. We control for the tenured status, gender, total number of basic research articles, total number of applied research articles and the Scientific Advisory Board membership of the faculty members.
the advancement of knowledge and the theoretical understanding of the relations among variables.
Applied Research on the other hand is done to solve specific, practical questions; its primary aim is not to
gain knowledge for its own sake. It can be exploratory but often it is not. It is almost always done on the basis of basic research. For more on the distinction between basic and applied research, refer to Holton and Sonnert (1999), and Branscomb (1999).
Dependent variable
No. of observations
Ratio of applied research to basic research articles (1999-2003)
Number of basic research articles (1999-2003)
Number of applied research articles (1999-2003)
Tenured Status Gender
Scientific Advisory Board Membership
Intercept
R2
Adjusted R2
Mean Forward Patent Citation 61 1.37 (0.44) ** 0.10 (0.15) 0.14 0.13
Mean Forward Patent Citation 61 2.02 (0.74) ** 0.01 (0.01) -0.06 (0.05) 0.05 (0.32) 0.25 (0.35) -0.34 (0.31) -0.02 (0.38) 0.16 0.10 *p<0.05; **p<0.01
Table 9: Mean Forward Patent Citation as a function of publication behavior. Fixed effect models. Standard errors in parentheses.
The results are very interesting. The results suggest that the Mean Forward Patent Citation is positively related to the ratio of applied to basic research publications.
Even after controlling for the control variables, the results indicate that the Mean Forward Patent Citation is positively related to the ratio of applied research articles to basic research articles. Our results suggest that the area of research (as determined from a broad distinction between basic and applied research articles) strongly predicts a
researcher's patenting activity and commercial productivity, as measured by his Mean Forward Patent Citation. In fact the effect is enhanced after controlling for the variables
(the coefficient increases from 1.37 to 2.02).
This set of results captures the missing dimension that previous studies have typically failed to address. It suggests that the level of useful Commercial Activity of a researcher depends strongly on the level of Commercial Opportunity that the researcher affords himself. The more inclined towards applied science research the research is, the more likely he is active in commercial related work.
Lastly, we turn to the difficult question of the degree to which patenting acts as a substitute or complement to the process of conducting fundamental research. In commercial settings, basic, or "fundamental", research is often considered a substitute for more applied work (Cockburn, Henderson and Stern, 2001). Several observers have worried that a similar dynamic may be at work within universities, and that an increasing focus on the commercial implications of university research may skew university faculty away from the more fundamental work that universities were originally created to produce.
To this end, we examine the relationship between the number of basic research articles, applied research articles, ratio of applied research to basic research articles, as well as the overall number of publications. Table 10 shows the correlation coefficients between these variables.
# basic research # applied Ratio of applied Number of Mean articles (1999- research articles research to articles Forward 2003) (1999-2003) basic research (1999-2003) Patent
articles (1999- Citation 2003) (1999-2003) # basic 1.00 research articles (1999-2003) # applied 0.38 1.00 research articles (1999-2003) Ratio of -0.16 0.64 1.00 applied research to basic research articles (1999-2003) Number of 0.94 0.55 0.00 1.00 articles (1999-2003) Mean Forward -0.11 0.12 0.38 -0.08 1.00 Patent Citation (1999-2003) *p<0.05; **p<0.01
Table 10: Correlation Matrix for number of basic research articles, number of applied research
articles, ratio of applied research to basic research articles, total number of articles and Mean Forward Patent Citation
The results suggest there is a very slight tradeoff between the number of basic research
articles and the ratio of applied research to basic research articles. This is supported by the slight tradeoff we see between the Mean Forward Patent Citation (1999-2003) and the
little correlation between the ratio and the total number of articles for each researcher. In other words, the publication output does not appear to be affected by the choice of the research agenda.
We extend this line of analysis by examining the relationship between the total patent stock of the researcher from 1999 to 2003, and his total publication stock for that corresponding period. Again, we estimate specifications of the general form
Total Number of Patents = f3o + /#2 Total Number of Publications +&it + e (4)
Where xit is a vector of control variables and e is the error term.
Refer to Table 11 for the full regression results. We control for the tenured status, gender, total number of basic research articles, total number of applied research articles
Dependent # of # of # of # of # of
variable Publications Publications Publications Publications Publications (1999-2003) (1999-2003) (1999-2003) (1999-2003) (1999-2003) # 61 61 61 61 61 observations # of patents 1.97 (0.63) ** 1.98 (0.63) ** 1.68 (0.62) ** 1.39 (0.62) * 0.50 (0.67) (1999-2003) Ratio of -1.15 (7.18) -4.79 (7.09) -5.70 (6.91) -7.81 (6.56) basic research to applied research articles (1999-2003) Tenured 11.86 (5.11) * 12.70 (4.98) * 14.49 (4.74) ** Status Gender 10.78 (5.11) * 6.64 (5.04) Scientific 14.13 (4.02) ** Advisory Board Membership Intercept 21.27 (2.46) 21.48 (2.49) 13.78 (4.27) 5.40 (5.75) 4.68 (5.43) R2 0.14 0.14 0.22 0.28 0.37 Adjusted R2 0.13 0.11 0.18 0.22 0.31 *p<0.05; **p<0.01
Table 11: Number of publications as a function of number of patents. Fixed effect models. Standard errors in parentheses.
The results are very interesting. The total number of publications is statistically positively correlated to the total number of patents, without controlling for the control variables. As we include the tenured status, gender and the ratio of applied to basic research articles, as control variables, the effect is reduced but is still significant. However, once SAB membership is added, the effect of total number of patents is no
longer significant. SAB membership, together with the tenured status is the most significant variables. It is important to note the R2 values have increased consistently as we add the control variables, indicating a closer fit of the data points to our proposed model.
The results suggest there is considerable interaction between the SAB membership of the researcher and his total publication. This is understandable, since commercial firms are likely to want to only hire prominent and widely publishing faculty members as their scientific advisors. However, we want to investigate this further. We first eliminate the effect of tenured status on the regression, by only examining tenured faculty members. Again, we estimate specifications of the general form
Total Number of Patents = fo + f2 Total Number of Publications +6xit + e (5)
Table 12 summarizes the results. The control variables are the ratio of applied to basic research articles, gender and SAB membership of the faculty members.
Dependent Variable # of Publications # of Publications
(1999-2003) (1999-2003)
# of Observations 46 46
# of Patents 1.70 (0.69) * 0.33 (0.73)
Ratio of applied to basic -8.90 (7.14)
research articles
(1999-2003)
Gender 6.89 (6.19)
Scientific Advisory Board 18.62 (6.26) **
Membership
Intercept 24.52 (3.08) 18.25 (5.23)
R 0.12 0.34
Adjusted R2 0.10 0.27
*p<0.05; **p<0.01
Table 12: Number of publications as a function of number of patents, for tenured faculty only. Fixed effect models. Standard errors in parentheses.
After controlling for the control variables, only the SAB membership variable is significant. This is a highly significant result. Together with the earlier, more general regression, it suggests that after controlling for the characteristics of the faculty members, the patenting and publishing behaviors of the faculty members bear little relation to each other. These series of results echo that of Henderson and Agrawal's. (Henderson, R and Agrawal, A, 2001)
On the other hand, our results also suggest that the SAB membership and tenured status of the faculty members interact significantly with the publishing behavior of the faculty members. This is expected, as high rates of publishing should help a researcher's cause
for tenureship, while commercial firms would naturally seek out researchers who are prolific and prominent.
To achieve a complete understanding, we now test the reverse relationship and estimate the effect of publication output on patent output. Table 13 shows the key statistics.
Dependent # of Patents # of Patents # of Patents # of Patents # of Patents
variable (1999-2003) (1999-2003) (1999-2003) (1999-2003) (1999-2003) # 61 61 61 61 61 observations # of 0.07 (0.02) ** 0.07 (0.02) ** 0.07 (0.02) ** 0.06 (0.03) * 0.02 (0.03) publications (1999-2003) Ratio of basic 0.65 (1.37) 0.43 (1.43) 0.30 (1.43) -0.41 (1.34) research to applied research articles (1999-2003) Tenured 0.69 (1.07) 0.85 (1.08) 1.52(1.01) Status Gender 1.05 (1.09) 0.23 (1.03) Scientific 3.28(0.99) ** Advisory Board Membership Intercept 0.06 (0.71) -0.07 (0.76) -0.41 (0.93) -1.12 (1.19) -1.94 (1.09) R2 0.14 0.15 0.15 0.17 0.31 Adjusted R2 0.13 0.12 0.11 0.11 0.24 *p<0.05; **p<0.01
Table 13: Number of patents as a function of number of publications. Fixed effect models. Standard errors in parentheses.
The results are very similar. Once we control for SAB membership, the number of publications is no longer significant. This reinforces our results that the publishing behavior and patenting behavior are not correlated.
The collective results shed new light on the interface between academic research and commercial applications. While previous studies (see Henderson and Agrawal, 2001) have suggested that neither patenting nor publishing is generally the motivation for selecting a particular research agenda, our quantitative method of analyzing the kind of publications the researcher publishes, suggests that the research agenda and material directly impacts the patenting and commercial activity of the researcher. On the other hand, the choice of the research agenda does not significantly impact the total publication output of the researchers.
4.3 Singapore
We now turn finally to our analysis on Singapore. It is worthwhile to bear in mind that Singapore is a relatively newcomer into biomedical sciences research. Both the researchers as well as the research institutes, are very new relative to MIT.13
We will retain the same measures we have used throughout this thesis. The main instrument of measure, will be the quality adjusted Mean Forward Patent Citation of the researchers, for the last five years (1999-2003). Table 10 summarizes the key statistics for Singapore.
Total number of faculty members 145
Total number of unique patents 102
Number of faculty members with at least 1 patent 13 (9.0%) Number of faculty members with at least 5 patents 5 (3.4%)
Table 14: Descriptive statistics for Singapore faculty
13 The oldest research institute in our studies here is the Institute of Molecular and Cell Biology which was set up only in 1987.
Figure 10 shows the scatter plot of the number of patents held by the researchers, for both their overall careers and for the last five years.
Number of Patents 45.. . . 40 35 30 20 0 20 40 60 80 100 120 140 160 Faculty Member * Number of Patents
v Number of Patents (last 5 years)
Figure 10: Number of Patents versus Faculty Member
It is clear from the scatter plot that the majority of the researchers do not patent or have
yet to patent. The latter is more likely to be the case, bearing in mind the youth of the
research institutes. The statistics tell a similar story. Only 9% of the faculty members
hold any patents, and only 8% of the faculty members have had at least one awarded patent in last five years. It is worthwhile to note that the top 2 researchers in terms of individual number of patents, are both recently hired foreign scientists, one a Nobel laureate and the other, a tenured Chemical Engineering Professor in MIT.14
14 They are Sydney Brenner of the Salk Institute and Jackie Ying of MIT. Both started their collaborations
with Singapore in 2002. Jackie Ying is also the Executive Director of the Institute of Bioengineering and
We adjust for the quality of the patents via the established measure that we have developed in this thesis, the Mean Forward Patent Citation. The overall statistics remain the same. A large majority of the researchers are not commercially active yet.
Mean Forward Citation
* Mean Forward Citation
' Mean Forward Citation (last 5 years)
0 20 40 60 80 100 120 140 160 180
Faculty Member
Chapter
5
Conclusion
This thesis has taken a broad survey of the commercial activities of the researchers in MIT and Singapore. In this Chapter, we will draw upon the results we have obtained from our research, and derive possible policy recommendations for the developing biomedical cluster in Singapore
Our results suggest that Singapore has some way to go before it can emulate MIT's level of commercial activity. The proportion of scientists that are commercially active in MIT far exceeds that in Singapore. This is understandable, given the disparity in the age of the
respective institutions.
Our results also suggest that the level commercial activity of the researchers in MIT's Biology department are highly correlated to the choice of research material. Researchers with a stronger bent towards applied research are likely to be commercially more active as well.
This is important for Singapore as it seeks to develop it own biomedical cluster. The role of academic research is well acknowledged already, as can be seen from the massive expansion of research facilities, and investment in recruiting scientists from all over the world. 15 However this may not be enough. It is important to note that Singapore can
potentially do better by recruiting and fostering scientists with greater focus on applied research, as this is likely to yield greater commercial returns to Singapore.
This is not to discount the importance that basic science research plays. Basic science research is key to building the scientific knowledge foundation upon which future research may build upon. However, our results do suggest that Singapore may need to increase the level of applied science research in the research institutes, as a proportion of the total research conducted, to emulate MIT's role in the development of the Cambridge biomedical cluster. Moreover, this is supported by our findings that the overall
15 Singapore has invested committed US$1.7 billion towards biotechnology investments, while constructing a new 200 hectare industrial park for the life sciences, called the Biopolis.
publishing rates of the researchers are not correlated to the relative level of applied science research conducted.
Clearly much remains to be done. We need to conduct a much finer grained analysis of the different channels different firms access information. It is important to realize that patents are not the only channel for university research knowledge to be accessed and utilized by commercial firms. Indeed, some studies (see Branstetter, 2000; Cohen et al, 1998) have suggested that even within MIT itself, patents may represent only a relatively small channel for the transfer of knowledge out of the university.
In addition, we need to focus on the effect of time on the commercial activity of faculty members. The commercial activity of faculty members can change along their careers, and as our results suggest, the tenured status of the researchers appear to be correlated with the level of commercial activity. Such more in depth studies on the heterogeneity of faculty behavior and characteristics are key to our further understanding. We are hopeful that the data presented in this thesis will allow us to make progress on understanding these.