A Controllable Laser Projector for Diverting
ARCWVE6
Traffic
by
Brian Xiuken Wu
Submitted to the Department of Electrical Engineering and Computer
Science
in partial fulfillment of the requirements for the degree of
Master of Engineering in Electrical Engineering and Computer Science
at the
MASSACHUSETTS INSTITUTE OF TECHNOLOGY
May 2013
@Massachusetts
Institute o&Technology 413.
i4_7NSTTUT1j
ITU
OT2
9
2013
LRARIES
All rights reserved.
The author hereby grants to M.I.T. permission to reproduce and to
distribute publicly paper and electronic copies of this thesis document
in whole and in part in any medium now known or hereafter created.
Author ...
Department of Electrical Engineering and Computer Science
May 24, 2013
C ertified by ...
Seth Teller
Professor of Computer Science and Engineering
Thesis Supervisor
Accepted by ...
Prof. Dennis M. Freeman
Chairman, Masters of Engineering Thesis Committee
A Controllable Laser Projector for Diverting Traffic
by
Brian Xiuken Wu
Submitted to the Department of Electrical Engineering and Computer Science on May 24, 2013, in partial fulfillment of the
requirements for the degree of
Master of Engineering in Electrical Engineering and Computer Science
Abstract
For this Master's thesis, I designed and implemented a combined laser and controller system that can receive and convert commands from a computer into useful laser projections.
In the last 10 years, on average, one police officer, who is conducting a vehicle stop or directing traffic, is struck and killed by an oncoming vehicle per month in the United States. Most of these instances occur at night. Current literature proposes that for some drivers, especially those who are fatigued, the combination of bright, rapidly flashing emergency lighting causes them to drive closer to a emergency vehicle rather than away from it. An effective solution to this problem is to extend the visual range of warning lights.
Existing methods of lane diversion are time consuming, bulky and/or dangerous to deploy. The project is a system that allows the officer to quickly delineate a series of laser points to simulate a line of road-side flares. This will result in a commonly-used, perceptually salient visual signal that will induce traffic away from the cruiser.
The controller interfaces with the police officer's computer over a USB 2.0 inter-face. Internal EEPROM allows the system to store up to 100 unique coordinates and intensities. The communication protocol is handled with the SerialPy library. Testing and calibration of the laser projector is integrated with a simple UI and rear-facing cameras. The UI also allows the user to select arbitrary points for the laser spots to be projected on to, creating a series of virtual flares.
Using a cylindrical lens to expand the laser beam and reduce divergence, we were able to focus the laser spot accurately to 50m, increasing optical power density and increasing visual recognition at a distance. The laser output power can be configured from 0.2mW to 1W using a PWM driver.
Thesis Supervisor: Seth Teller
Acknowledgments
My deepest thanks goes to Ezra Milby and Dan Creeden at BAE for the use of their facilities, equipment, logistic support, and manufacturing; the Massachusetts State Police, the National Institute of Justice and the Cambridge Police Department for their advice and opinions; Yafim Landa, Ross Finman, Jamie Karraker, Pallavi Powale, Berthold K. Horn and Bayley Wang of MIT CSAIL for their wisdom; my advisor Seth Teller for supporting me; and my parents for everything else.
Contents
1 Introduction 12
1.1 Incidence of Roadside Accidents . . . . 12
1.1.1 Human Visual Response . . . . 13
1.2 Current Light Solutions . . . . 15
1.2.1 Pyrotechnic Flare . . . . 15
1.2.2 Chemical Flare . . . . 16
1.2.3 LED/Strobe Flare . . . . 16
1.2.4 Evaluation of Current Solutions . . . . 16
1.3 Proposed Solution . . . . 17 1.4 Outline. . . . ... . . . . .... ... . . . . .. . . . ... 18 2 Technical Background 19 2.1 Optics . . . . 19 2.1.1 Divergence . . . . 19 2.1.2 Reflectivity of Pavement . . . . 20 2.1.3 Foreshortening Effect . . . . 21
2.1.4 Reverse Foreshortening Effect . . . . 21
2.2 Lasers . . . . 22
2.2.1 Hazards . . . . 22
2.2.2 Safety Standards . . . . 24
3 Design and Components 3.1 Structure ... ... 3.2 LC M . . . . 3.3 Data Protocol. . . . . .. . . . . 3.3.1 FTD1232. . . . .. . . . . 3.4 Controller . . . .. . . . .
3.4.1 State and Memory . . . .
3.4.2 Digital to Analog Converter (DAC)
3.4.3 Single-to-Differential converter . . . 3.5 Galvanometer . . . . 3.5.1 PWM Generator . . . . 3.6 Laser Source... ... ... . . . . 3.7 Optical Assembly . . . . 3.8 Safety Circuit . . . . 3.8.1 Acceleration Detector . . . . 3.8.2 Ultrasonic Detectors . . . .
3.8.3 Laser Reflection Detector . . . .
3.8.4 Key Switch . . . .
3.8.5 Relay Driver . . . .
3.9 Safety Observations . . . .
3.9.1 Hazard Zones
4 Tests and Results
4.1 Optics . . . .
4.2 Electronics . . . .
4.2.1 Power Consumption
4.3 Laser Projection . . . .
4.3.1 Calibration . . . . .
4.3.2 End to end testing .
28 . . . . 28 . . . . 30 . . . . 30 . . . . 32 . . . . 33 . . . . 34 . . . . 34 . . . . 35 . . . . 35 . . . . 36 . . . . 36 . . . . 38 . . . . 39 . . . . 39 . . . . 40 . . . . 41 . . . . 41 . . . . 42 . . . . 43 43 46 46 46 46 47 47 49
5 Future Developments 55
5.1 O ptics . . . . . 55
5.1.1 Multiple Laser Sources Integration . . . . 55
5.1.2 Optical Alignment . . . . 57
5.1.3 Wide Angle Projection Accuracy . . . . 57
5.2 Electronics . . . . 58
5.2.1 DC Power conversion . . . . 58
5.2.2 Inertial Feedback . . . . 58
5.2.3 Improved Galvanometer Feedback . . . . 59
6 Conclusion 60 A Schematics and Board Layouts 62 A.1 Galvanometer Controller . . . . 62
A.2 PWM Driver . . . . 62
A.3 Safety Relay Driver . . . . 62
A.4 Communication Board . . . . 63
A.5 Accelerometer . . . . 63
A.6 Laser Reflection Detector . . . . 63
A.7 Ultrasonic Detector . . . . 64
A.8 Power Conversion . . . . 64
B States and Instruction Protocol 72 C Safety Regulations 76 C .1 A N SI . . . . 76 C.1.1 ANSI Z136.6-2000. . . . . 76 C .2 F D A . . . . 78 C .3 FA A . . . . 78 D Police Procedures 92 D.1 Before Traffic Stop . . . . 92
D.2 D.3
D.4
During Traffic Stop . . . . Concerns. . . . . Im ages . . . .
E Formulas
E .1 O ptics . . . .
E.1.1 Beam Expansion . . . .
E.1.2 Divergence . . . . E.2 Laser Projection . . . . E.2.1 Foreshortening Effect . . . .
E.2.2 Reverse Foreshortening Effect . . E.3 Optical Safety . . . . E.3.1 Classification . . . .
E.3.2 Effective Divergence . . . . E.3.3 Maximum Permissible Exposure
E.3.4 Nominal Ocular Hazard Distance
E.3.5 Interference Distances . . . .
F Code Examples 92 93 93 95 95 95 95 97 97 97 98 99 100 100 100 101 103
List of Figures
1-1 Pyrotechnic Roadside Flare; source: Wikipedia . . . . 15
1-2 SnapLightTMFlare; source: disclose.tv . . . . 16
1-3 PowerFlareTM; source: powerflare.com . .. . . . 17
2-1 Laser Beam with divergence Source: Wikipedia . . . . 19
2-2 Specular and Lambertian Diffuse reflection; source: Wikipedia . . . . 20
2-3 Foreshortening and Reverse Foreshortening Effects . . . . 21
2-4 Cross section of an eye . . . . 23
2-5 Layout of 2-axis Galvanometer; Source: Thorlabs . . . . 27
2-6 Galvanometer; source: Thorlabs . . . . 27
3-1 Top Level Component Layout . . . . 29
3-2 Example of a command to the Controller . . . . 31
3-3 Example of loading a word array of size N to the controller . . . . 31
3-4 Acknowledgement sequence returned to the Computer . . . . 32
3-5 Controller Board . . . . 33
3-6 Galvanometer System . . . . 35
3-7 Driver for PWM Laser . . . . 36
3-8 Pulse Width Modulation and Average Power; source: embedded-labs.com 37 3-9 PW M Laser . . . . 37
3-10 Optical Properties of PWM Laser . . . . 38
3-11 Cylindrical Lenses in Galilean Beam Expander . . . . 38
3-12 Com plete Setup . . . . 39
3-14 Light Magnitude Detector Layout . . . .
3-15 K ey switch . . . .
4-1 Laser Projection, with Observer 30m away . . . . .
4-2 Foreshortened PWM Laser spot on Asphalt Sample 4-3 View of Laser Spot from Projector . . . .
View of Laser Spot 15m away . .
Defining Calibration Points . . .
Calibration Rectangle . . . .
Mapping input and output points Selecting Flare Positions . . . . . Generation of Flares . . . .
Star (5 Points) . . . .
Series of Flares (8 Points) . . . .
5-1 Comparison of Total Reflectance of Ro
5-2 Beam Mixer with Beam Expander . .
adside surfaces
5-3 Large Angle Distortion of Galvanometer Projection
5-4 Large Angle Distortion of Projection . . . .
A-1 A-2 A-3 A-4 A-5 A-6 A-7 A-8 A-9 A-10
Controller Board Schematic . . . . Controller Board Layout . . . . PWM Laser Response to High Frequency Safety Relay Overview . . . . Safety Relay Driver Schematic . . . . Safety Relay Driver Board . . . .
Relay Logic Test . . . .
FTD1232 Board; source: SparkFun . . .
Acceleration Detector . . . . Optical Detector Filter . . . .
PWM
A-11 Laser Reflection Detector . .
. . . . 41 42 4-4 4-5 4-6 4-7 4-8 4-9 4-10 4-11 47 48 49 50 50 51 51 52 52 53 54 56 56 57 58 65 66 66 67 68 69 69 70 70 70 71 . .
A-12 Ultrasonic Detector . . . .7
C-1 Required Control Measures, Page 1 . . . . 79
C-2 Required Control Measures, Page 2 . . . . 80
C-3 Optical Parameters . . . . 81
C-4 Range Nonogram Calculator . . . . 82
C-5 Visual Interference Levels . . . . 83
C-6 Diffuse Hazard intensity from a Pulsed Laser . . . . 84
C-7 Example of Buffer Zone . . . . 85
C-8 Luminous Efficiency . . . . 86
C-9 Letter of Notification to the FDA . . . . 87
C-10 Example Warning Sign . . . . 88
C-11 Application for Outdoor Laser Use, page 1 . . . . 89
C-12 Application for Outdoor Laser Use, page 2 . . . . 90
C-13 Variance from the FAA . . . . 91
D-1 Rear of MSP Cruiser . . . . 93
D-2 Cruiser Interior Computer . . . . 94
D-3 Cruiser in a Traffic Stop . . . . 94
E-1 Gaussian x10 Beam Expander E-2 Laser beam with minimum width W, divergance E Source: Wikipedia E-3 Foreshortening and Reverse Foreshortening Effects . . . . 96 96 97 Listener Program Flow . . . . Scanning Sequential Points Program Flow . . . . . Command Parser Flow . . . . Controller Program Flow . . . . Interrupt Routine Flow . . . . . . . . 120 . . . . 121 . . . . 122 . . . . 123 . . . . 124 F-1 F-2 F-3 F-4 F-5 71
List of Tables
2.1 Laser Classes for Continuous Visible Light (400nm-700nm) (FDA) . . 23
3.1 Hazard Distances for the PWM primary laser beam . . . . 44
3.2 Hazard Distances for the PWM diffuse reflection . . . . 45
4.1 Power Consumption of Device Elements . . . . 48
A. 1 Voltage Sources for the Projector . . . . 64
B. 1 Controller Instruction Set . . . . 73
B.2 Controller States . . . . 74
B.3 Logic States of Relay Driver . . . . 74
Chapter 1
Introduction
1.1
Incidence of Roadside Accidents
Despite the use of vehicle-mounted emergency lighting (VMEL) systems to alert drivers, police cruisers parked along the roadside are still frequently struck by drivers, leading to injuries or fatalities. In the years 2000-2009 inclusive, 120 officers were killed by being struck by a vehicle, an average of one fatality per month. 47 of these deaths occurred while the officer was conducting a "Traffic stop, roadblock, etc.", and the other 73 occurred while the officer was "Directing traffic, assisting motorist, etc" [U.S. Department of Justice, Federal Bureau of Investigation, Criminal Justice Information Services Divison, 2009]. The majority of these fatalities happened when the police cruiser was stationary.
A large proportion of traffic accidents with stopped police vehicles happened
be-tween midnight and 6 AM; major factors were determined to be drunken driving and fatigue [Agent and Pigman, 1990]. Other researchers have found that most road-side accidents with police vehicles occur along straight, dry roads in clear weather
[Solomon and Ellis, 1999]. Inclement weather is not the key or even leading cause of the accidents. There must be a failure, end-to-end between the police vehicle current diverting scheme, and the ability of drivers to comprehend and maneuver around it.
1.1.1
Human Visual Response
Much resarch has been done on the human visual system and its response to lumi-nous cues. Mortimer [1969] proved that spatially extended light sources are more conspicuous than point sources. Croft [1971] noted that moving light sources are more conspicuous than static ones. Bullough et al. [2002] stated "[A]n array of small point sources can be more effective than an equivalent diffuse source at eliciting rapid visual responses." Bullough et al. [2001b] evaluated "sweeping" rear brake lights vs. instant-on LED sources, and found that LEDs yielded faster response times. The combination of these factors lends themselves to a large, modulating, and optically
'moving' light source, such as the VMEL system.
Olson [1993] describes a condition called "night myopia", when the eye focuses closer than infinity when dark-adapted, making objects at visual infinity (usually 20 feet or more away) out of focus. It becomes more difficult for night drivers to accurately assess the location and distance of the police officer at night.
Smith et al. [2001] states that the apparent expansion rate of an object is the main factor of a driver's response to it. The faster the object expands in one's field of view, the more attention it will receive. Chemical flares are invaluable in this regard. When drivers pass near the flares, the spatial movement alerts the driver on how fast he is moving at some distance away from the police officer. The driver now has time to react before passing the cruiser itself.
The Moth Effect
The "moth effect" is when a driver inadvertently steers a vehicle towards a bright light in their field of vision. Clark et al. [1953] noted that pilots experienced a narrowed field of attention which excluded perception of visual stimuli when faced with a bright light source.
Helander [1978] found a 1-degree change in steering angle toward oncoming
traf-fic, for several seconds before the passing event, after initially steering away. He
reported seeing a steering bias in the direction of the driver's view.
Charles et al. [1990] suggests that highly visible lighting "decreases the ability of oncoming traffic to recognize and respond to other information salient to safe driving". Kitamura et al. [1994] concurs with this assessment, and demonstrated that noticing a flashing light on a parked car actually caused the driver to steer closer to the car, more so than if the driver did not notice the light. The "moth effect" suggests that the VMEL system on cruisers may have the opposite effect on certain drivers, causing them to drive closer instead of being diverted away. The reduced distance between the oncoming vehicle and police cruiser will result in a higher accident rate.
Olson [1993] rejects the existence of the moth effect, countering that the failure to accurately estimate differences in speed is the cause of many highway collisions with stopped vehicles. Olson also notes that a tall light source, or light sources spaced closely together, will make the stopped behicle appear farther away than it actually is. He attributes this effect to driver expectation in lighting placement on cars. VEMLs are currently used and mounted on the roof of the car; using Olson
[1993], as a guide, this would make the police vehicle subjectively appear twice as far
as it actually is, giving oncoming drivers false information on where the cruiser is and how much buffer space they have.
Design of Emergency Lighting Systems
Berkhout [1979] studied lighting configurations and color compinations, and had sub-jects gauge speed and directions under a variety of experimental conditions. The expected advantege of traditional blue emergency lighting at night was not observed, as blue light was not thought to 'ruin' night vision like green light does. The best light configuration depended on relative motion between the light source and driver. Some light schemes unfortunately produced the illusion of receding motion when the source was at rest, again confusing the driver on the relative velocity between his/her vehicle and the cruiser.
Bullough et al. [2001a] identified factors that determined visibility of an emergency vehicle to other drivers: mounting location; temporal light characteristics; spatial
light characteristics; spectral characteristics and luminous intensity. He noted that people reacted much faster to changes in vehicle speed when the vehicle employed a steadily changing light, rather than a quickly flashing light. Common VMEL patterns utilize quickly strobed lights, potentially reducing the signals efficacy.
Sensor Technology Integrated into Police Vehicles
Police cruisers are currently installed with sensing equipment to aid law enforcement, such as radar and lidar systems to gauge the relative speed of other vehicles from the cruiser [Kustom Signals, 2011]. The feedback is an audible tone that changes pitch and volume based on the relative velocity of traffic. The police officer can estimate the passing traffic speed based on the relative tone of the radar speakers.
1.2
Current Light Solutions
1.2.1
Pyrotechnic Flare
Figure 1-1: Pyrotechnic Roadside Flare; source: Wikipedia
Pyrotechnic flares, or fusee, use intense exothermic combustion to generate a red-yellow light. Current flares are ignited by striking the phosphor tip against the road and can last for 10-60 minutes, depending on the exact model. Fusees are common in emergency kits and are the de facto deployed signals. The intense heat generated can cause severe burns and leave behind residue and metal when complete. Interviews with Massachusetts State Police [MSP] indicate their reluctance to use pyrotechnic flares due to their long set-up time and physical danger involved in deployment on the roadway.
1.2.2
Chemical Flare
Figure 1-2: SnapLightTMFlare; source: disclose.tv
The SnapLightTMflare uses chemiluminescence to generate light. Like the
py-rotechnic flare it is a one-time signalling device. It has the advantage of generating a low amount of heat, making it safe to handle and use. The Snaplight still requires considerable transport space, and requires time to deploy and clean-up.
1.2.3
LED/Strobe Flare
An LED Flare (Figure 1-3) uses a high-intensity LED to emit light. The electronic flare is reuasable, rechargable, lightweight and can modulate different patterns. How-ever, they are more expensive than single-use flares, and require time to set up and retrieve.
1.2.4
Evaluation of Current Solutions
The main method of traffic diversion for a police vehicle is the roof-mounted light bar component of the VMEL. The light bar, although highly visible to normal drivers, also impairs night-vision and spatial resolution. The light bar is effective in signalling the presence of a police cruiser, but does not effectively indicate the position of the vehicle with respect to traffic lanes.
Figure 1-3: PowerFlareTM; source: powerflare.com
In addition to the strobing effects of the light bar, officers often place traffic cones and flares if a stronger visual cue is required. However, traffic cones are bulky and take up vital carrying capacity in the police vehicle. Pyrotechnic flares are dangerous to operate, requiring constant attention lest the officer injure themselves or others. Pyrotechnic flares have a relatively short duration, and clean up of debris is time-consuming and difficult. The varying conditions of a traffic stop will absorb significant time and manpower if the officer chooses physical traffic diverting means. The average traffic stop takes less than 20 minutes, of which the officer pays most of their attention to the target driver. [MSP interview, March 2012]
A diverting system that can be quickly established while the officer maintains
control of the traffic stop would be optimal.
1.3
Proposed Solution
The overall objective of the project is to reduce the occurence of roadside casualties caused by collisons between a moving and a stationary vehicle; primarily when the
police vehicle is the stationary one.
The project is a subset of a research effort for the National Institute of Justice
(NIJ). The goal is to create a vehicle-mounted module that will divert oncoming
traffic efficiently, reducing the rate of collisions; and alert police officers of imminent threats, so they can take appropriate measures to prevent becoming casualties.
The proposed solution detailed in this thesis is the preliminary design and con-struction of a vehicle-mounted laser projector to divert oncoming traffic away from a stationary police vehicle. The following goals serve as a guide and target to facilitate acceptance within the law-enforcement community.
" The device should be compatible with existing cruiser hardware and officer
training.
" The device creates images on the road pavement that are visually similar to
current roadside flares.
The visual familiarity helps in communicating the intent to oncoming vehi-cles, reducing time and cost in educating the public in proper driving procedure.
" The device should have optical presence beyond 30m
[100ft],
which is an averagedistance for roadside flares to be deployed from the cruiser.
" During normal operation, the device should be eye-safe for both oncoming traffic
and police officers using the device.
" The device should work in darkness, when the incidence of road-side collision
is highest.
1.4
Outline
Chapter 2 describes the background information for the technology used in the device, as well as design contraints and safety concerns. Chapter 3 describes a specific imple-mentation that meets the goals proposed. Chapter 4 describes the tests and results
Chapter 2
Technical Background
2.1
Optics
2.1.1
Divergence
Any light that exits an aperture of finite size will have some divergence associated with it (see Figure 2-1). The divergence is defined as the angular spread of the light source. The choice to use lasers as the light source is due to the laser's extremely low divergence factor, which will be a factor in the upcoming subsection. The narrowest
portion of the laser beam, Wo, is the 'beam-waist'.
b
2W W
diffuset
specular
reflection
Figure 2-2: Specular and Lambertian Diffuse reflection; source: Wikipedia
2.1.2
Reflectivity of Pavement
The laser projection system discussed in this thesis is intended for projecting onto road-grade asphalt. The asphalt is made of small gravel less than 0.25 inches wide bound by bituminous tar. Asphalt has a total reflectivity of 0.05 to 0.1, while con-crete's reflectivity is 0.5 to 0.2. The age, dirt, and composition of the road surface significantly affects the road reflectance. The reflectivity at low incident angles is less than 10% at normal (perpendicular) incidence. The rough texture of the asphalt results in a mostly diffuse reflection of the primary beam, with decreased reflectance at low angles due to the self-shadowing effect and multiple scattering surfaces [Adrian and Jobanputra, 2005]. Figure 2-2 illustrates the difference between the specular re-flection and the diffuse rere-flection. A powerful laser is needed to overcome the luminous absorption properties of asphalt.
The reflectance of the asphalt may also change depending on local thermal prop-erties and time elapsed. At low incidence angles, the reflectance of the asphalt may change as much as ±3% [Jiang et al., 2012].
The divergence of the specular reflection is higher than the incident beam due to the irregularites in the road surface. This reduces the irradiance, making it safer to observe the reflections at closer distances. However, debris on the road can be
Source
Specular Reflection Observer
H '"-. -0,0'HH
Primary Beam
-.-.-D D'
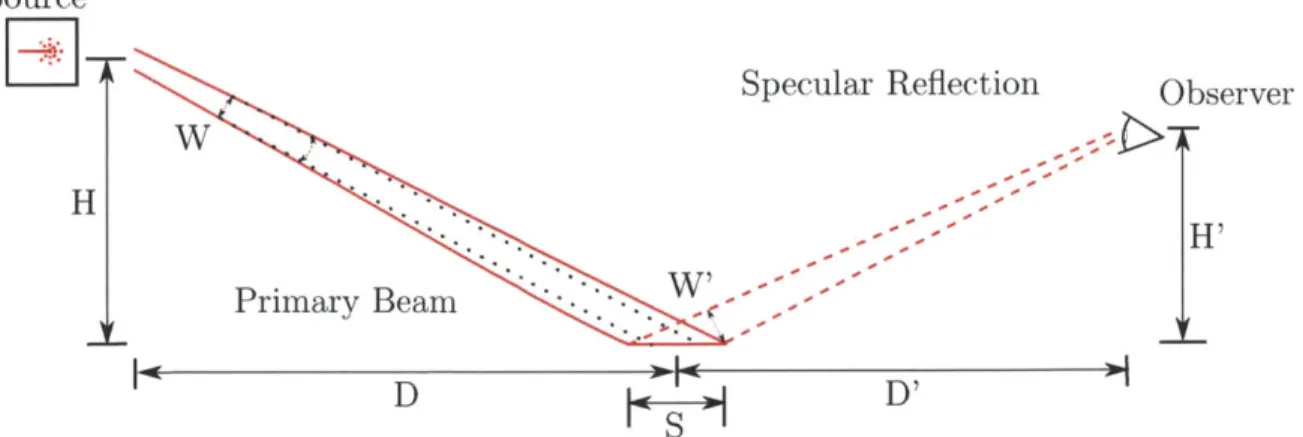
Figure 2-3: Foreshortening and Reverse Foreshortening Effects
hazardous, as glass, chrome and steel have high specular reflectivity. At low angles of incidence, glass approaches 100% reflectivity while only increasing beam divergence
by lmrad [Marshall, 1995]. The reflection caused by the debris results in a higher radiant intensity, potentially injuring nearby observers. The reflected beam may also violate FAA radiation limits (FAA Advisory Circular 70-1).
2.1.3
Foreshortening Effect
(See Figure 2-3) For a large projection distance D, cruiser height H, and divergence
angle
E,
The foreshortening effect can be approximated as S ~ wl9kD. This meansthat as the distance increases from the projector to the projection point, the laser creates an increasingly large spot size onto the pavement. The foreshortening effect is dominated by the divergence of the beam rather than the beam diameter. A larger spot size results in lower optical power per unit area, resulting in a dimmer projected flare. The higher the projector is mounted on the vehicle, the further the projector can illuminate the road surface while still maintaining luminous intensity.
2.1.4
Reverse Foreshortening Effect
Since the target observer is part of the oncoming traffic, this puts constraints on the distance and viewing angle of the reflected beam. This projection onto the observer counteracts the forshortening effect as such:
W+)-.D H'
H e DI
D 2
Therefore, an observer at a distance from the projected point would see a small spot again. The result is a lower laser power necessary for visual recognition, but also lowers the maximum safe laser power if the specular reflection of the pavement is high.
2.2
Lasers
Lasers have been used to display images for the last 40 years. Lasers use a resonant cavity in a heterojunction semiconductor diode to emit coherent light in the visible re-gion [400-700nm]. The number of emitted photons is linearly dependent on the diode current above a certain threshold [Ganguly, 2007]. The laser then is exponentially dependent on the voltage applied to it, making current control a preferred option for power modulation.
2.2.1
Hazards
Lasers are intense sources of coherent light. If carelessly implemented, can cause permanent harm to the user and/or oncoming traffic.
The human eye (see Figure 2-4) uses the cornea and lens to focus incoming light onto the retina in the back of the eye. The retina is composed of light-detecting cells, blood vessels, and supporting vascular tissue. The lens can focus a collimated light beam 10,000X its incoming diameter, thus a laser beam 1mm wide is focused onto a point on the retina 10ptm wide [Barat, 2006]. In this project, the lasers used emit light in the visible spectrum [400-700nm], so the retina is the easist body part to be injured (ANSI Z136.1).
Posterior chamber Anterior Chamber Vitreous Scle Cornea Ma Lens
his Optic disk
Retina
Ciary Choroid body
Figure 2-4: Cross section of an eye
lerve
Class Power Range Protection Notes
1 < 0.1mW None Safe for all conditions of normal use, even when un-der magnification
1M < 0.1mW No Magnifica- Safe for normal use, large
tion diameter beams, do not
view under magnification 2 < 1mW Blink Reflex Safe under normal blink
re-flex
2M < 1mW Blink Reflex and Safe under normal blink
re-no Optics flex, do not view under
mag-nification
3R < 5mW Limiting View- Safe as long as eye does not
ing angles enter direct beam path
3B 5mW-500mW Optical Filter Diffuse Reflections from
matte surfaces are
con-sidered safe. Interlock
required
4 +500mW Optical Filter Skin damage can result
and Protective from direct contact of beam.
clothing Eye damage can result from
diffuse reflections.
2.2.2
Safety Standards
Lasers in class 3B operation are required to have a key switch and interlock. The interlock will power down the laser beam if the device is 'open'. The keyswitch is to prevent accidental activation of the laser source (ANSI Z136.1). Due to constant modifications to the laser beam optics and alignment, the laser beam was driven at class 3R power during scanning modes when not on protected laser ranges.
ANSI
American National Standards Institute (ANSI) is a 3rd-party research institution, and is influential in determining safe expsoure levels for viewing lasers and acceptable operating procedures. Many of the following government agencies refer to the ANSI guidelines for issuing legal compliance. The ANSI Z136.1 and ANSI Z136.6 guidelines are of particular importance to this project. ANSI Z136.1 defines the Maximum Per-mitted Exposure (MPE), Nominal Ocular Hazard Zone (NOHZ), and diffuse hazard zones.
ANSI Z136.6 defines the operation guidelines for using a laser outdoors. It also
details the maximum light permitted for critical visual tasks, such as driving. The institute recommends establishing a buffer around the laser projection zone, as seen in Figure C-7.
FDA
All commerical laser devices used in the US must be vetted by the Food and Drug
Administration (FDA) by way of Center for Devices and Radiological Health (CDRH), specifically under the Federal Laser Product Performance Standard (FLPPS) covered under 21 CFR 1040.10. The operator must get approval from the FDA before using a Class 3b or 4 laser outdoors (Figure C-9).
FAA
For outdoor lasers that intersect with US airspace and exceed Class 3R power rating, the Federal Aviation Administration (FAA) must be notified of its operation. An application must be filed with the FAA before the laser can be actived (Figures
C-11 and C-12). The operator must detail the laser's location, heading, intensity, and
safety precautions during its planned operation. The FAA may respond requesting procedure changes or additional safeguards be installed. For the outdoor laser oper-ation to continue, the operator must obtain a letter of no-objection from the FAA
(Figure C-13).
OSHA
The Occupational Safety and Health Administration (OSHA) requires the laser op-erator must have sufficient training and control of the laser while it is operational.
OSHA also mandates sufficient safety margins, warning signs, and restricted access
to the primary beam while the laser is in operation [Occupational Safety and Health
Administration, 1993].
IEC
The International Electrotechnical Commision (IEC) is a global 3rd-party organiza-tion that prepares internaorganiza-tional standards for all electronic technologies. The relavent laser safety and operation standards are located in IEC 60825-1. IEC laser safety is based on AEL derived from the ANSI, as it incorporates how the laser is viewed.
Massachusetts State Law
Massachusetts state law 105 CMR 121 prevents the general use of class 3B and 4 lasers outdoors near an audience without sufficient margins of error. The law also requires that the laser operator can only be exposed to at most Class 2 radiation. Following ANSI Z136.1 guidelines is required for compliance with this law. A copy of the FDA approval for outdoor laser use must also be filed with the Massachusetts
Radiation Control program [Massachusetts Department of Public Health, 1997].
Safety Analysis
The lasers used in the project are rated as class 3B. The guidelines detailed above make outdoor high-intensity laser tests difficult to complete. A class 3B laser cannot be used outdoors without sufficient notification of relevent authorities (FAA & Mas-sachusetts). The officer's conduct (Appendix D) during a traffic stop violates safety margins detailed in ANSI Z136.6. There is insufficient warning and zone restriction for oncoming traffic concerning the NOHZ. Therefore, all testing with the scanning laser will be done in limited access areas or with a class 3R laser.
The laser beam is intended to reflect off of the road surface, and intended targets observe the diffuse, or scattered reflection from the pavement. The specular magni-tude, or collimated reflection, of the laser beam is small, due to the rough texture, low reflectance, and self-shadowing effect of the asphalt. For compliance with estabil-ished safety calculations, we assume that the laser source and observer are stationary. Since the intensity of the laser is very high, and the divergence is low, the blink re-flex is insufficient in protecting a person from harm. Direct exposure of the primary beam to the eye will cause thermal damage to the retina, resulting in injury and/or permanent vision loss. Sufficient distance margins and appropriate safety equipment will be required for high-power laser tests.
2.3
Galvanometers
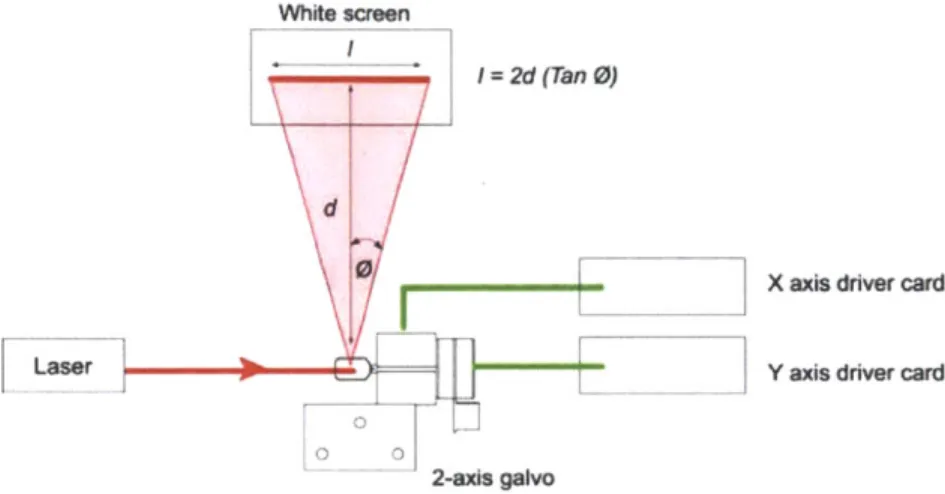
The laser beam is projected onto the desired points on the pavement with precision galvanometers with mounted mirrors. A galvanometer is an electro-mechanical device that given an input electrical signal, turns a mirror at a specific angular position. The galvanometer system used consists of an mirror that deflects the incoming laser beam in the X axis, and another mirror that deflects the laser beam in the Y axis (Figure
2-5). Since the mirrors are orthogonally mounted and close together, we simplify the
White screen
I= 2d (Tan 0)
Laser
0 0
2-axis galvo
X axis driver card
Y axis driver card
Figure 2-5: Layout of 2-axis Galvanometer; Source: Thorlabs
Y-Axis Mirror
X-Axis Mirror
Chapter 3
Design and Components
3.1
Structure
The projector is composed of the physical hardware, and a driver program that op-erates on the local computer.
The Local Computer has a Publisher routine that exports data structures detailing where, when and how intense the laser should be.
The Listener routine receives the message data and parses it into appropriate byte-sized packets. The packets travel over the USB line to an FTD1232 converter, which converts the data into a serial signal.
The Controller communicates with the FTD1232, processes input data, and stores the current state. The outputs of the Controller are the X and Y deflection data that are processed by the Digital-to-Analog Converter (DAC) and the Single-to-Differential converters. The X' and Y' output voltages that are fed into the Galvanometer result in an angular deflection of its X axis and Y axis mirrors respectively.
The Pulse-Width Modulator (PWM) generator sets the intensity of the laser beam from the Laser Source.
The laser beam goes through a Beam Expander, making it larger and reducing its divergence, and is then deflected by the galvanometer and intersects the pavement.
Local Computer
Publisher Listener
Logger
2
ScanningLaserX
Single-to-Differential X
FTD1232
DAC Y Single-to- Galvanometer
Differential T Laser Beam Controller ___-___ PWM Generator Beam Expander Ultrasonic PWM Detectorasera m
Acceleration Laser Source
Detector
Laser Reflection Safety Relays Power
Detector
I
Projector
Figure 3-1: Top Level Component Layout
The Safety Relays are a power interruptor for the Laser Source, if the Ultrasonic detector, Acceleration Detector, or the Laser Reflection Detector peceive an emer-gency situation.
3.2
LCM
The Lightweight Communications and Marshalling (LCM) protocol is used to send and handle messages over the network between different processes. A publisher pro-cess generates the desired locations for the projected laser, and the listener propro-cess converts the LCM packets into appropriate commands for the FTDI chip.
The LCM also integrates well with a GUI that allows the user to place flare points corresponding to locations that a rear-view camera is displaying.
The Listener program was written in Python and executed in Ubuntu Linux. First it locates the port with the FTDI attached. It then sends a test command to make sure the Controller is active and functional, then defaults into a 'standby' state. The packages the Listener recieves is an array, with each point corresponding to a flare angular position, laser intensity, and time duration. The Listener then sends the commands to the Controller to recieve position, intensity and duration data as sequences of bytes.
3.3
Data Protocol
Commands are sent over the serial port in byte packages. The serial port is a virtual port over a USB connection; and is set at 9600 BAUD, 1 stop-bit, 0 parity bits, most significant bit first (Figure 3-2).
To load in N number of coordinates in an internal array, the computer would send a command to load data, then the target array, then the data array, split into upper and lower bytes (Figure 3-3).
The controller would return a sequence of acknowledgement bytes to the computer, keeping everything in sync (Figure 3-4).
7 6 5 4 3 2 1 0 Verify
Command
DATA
DATA
Figure 3-2: Example of a command to the Controller
7 6 5 4 3 2 1 0 Verify Load Data Array Word 0 Word 1 Word N
7 6 5 4 3 2 1 0 Verify Command Address 'U, 'L' 'U, 'U, 'L' End
Figure 3-4: Acknowledgement sequence returned to the Computer
The validation byte is always the first byte in the message. It guards the controller against random serial noise and buffer overflows. The controller currently uses a message-based handshaking protocol. For every byte that is sent from the computer to the controller, the controller board must reply with a byte message before the computer can send another byte. This allows the computer to check the alignment of input data, as well as remove the potential for buffer overflows.
If the reset command is sent, the controller sends an acknowledgement message,
and then activates the internal watchdog timer to reset the internal laser variables.
3.3.1
FTD1232
The Massachusetts State Police and the Cambridge Police Department use Windows XP as the operating system on their local computers, so compatibility and driver foot-print were a concern. Communication between the controller board and the computer is handled over a USB port in low-speed mode.
The communucations co-processor is an FTDI232RL chip set to emulate a virtual serial port. The chip can be interfaced with a small [1.3MB] driver provided from
the manufacturer. The communication board is powered by the host computer. The schematic is located in Appendix A, Figure A-8. The CTS pin is set low, so that messages from the computer are not held in a buffer and are immediately delivered to the controller.
3.4
Controller
Figure 3-5: Controller Board
The controller board takes in serial input for driving the galvanometer position and laser power. It is the heart of controlling where, when, and how powerful the laser projection is. The microcontroller handles the state of the laser system, galvanometer positions, timing and intensity.
The controller board is an ATMEGA324P microcontroller. The AVR-8 chipset was chosen due to its extensive support, low development costs, and flexibility. The microcontroller code was written in C using AtmelStudio 6, and uploaded via the SPI port using the AVRISP mk.II programming peripheral. Firmwarre code was compiled in debug mode with AVR-GCC with target chip as ATMEGA324PA. JTAG interface and debugging was not used due to the need for Port C for controlling peripheral chips.
The ATMEGA324P communicates to peripheral chips using the SPI interface on Port B and enable lines on Ports A and C.
The microcontroller is clocked at 20MHz, which is generated by an external crystal for stability.
3.4.1
State and Memory
The internal state of the microcontroller is stored in RAM. In the event of a power-interrupt or reset, the system would reset to a safe bootloaded state.
The default state is STANDBY, in which the galvanometers are idle and the laser is disabled. Different states include projecting a single point (SINGLESHOT) and projecting multiple points (SEQPOINTS). Appropriate commands from the serial port set the running state of the controller. Code for SEQPOINTS execution can be found in Section F.4 on page 106.
Galvanometer position, laser intensity and duration data is stored in EEPROM due to its longevity and durability. The EEPROM is rated at 100,000 writes; at 30 rewrites/day, it would take on average of 9 years before the EEPROM would suffer from write failures. The longevity is far superior than higher-density FLASH [10,000 writes before failure], and can store data in the event of a power failure [unlike SRAM]. The EEPROM in the present microcontroller can store up to 1024 bytes or 512 words of data. Current utilization of EEPROM is 90%.
3.4.2
Digital to Analog Converter (DAC)
Due the high precision required for the galvanometer voltage input there must be a high-precision voltage source. The DAC8554 was chosen as the DAC due to its low integrated noise level, high precision (16-bits), and multiple independent buffered outputs. The DAC has an output voltage range of OV-5V. The DAC supports power down mode and simultaneous updates using internal registers. The chip communi-cates to the controller over the SPI port.
3.4.3
Single-to-Differential converter
The DAC has insufficient voltage range [OV-5V] to drive the input of the galvanometer
[±1OV]. The project uses two single-ended to differential converters to expand the
voltage output ranges of the X and Y signals so that the full range of the galvanometer
can be utilized. The output voltage V0,t = -4V + 2 x 5V. An LM336-5V shunt
diode is used as a precision 5V reference source. High precision
[.1%]
resistors areused to improve linearity. LT1679 Operational Amplifiers were used for their high gain-bandwidth product [100MHz], and low noise pickup from the power lines.
3.5
Galvanometer
Figure 3-6: Galvanometer System
The galvanometer selected for the project is a Thorlabs GSV012. The galvanome-ter uses voltage-controlled mirrors that can deflect the laser beam in the X and Y axes independently. The mirrors are able to reflect an input beam of up to 10mm in diameter.
The galvanometers are supplied with motor drivers that map a voltage input to an angular deflection. The controllers are PID compensated at a 300Hz bandwidth for large signals, and at 1KHz for small signals. The galvanometer is also very reliable, repeating the same voltage in will result in a drift less than 15prad. For maximum
results in a 20 angular deflection.
The galvanometer drivers have numerous test points including angular deflection, angular speed, angular error, drive current and stall detection.
3.5.1
PWM Generator
A PCA9685 chip is used as the PWM driver interface between the controller and the
laser source. The chip can drive 16 independent PWM channels at 12-bit accuracy. In the current configuration, an Arduino Uno is used to initialize and communicate with the chip using a third-party library. The output PWM is then controlled by a designated laser operator.
Figure 3-7: Driver for PWM Laser
The PWM generator is also connected to the Laser Source logic supply by a diode
(1N418). This ensures that whenever the laser source is enabled, the PWM Generator
is also active as well. The output power of the laser is thereby controlled.
3.6
Laser Source
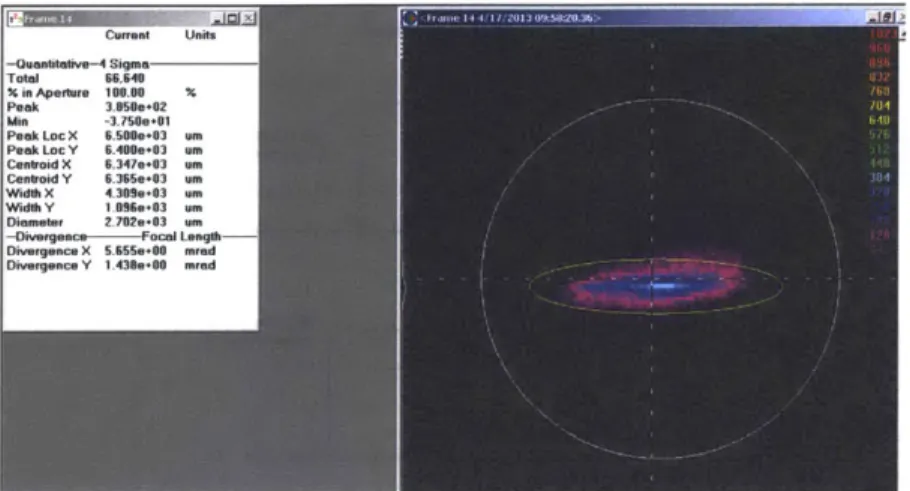
The Pulse-Width Modulated (PWM) laser (Figure 3-9) uses a injection layer diode (ILD) with a coupled linear power supply. This off-the-shelf device comes with an
AC-DC power converter with integrated cooling heatsinks and fans. The device was ... ... ...... .... -...
Pulse Width Modulated Signal V Lower "cyde Lower iwrarp DC o t I mea period V HV- dt cyde fhlIer wmet af DC 0 l ifm period _
Figure 3-8: Pulse Width Modulation and Average Power; source: embedded-labs.com measured to have a low beam divergence, simple start-up operation, and low unit cost.
However, the device is difficult to align the laser output with the main optical path, has no easily available test points for measurment, lacks appropriate interlocks, and has a low modulating frequency.
Figure 3-9: PWM Laser
The laser supply takes in a TTL PWM signal up to 2KHz as the control for the
power source (Figure 3-7). The laser rapidly turns on and off at 1W intensity to
create an average power profile (Figure 3-8). It takes the diode laser 16.8pseconds for the laser to reach full intensity.
The PWM frequency can be increased to 60KHz-100KHz to induce the laser to
enter an analog regime. The output power is then continuous and exponentially
Figure 3-10: Optical Properties of PWM Laser
dependent on the PWM duty cycle, see Graph A-3.
3.7
Optical Assembly
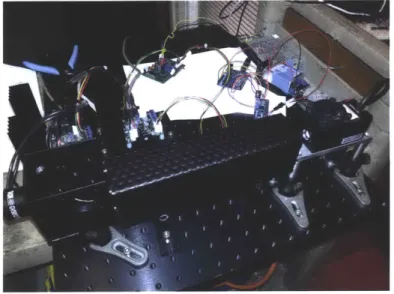
The current optical assembly is to correct for the foreshortening effect by expanding the laser beam in the Y-Axis. The optical assembly is constructed on an 1/4"-20 optical breadboard, mounted on 1/2" optical posts. The lenses and galvanometer are aligned using a 30mm cage-rail system, which allows lateral adjustment for focusing the laser beam.
Figure 3-11: Cylindrical Lenses in Galilean Beam Expander
The foreshortening effect causes the vertical component of the laser to spread out
along the Y axis. With appropriate focusing, the beam waist is now focused up to 50m. Since the divergence is the critical component of the foreshortening effect, reducing it by a factor of 10 reduces the effective spot size by 10 as well.
Figure 3-12: Complete Setup
The galvanometer and lens assembly are aligned and held in place using the 30mm cage system. A folded sheet of anodized aluminum is used to optically block stray laser beam refactions from leaving the optical path.
3.8
Safety Circuit
The proposed safety circuit is to enforce safe operation of the laser, and to disable the laser power if unsafe conditions occur. The user should be able the reset the safeties iff the failure conditions are cleared. The safety circuit is intended to interrupt power to the laser diode itself, which is quicker than using a mechanical shutter.
3.8.1
Acceleration Detector
In the current iteration, an accelerometer can used to detect sudden shifts in move-ment of the vehicle. Such instances include when the vehicle is struck, or when the police cruiser is accelerating into motion. Since this causes the laser beam to move
toward an unknown location, the laser beam should be turned off instead of risking the beam entering restricted areas. The accelerometer chosen is a 3-axis, analog out-put, with ±3g range. An arduino microcontroller detects when acceleration along
an axis exceeds i11g, and triggers an output pin to alert the emergency condition
(Figure A-9).
3.8.2
Ultrasonic Detectors
SPower
Laser Scan Area
VO Proximity
Deoectors
Ultrasonic
Emissions EchiesC
Figure 3-13: Ultrasonic Detector Layout
The goal of the ultrasonic detectors is to detect whenever the police officer and/or oncoming vehicles enter the laser scan area.
The RangeMax ultrasonic detectors return an analog voltage corresponding to the distance to the nearest solid object inside the field of view. The emergency condition occurs if the distance measured is below an acceptable minimum. The ultrasonic detectors use a narrow beam path, and can detect human-sized objects up to 15 meters away. The ultrasonic detectors currently suffer from a slow refresh rate [10 Hz], and must be triggered individually, lest they interfere with each other. The ultrasonic detectors have an overall refresh rate of 5Hz, and are susceptible to interference. An Arduino microcontroller is used to enable and measure the distances to obstructions, and triggers an output pin to alert the emergency condition (Figure A-12).
Power- Prmary Lasr Beam
Laser t SOLaser Dtector
Diffusc Reflections
Figure 3-14: Light Magnitude Detector Layout
3.8.3
Laser Reflection Detector
The Laser Reflection Detector returns an emergency signal if the laser beam is re-flected back into the projector. The worst case is the laser beam is rere-flected back due to a person or vehicle entering the primary beam path. The detector is com-posed of a sensitive photodiode [PDB-C154M] protected with a narrow bandwidth
light filter [A = 650nm]. The photodiode current is converted into a voltage output
with a AD818 Amplifier in a transconductance configuration. An MAX232 chip is used as a charge-pump voltage source to generate the +12V and -12V used in the magnitude detector (Figure A-11). The -12V source is used to bias the photodiode to reduce its small-signal capacitance, thereby increasing signal speed. The output of the Light detector is a voltage signal that is linearlly dependent on the intensity
of the incoming light with A = 650nm (Equation A.1). The circuit has a small signal
bandwidth of 10KHz.
The output of the light magnitude detector can be connected to a comparator or microcontroller with an ADC to trigger the failure condition when the reflected light intensity is above acceptable levels.
3.8.4
Key Switch
For Class 3B and 4 lasers, an key switch is required to prevent the laser from activating unless the switch is activated (ANSI Z136.1-2000). The switches used in this project are normal-open key-switches and are soldered into the mains power of the laser source.
Figure 3-15: Key switch
3.8.5
Relay Driver
The relay driver converts the logical state of the emergency conditions and the user reset path and activates the relay coils when appropriate. The Relay Driver can handle up to 4 different emergency conditions. For each detector, the emergency output is high when there is nothing wrong, and goes low when the corresponding emergency trigger is activated. i.e. The Ultrasonic emitter goes output goes low when there is an obstruction close by, or the Laser Reflection Detector output goes low when there is a high reflection of laser light.
Each logic cell uses a S/R latch to latch whenever the emergency trigger is acti-vated. Combinational logic prevents the reset signal from clearing the latch until the emergency trigger is resolved. The latch output is buffered by an L298 current buffer that powers the corresponding relay coil. Each logic cell is independent from each other. The last input is the start input, which only activates the relay controlling the laser power if power is applied to it. All relay switches must be closed in order for the laser module to receive power.
Currently, the Relay Driver is not integrated with the projector due to difficulty in determining efficacy in the detector circuits.
The relays chosen are SCHRACK, 24V, 6A, DPDT safety relays. They are DIN-rail mountable, a standard in safety circuit integration.
3.9
Safety Observations
As high power lasers are involved, it is required to have appropriate safeguards in place to prevent accidents and injuries. In order to reach compliance with ANSI,
FDA, FAA and OSHA requirements, all laser operators have received laser
opera-tion training with the MIT Environmental Health and Safety Office (EHS). Output power of all lasers used was set at or below Class 3B requirements. Appropriate eye protection (OD4) was used by all nearby personnel when the laser was in Class 3B operation. Laser power was measured with a Thorlabs PM100D integrating optical power detector. The location and relative intensity of the laser was determined using
CCD digital cameras. Alignment of laser optics was conducted while laser power was
at Class 2 or Class 3R.
When testing indoors, and scanning different positions, the laser power was kept at Class 3R. A laser safety room was designated on campus, and room warning symbols, door interlock, and outlet controller were installed. The lasers was kept inside the laser safety room for Class 3B intensity testing. During Class 3B operation, the galvanometer scanning feature was disabled and a matte aluminum backplate was deployed as a backstop.
Outdoor projection tests with the laser at class 3B were conducted at the BAE laser range in Merrimack, NH. The outdoor scanning test was supervised by Dan Creeden, the range laser safety officer. A covered 2.5m high fence was used as a backstop. The test pavement was clear of debris.
3.9.1
Hazard Zones
We used the ANSI Z136.1-2000 and Z136.6-2000 for determining the range of safe operating distances and hazard zones for the laser (Appendix E).
The Nominal Ocular Hazard Zone (NOHZ) is the distance in which the radiance can cause damage to the eye. Using Equations E.3.4, E.3.4, and E.6, and character-istics of the laser (Figure 3-10) we can the MPE. Select intensities and the ranges are given below (Table 3.1).
Sensitive and critical visual interference zones are calculated in the same manner as the NOHZ, but using the interference thresholds divided by the optical efficiency given the wavelength. Since the eye is not as sensitive to 655nm light we find that the sensitive visual interference range is comparable to the NOHZ range.
The critical interference distance is the minimum distance that traffic should be from the projector laser source if they interset the primary beam. This is quite telling, as oncoming traffic is only safe when intersecting a 5mW beam up at 35m or further. Running the laser at a more intense 100mW means that the safes distance a vehicle can intersect the beam is over 300m away!
The laser free range of the beam is the distance at which the laser does not interfere with vision at all. It is also the distance the projector must be from the Airport's laser-free are if the projected beam enters airspace.
Interestingly, increasing the laser power to a higher intensity [x20] and pulsed signal dramatically increased the interference distances by 940%, rather than the 450% [v2-0] as expected from the NOHZ equation. This is due to the multiple pulse response of the eye reducing the MPE in the PWM case.
Laser Source
100mW, 1.6KHz 1WCniu s
Region of Visual Inter- 5mW Continuous PWM 10%Dut 1W Continuous
ference NOHZ 5.4 m 53m 79m Sensitive Interference 8 m 73 m 108 m Critical Interference 35 m 324 m 484 m Laser-Free Interfer- 342 m 3.24 Km 4.84 Km ence
Table 3.1: Hazard Distances for the PWM primary laser beam
The reflections of the laser beam off of asphalt do not pose a threat to the operator or motorists outside of 1 m from the road surface. The visual interference distances of the diffuse reflection are much smaller than the NOHZ of the primary beam thus the main threat is the primary laser beam path. The diffuse reflections are also at laser-free intensities at short distances (Table 3.2).
Table 3.2: Hazard Distances for the PWM diffuse reflection Laser Source
100mW, 1.6KHz1WCnius
Region of Visual Inter- 5mW Continuous PWM 10%Dut 1W Continuous
ference NOHZ 2.5 mm 2.5 cm 3.5 cm Sensitive Interference 1.5 cm 12 cm 18 cm Critical Interference 6 cm 53 cm 80 cm Laser-Free Interfer- 56 cm 5.34 m 8 m ence
Chapter 4
Tests and Results
4.1
Optics
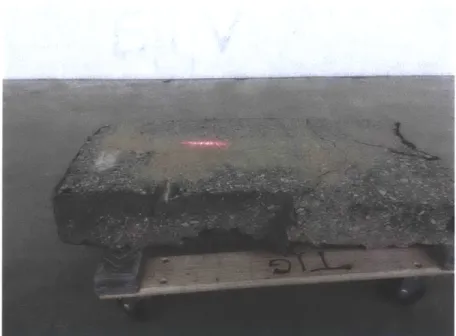
The reverse foreshortening effect causes the projected laser spot to appear small to oncoming traffic, increasing its visual intensity once again. Careful alignment of the cylindrial lenses can set the focal point between im to 30m away. Additional tests with the PWM laser show that the reverse foreshortening effect creating a small optical point (Figure 4-4). Even when running at 5mW, the laser is visible under indoor-lighting conditions.
From the projector's perspective, the diffuse reflection is dim. Therefore cali-bration of the laser scanner is more difficult if the road surface exhibits specular reflection. The laser scanner also demonstrates reduced visibility when under bright light sources.
4.2
Electronics
4.2.1 Power Consumption
The system is currently powered by a standard 110VAC outlet. Data was collected using an inline power meter. As Table 4.1 shows, the system uses less than 350W of power at peak usage, and can thus be powered by attaching the system to the
Figure 4-1: Laser Projection, with Observer 30m away
cruiser's 12V alternator power supply.
4.3
Laser Projection
4.3.1
Calibration
Since the laser system does not collect visual data, calibration of the projector is necessary to derive the transform between desired projection points, and actual points driven. The Alert aspect of the NIJ project provides the user with rear-mounted cameras. The cameras provide a convenient and consistent medium for indicating
Figure 4-2: Foreshortened PWM Laser spot on Asphalt Sample
Device Idle Power Average Power Peak Power
Galvanometer 100W 180W 250W
Laser 4W loW 50W
Controller 1W 2W 3W
Safety Board 1W 2W 2W
Total 106W 193W 305W
Table 4.1: Power Consumption of Device Elements
where the laser projection points should be.
The calibration scheme used in this project requires that the camera and gal-vanometer output be located close together, and pointing in parallel. The user has an input screen for pointing out 4 calibration points (Figure 4-5). The listener con-verts the coordinates into binary data and instructs the controller to project a pattern (Figure 4-6). The user then marks out where the projection points actually are, and then the computer calculates the transform between camera data and galvanometer data (Figure 4-7). Finally the user can mark the pattern they desire onto the pave-ment (Figure 4-8), and the projector displays it as soon as they are done (Figure 4-9).
For commercial usage, the calibration needs only happen once when the device is built, as the distance/angle/placement between the camera and galvanomter will be