HAL Id: hal-01316105
https://hal.inria.fr/hal-01316105
Submitted on 24 May 2016
HAL is a multi-disciplinary open access
archive for the deposit and dissemination of
sci-entific research documents, whether they are
pub-lished or not. The documents may come from
teaching and research institutions in France or
abroad, or from public or private research centers.
L’archive ouverte pluridisciplinaire HAL, est
destinée au dépôt et à la diffusion de documents
scientifiques de niveau recherche, publiés ou non,
émanant des établissements d’enseignement et de
recherche français ou étrangers, des laboratoires
publics ou privés.
Rank order coding: a retinal information decoding
strategy revealed by large-scale multielectrode array
retinal recordings
Geoffrey Portelli, John M. Barrett, Gerrit Hilgen, Timothée Masquelier,
Alessandro Maccione, Stefano Di Marco, Luca Berdondini, Pierre Kornprobst,
Evelyne Sernagor
To cite this version:
Geoffrey Portelli, John M. Barrett, Gerrit Hilgen, Timothée Masquelier, Alessandro Maccione, et al..
Rank order coding: a retinal information decoding strategy revealed by large-scale multielectrode
array retinal recordings. eNeuro, Society for Neuroscience, 2016, �10.1523/ENEURO.0134-15.2016�.
�hal-01316105�
Rank order coding : a retinal information decoding strategy revealed by
large-scale multielectrode array retinal recordings
Geoffrey Portelli1,8,∗, John M. Barrett2,8, Gerrit Hilgen2, Timothée Masquelier3,4,5,6, Alessandro Maccione7, Stefano Di Marco7, Luca Berdondini7, Pierre Kornprobst1,9, Evelyne Sernagor2,9
1Biovision team, Inria Sophia Antipolis Méditerranée, France.
2Institute of Neuroscience, Faculty of Medical Sciences, Newcastle University, Newcastle-upon-Tyne, UK. 3INSERM, U968, Paris, F-75012, France.
4Sorbonne Universités, UPMC Univ Paris 06, UMR S 968, Institut de la Vision, Paris, F-75012, France. 5CNRS, UMR 7210, Paris, F-75012, France.
6Present address: CERCO UMR 5549, CNRS – Université de Toulouse, F-31300, France.
7NetS3 Laboratory, Neuroscience and Brain Technologies Dpt., Istituto Italiano di Tecnologia, Genova, Italy. 8Co-first-author
9Co-senior-author
* Corresponding author : [email protected]
Significance statement
How the retina encodes the visual environment remains an open question. Using a new generation of large-scale high density multielectrode array, we show that in large populations of mammalian retinal ganglion cells (RGCs), a significant amount of information is encoded synergistically in the concerted spiking of the RGC population. Thus, the RGC population response described with relative activities, or ranks, provides more relevant information than classical neural codes such as
independent spike count- or latency- based codes. In particular, and for the first time, we show that the wave of first stimulus-evoked spikes (WFS) across the whole population reliably encodes and rapidly transmits information about new visual scenes. This strategy of WFS could also apply to different sensory modalities.
Abstract
How a population of retinal ganglion cells (RGCs) encodes the visual scene remains an open question. Going beyond individual RGC coding strategies, results in salamander suggest that the relative latencies of an RGC pair encodes spatial information. Thus a population code based on this concerted spiking could be a powerful mechanism to transmit visual information rapidly and efficiently. Here, we tested this hypothesis in mouse by recording simultaneous light-evoked responses from hundreds of RGCs, at pan-retinal level, using a new generation of large-scale, high density multielectrode array consisting of 4096 electrodes. Interestingly, we did not find any RGCs exhibiting a clear latency tuning to the stimuli, suggesting that in mouse, individual RGC pairs may not provide sufficient information. We show that a significant amount of information is encoded synergistically in the concerted spiking of large RGC populations. Thus, the RGC population
response described with relative activities, or ranks, provides more relevant information than classical independent spike count- or latency- based codes. In particular, we report for the first time that when considering the relative activities across the whole population, the wave of first stimulus-evoked spikes (WFS) is an accurate indicator of stimulus content. We show that this coding strategy co-exists with classical neural codes, and that it is more efficient and faster. Overall, these novel observations suggest that already at the level of the retina, concerted spiking provides a reliable and fast strategy to rapidly transmit new visual scenes.
Introduction
Understanding information processing in the nervous system by exploring the neural code is a major challenge (Rieke et al., 1997). In the visual system many questions remain open about how spike trains generated by retinal ganglion cells (RGCs) encode and convey information about the visual environment. Greschner et al. (2006) showed that information can be read-out from simple response features such as the spike count, from the latency of the first spike event, or from the latency between different spike events. But simple coding strategies such as spike count-based code are insufficient and more information-rich codes such as spike-timing that take into account the precise timing of occurrence of the spikes of individual RGCs are necessary to match behavioral performance (Jacobs et al., 2009).
Beyond the individual RGC coding strategies, the concerted spiking of a pair of RGCs, e.g. relative latencies of some RGC pairs, can encode spatial information in the salamander retina (Gollisch and Meister, 2008). In that paper, the authors suggested that “a population code based on differential spike latencies could be a powerful mechanism to rapidly transmit new visual scenes”. Otherwise stated, this amounts to considering the structure of the global concerted spiking pattern, i.e. the relative activities.
Among the algorithms available to read out concerted spiking patterns (Rieke et al., 1997), a classical one is the rank-order code (ROC) strategy, where the information is not coded in the precise timing of spikes for each input, but rather in the relative order in which the neurons fire (Gautrais and Thorpe, 1998; Thorpe et al., 2001). Thus, as it deals with relative neural activities, the ROC might be a combinatorial coding scheme. This coding strategy was established in the context of ultra-fast visual categorization by considering that the human visual system can analyze and classify a new complex scene in less than 0.200 sec (Thorpe et al., 1996; Kirchner and Thorpe, 2006; Crouzet et al., 2010). The ROC strategy has computational advantages such as robustness and fast processing compared to classical spike count- and latency-based independent coding strategies (Van Rullen et al., 2005). Therefore, by looking at the relative latencies pattern, the ROC scheme may represent a strategy to access synergistically encoded information, i.e. information available in the population response that is not available when considering RGC responses individually. These advantages of ROC were highlighted using simplified retina models (Van Rullen and Thorpe, 2001). However, to our knowledge, this has never been investigated experimentally.
In this study we investigated whether the relative activities of a large RGC population might be a mechanism for encoding visual information in the mammalian retina. To this aim, we recorded the simultaneous activity from hundreds of mouse RGCs in response to flashing gratings with varying phases as in Gollisch and Meister (2008) and also with varying spatial frequencies. The RGCs were simultaneously recorded with the Active Pixel Sensor CMOS Multi-Electrode Array consisting of 4096 electrodes (4096 APS CMOS MEA) spanning an active area of 2.67×2.67mm (Berdondini et al., 2009, Maccione et al., 2014). These experiments led us to the three main following observations.
First, contrary to what has been found in salamander (Gollisch and Meister, 2008), in the mouse retina we did not observe any tuning of the relative latencies to the onset of the stimuli of individual RGC pairs, regardless of whether these cells were of the ON, OFF or ON-OFF type . Inspection of the raster plots of all RGCs we recorded suggests that this lack of latency tuning may stem from strong spontaneous background activity, which is common in the mammalian retina. However, when considering the global relative activity pattern, we show that the wave of first stimulus-evoked spikes (WFS) is tuned to the grating phase.
Secondly, we found that a significant amount of information is encoded synergistically in the population response. Thus the RGC population response described with relative activities might provide efficient coding capabilities. Using a Bayesian framework, we compared the coding performance of WFS (read-out with a ROC) with a correlated spike count code (ROC with spike counts) and classical spike count- and latency-based codes in a discrimination task that consisted of identifying the correct phase from a set of RGC responses.
Finally, we show that relative activities are more efficient than classical independent codes by comparing the discrimination performance with increasing size of the RGC population, and faster by varying the length of the observation window after the stimulus onset.
Materials and Methods
In this paper we present results from two retinal datasets, D1 and D2, with simultaneous recordings performed with the 4096 APS CMOS MEA, involving 764 and 649 RGCs respectively (D1, 39 days old and D2, 52 days old C57Bl/6 mouse). We had initially performed similar experiments using a conventional 60-channels MEA and pooled the data from several retinas (Dataset D3, 9 retinas, 258 RGCs). All the mice were of either sex.
All experimental procedures were approved by the UK Home Office, Animals (Scientific procedures) Act 1986.
Stimulus design
The stimuli used in this study were modeled on those used by Gollisch and Meister (2008). In their study the authors used square-wave gratings of varying phase and with a 300μm bar width which is 2.5 times the average RGC receptive field (RF) size in salamander. Here, the stimuli were 32 square wave gratings with four spatial frequencies and eight phases.
Considering an average mouse RF of 200-300μm, the bar width used were 1600μm, 800μm, 400μm, and 200μm in order to be close to the 2.5-fold ratio. As 1° = 30μm onto the mouse retina (Remtulla and Hallett, 1985), the four spatial frequencies correspond to 0.009, 0.018, 0.037, and 0.075 cycle per degree (cpd). We will use the notation mcpd to represent cpd values in the 10−3range. For each spatial frequency, we define eight phases φ by applying to the gratings a shift of 1/4 × the bar width, i.e. in phase angle φ ∈ {0, 45, 90, 135, 180, 225, 270, 315}°. The 32 stimuli are sorted by frequencies: stimuli 1–8 (9mcpd), 9–16 (18mcpd), 17–24 (37mcpd), 25–32 (75mcpd). Each stimulus was presented 150 times in randomized blocks of 32 stimuli. Stimuli were flashed for 0.5s followed by a uniform gray mask flashed for 1s.
For the dataset D1, only the first 105 trials were considered in the analysis.
High-resolution photostimulation and large-scale RGCs electrophysiological recordings
Datasets D1 and D2 presented here consist of the light-evoked responses of hundreds of adult mouse RGCs, which were simultaneously recorded using the 4096 APS CMOS-MEA platform (Biocam 4096, 3Brain GmbH, Switzerland) (Maccione et al., 2014).
Animals were dark-adapted overnight prior to retinal isolation. On the day of the experiment, the mouse was sacrificed by cervical dislocation, eyes were quickly enucleated and placed in artificial cerebrospinal fluid (aCSF) containing the following
(in mM): 118 NaCl, 25 NaHCO3, 1 NaH2 PO4, 3 KCl, 1 MgCl2, 2 CaCl2, 10 glucose, and 0.5 l-Glutamine, equilibrated with 95% O2 and 5% CO2. The retina was isolated from the eye cup and flattened, RGC layer facing down, onto the active area of the CMOS-MEA chip. Throughout recording, retinas were maintained at 32°C and perfused with aCSF at a rate of 1ml/min. All surgical procedures were performed under dim red light and the room was maintained in darkness throughout the experiment.
Pan-retinal RGCs responses to visual stimuli were recorded using the 4096 APS CMOS-MEA platform integrated with a custom built high-resolution photostimulation system. The photostimulation system is based on a DLP video projector (“lightCrafter”, Texas Instruments, USA), and was designed to project visual stimuli with micrometer spatial resolution over the entire retina and at sub-millisecond precision. Briefly, retinas were prepared and maintained on BioChips 4096S+ (3Brain GmbH, Switzerland). These CMOS-MEAs provide an array of 64×64 simultaneously recording electrodes over an active area of 2.67mm×2.67mm and an overall plain area of 6mm×6mm used to flatten the retina on the chip, ensuring good contact between the tissue and the electrodes. The platinum electrodes are 21μm×21μm in size (42μm pitch). Full-array recordings were performed at a sampling frequency of 7.06 kHz/electrode and a trigger signal generated by the photostimulation was simultaneously sampled at the same frequency in order to precisely synchronize the delivery of the light stimuli with the electrophysiological responses recorded from the RGCs. The total area covered by the light patterns is 664×664 pixels and each light-pixel covers 4×4μm2of the chip active area. Neutral density filters (ND 4, mean luminance 1.72 μW/cm2) were used to control the amount of light falling on the retina. Large-scale electrophysiological data from the 4096 electrodes were analyzed using a spike detector (Quantile-based event detection, Maccione et al., 2014; Muthmann et al., 2015) and
single-unit spikes were sorted using the T-Distribution Expectation-Maximisation algorithm in Offline Sorter (Plexon Inc, Dallas, USA). Sorted units that had a reasonable amount of spike waveforms in relation to the recording length (~>0.1 spikes/sec) were then verified by visual inspection of the found clusters in the 2/3D principle component feature space (well separated clusters), calculated ISIs (>refractory period) and waveforms (different shapes) in the Offline Sorter GUI. Due to the high density of electrodes, the same units were sometimes detected on multiple electrodes. These redundant units were removed by comparing coincident spikes between neighboring units. Briefly, for each unit, spikes occurring within +-2 frames (1 Frame = 1/7.06 ms) were detected in all units on the four closest electrodes and marked. This was done for all units, and then units with more than 5% coincident spikes were iteratively removed such that for each coincident group only the one with the largest spike count was retained. We tested several thresholds but 5% seemed like a good compromise. Indeed,
it is extremely unlikely that different units would repeatedly and consistently fire together within a window as brief as 700 ns (and because of the mosaic arrangement of RGC subtypes, it is unlikely to find responses originating from distinct RGCs, with different kinetics, within 40 µm from each other).
RGCs electrophysiological recordings with conventional 60-MEAs
The dataset D3 consists of data pooled from nine mouse retinas (C57BL/6 mice aged 19-46 days postnatal) where the light-evoked responses of RGCs were recorded using a conventional 60-channel indium tin oxide (ITO) MEA
(60MEA200/30iRITO; Multichannel Systems, Reutlingen, Germany). We presented the stimuli using a 6.5” LCD monitor (640x480px, 60Hz refresh rate), focused onto the RGC layer using a pair of lenses (Edmund Optics, Barrington, USA) and a 2X objective on an Olympus IX-71 inverted microscope (Olympus, Tokyo, Japan). Stimuli were generated in Matlab (MathWorks, Natick, USA) and controlled using Psychtoolbox (Brainard, 1997; Pelli, 1997; Kleiner et al., 2007). Each monitor pixel covered an area of 23.333x23.333μm2, so the four bar widths correspond to spatial frequencies of 10, 20, 40, 80 mcpd. Retinas were prepared for recording using the same method as for APS CMOS-MEA experiments. Extracellular signals were acquired using an MEA1060-Inv amplifier, digitized and sampled at 25 kHz by an MC_Card data acquisition card and recorded using MC_Rack (MultiChannel Systems). Action potentials were extracted offline in MC_Rack using a voltage threshold set at 6.5-8 standard deviations below the signal recorded on each channel during a baseline recording taken at the start of each experiment, before the retina was placed on the MEA. Spike sorting was done for all channels using the same procedure as for data recorded on the APS CMOS-MEA.
RGCs selection and classification
Before the main flashing gratings stimulation, we apply two sequences for cell selection and classification purposes. One of the sequences consists of 15min of randomly flickering (10Hz) checkerboard (100μm square) black or white stimuli. For each cell which had an average spike rate across the entire checkerboard stimulation > 0.5Hz, the spike trains were reverse correlated to the stimulus (spike triggered average, Chichilnisky, 2001), yielding an average 3D volume in space and time that triggers the cell to spike: the estimated RF. We considered the 2D-spatial component of the 3D RF at the time when the absolute value of the RF reaches its maximum. A custom blob-detection script in Matlab (MathWorks, Natick, USA) was
used to select the 2D RFs that were well estimated. This approach yielded the selection of 764 RGCs for dataset D1, and 649 RGCs for dataset D2.
The other sequence consists of full-field light stimulation with 60 repetitions of alternating homogeneous 2s-white, 2s-black stimuli. We estimated each unit’s instantaneous firing rate by convolving its spike train with a Gaussian (standard deviation = 25ms). We then computed a Bias Index (Carcieri et al., 2003) that measures the relative amplitude of the ON and the OFF responses. This index ranges from -1 for pure OFF responses to 1 for pure ON responses. We used this bias index to classify the cells into: OFF cells (-1<bias index<-0.33), ON-OFF cells (-0.33<bias index<0.33), and ON cells (0.33< bias index<1). For the dataset D3, any unit firing fewer than 30 spikes to the full-field stimulus was rejected (assuming a responding unit should have at least one spike per trial).
Spearman’s rank correlation coefficient
The Spearman rank correlation coefficient ρ is a non-parametric measure of statistical dependence between two variables. Applied here for a spike train of size n neurons, the n latencies of the first spikes Aiand Birelated to two different stimuli are converted to ranks ai, bi, and ρ is computed as the Pearson correlation coefficient r between the ranks:
i i i i i i b a b a b a
r
r
r
,
cov(
,
)
Identical latencies are assigned tied ranks and ρ is computed using the standard formula :
2 1 2
6
(
)
c f
1
(
1)
n i i ia
b
n n
with 2(
1)
cf
12
m m
eq.1where cf denotes a correction factor computed for each tied rank and m denotes the number of observation tied to a particular rank. As this correlation coefficient is measured on the ranks of spikes, this measure can be interpreted as a measure of how different are the ranks of the first occurring spikes driven by the two different stimuli: ρ = 1 for identical ranked lists and ρ = −1 for opposite ranked lists.
Partial Information Decomposition (PID)
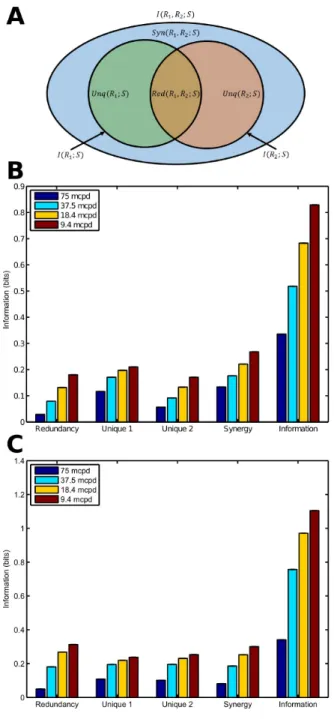
To quantify the amount of synergy contained in RGC population responses, we calculated the PID for RGC pairs (Williams and Beer 2010). We chose PID for two reasons. First, it is asymmetric in that it quantifies mutual information between one random variable and an ensemble of random variables, making it a natural fit for experiments where we record responses of multiple neurons to a single stimulus. Second, unlike many other synergy measures used in the neuroscience literature, it is guaranteed to be non-negative and is able to measure synergy and redundancy simultaneously (Timme et al. 2014). The idea behind PID is to decompose information provided by an ensemble of random variables R (e.g. responses of individual neurons) about another variable S (e.g. a stimulus) into the information provided by each variable individually, by each subset of variables, and by the whole ensemble. The full derivation of the PID is available in Williams and Beer (2010), but the calculation for the two-variable case is described below with the help of the partial information diagram in Figure 3A. The two inner circles represent the information carried by each individual variable about the stimulus:
2
( , )
( ; )
( , ) log
for
1, 2
( ) ( )
i i i i s r ip s r
I S R
p s r
i
p s p r
eq.2Where the two circles overlap is the redundant information between the two variables. To calculate the redundancy, the specific information provided by each variable Riabout a particular stimulus value s is first calculated as the
Kullback-Leibler divergence between the distribution of Riconditioned on s and the marginal distribution of Ri, i.e.
2
( |
)
(
; )
( |
|| )
( |
) log
( )
i i i KL i i i r ip r S
s
I S
s R
D
R S
s R
p r S
s
p r
eq.3(The specific information is not explicitly expressed as a Kullback-Leibler divergence in Williams and Beer (2010), but the equivalence can be shown trivially by applying Bayes’ rule and basic logarithmic identities to their formula.) The redundancy is then the expectation over the stimulus distribution of the minimum specific information provided by either variable about each stimulus value, i.e.:
1 2 1,2
Red( ; ,
)
( ) min (
; )
i i sS R R
p s
I S
s R
eq.4The unique information carried by each variable is the mutual information between that variable and the stimulus less the redundant information:
1 2
The outer ellipse in Figure 2A represents the mutual information between the pair and the stimulus: 1 2 1 2 1 2 1 2 2 1 2
( , , )
( ; ,
)
( , , )log
( ) ( , )
s r rp s r r
I S R R
p s r r
p s p r r
eq.6Finally, the area of this ellipse not covered by the redundant or unique information is the synergistic information:
1 2 1 2 1 2 1 2
Syn( ; ,
S R R
)
I S R R
( ; ,
) Unq( ; ) Unq( ;
S R
S R
) Red( ; ,
S R R
)
eq.7Substituting the equation for Unq(S;Ri) into the equation eq.7 reveals the advantage of the PID over more intuitive measures of synergy, such as the redundancy-synergy index (RSI; used in e.g. Schneidman et al. 2011):
1 2 1 2 1 2
RSI( ; ,
S R R
)
I S R R
( ; ,
)
I S R
( ; )
I S R
( ;
)
eq.81 2 1 2 1 2
RSI( ; ,
S R R
) Syn( ; ,
S R R
) Red( ; ,
S R R
)
eq.9That is, the RSI is the PID synergy less the PID redundancy. A positive RSI is often taken to mean synergistic coding and a negative redundant, but an RSI close to zero could mean anything from independent coding to a code that comprises equal parts synergistic information and redundant information with no independent information. Since we were interested in detecting synergy regardless of the nature of the remaining information, the PID was the more natural fit.
The PID can be defined similarly for larger ensembles, but the complexity of the corresponding partial information diagrams and the resulting expressions become excessively complex extremely quickly as the number of variables increases.
Additionally, the more neurons are included in the ensemble, the higher the dimensionality of the underlying probability distributions and the more data is required to estimate them accurately and precisely (Note that this limitation applies to all synergy measures based on mutual information, not just PID). For these reasons, we decided to restrict our analysis to the two-variable case, i.e. pairs of neurons.
We took each Rias the number of spikes fired by the ith neuron of a pair during the presentation of the stimulus. We
calculated the PID for every pair of neurons that was unique up to ordering: that is, if the PID for a pair (i,j) was calculated, we did not calculate the PID for the pair (j,i). Due to the long presentation times (500ms), we deemed it unnecessary to include any of the period immediately following the stimulus, as 500ms is sufficient to capture the entire response of all but the most sustained of cells.
To correct for bias introduced by limited sampling of the data, each of DKL(Ri|S=s||Ri), I(S;Ri) and I(S;R1,R2) was separately
whole data set of N trials, the data is randomly partitioned into halves, thirds, and so on, and new estimates calculated for each of these partitions. We fit a second-degree polynomial to the estimate as a function of the number of partitions: the intercept of this polynomial corresponds to the estimate one would obtain with infinite samples and is taken as an unbiased estimate of the true value. We also attempted to apply the PID to continuous response variables, such as first spike latency and whole spike trains, but were unable to find a sufficiently accurate and unbiased estimator of the underlying entropies and so those results are not reported here.
Discrimination task
To quantify the performance of the relative activities in encoding stimulus information, we used a discrimination task. Based on RGC responses, the discrimination task consists in identifying the phase φ ∈ {0, 45, 90, 135, 180, 225, 270, 315}° among the eight gratings of a given spatial frequency. We used a classical supervised Bayesian classifier allowing different codes to be tested within the same formalism: the independent spike count code, the independent latency code, the WFS (ROC based on the latencies), and a correlated spike count code (ROC based on the spike counts).
From the available trials, half are randomly chosen as training set for each stimulus and the responses from the remaining trials are the testing set, corresponding to the unknown stimulus
. For each
, we find an estimate
using the a maximum a posteriori criterion:
argmin
log( ( | ))
P
r
eq.10where r represents the set of responses from the tested phase. We used the Bayes theorem to estimate P (φ|r) from the
response distribution P (r|φ), which depends on the code chosen. For each stimulus
tested, 150 different configurations of training set and test set were randomly chosen. Each time the Bayesian classifier was run to guess the phase
. Results were stored in a 8×8-confusion matrix M ( M(
,
) ) that was incremented after every classification. Each column of M represents the results over all configurations when a given phase
was tested. If the maximum lies along the diagonal, then the image has been correctly decoded in a plurality of configurations. To quantify the performance, we estimated thefraction of correct predictions as the mean of the diagonal of the confusion matrix. The fraction of correct predictions lies on the interval [0, 1]. If
is equal to
for all
tested in all trials, the fraction of correct prediction will be 1.Four coding strategies are evaluated in this paper: (i) the spike count code, where r is the average number of spikes within the presentation time of the stimulus, when each neuron is considered as independent; (ii) the latency code, where r is the latency of the first spike after the stimulus onset, in which case the response probability was estimated using a kernel density
estimation (Gaussian function, σ=0,01 s); (iii) the ROC based on the WFS, where r is the rank of latency time after stimulus onset for each neuron (named ROC with latencies), which can be directly obtained from estimating the relative ordering between all pairs of RGCs. In that case, for a RGC pair (i, j), the response distribution is defined by
( , )
(
| )
(
T T)
i j i j
T
P r
C
H L
L
eq.11 where the sum is over trials T of the training set, Ti
L is the latency of neuron i, C is a normalization factor and
if
0,
otherwise.
0
( )
1
s
H s
eq.12(iv) One could argue that the differences observed between the classic independent codes and the WFS may only stem from the correlations taken into account in the ROC scheme. Therefore we also included a coding strategy where the spike counts are used to rank the cells instead of the latencies (named ROC with spike counts), using the same methods as in (iii). This can be related to a joint correlated spike count code.
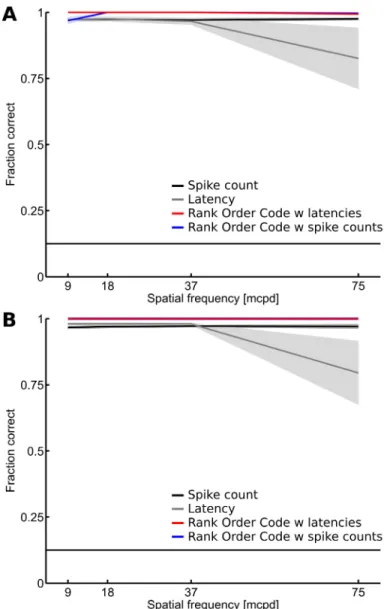
Using this approach, the fraction of correct predictions is shown in Figure 5 for the different coding schemes and as a function of the frequency of the gratings. To investigate the effect of the size of RGC population on the discrimination performance and the variation of the discrimination performance across time, only neural responses related to the 18mcpd gratings were considered. To compute the variation of the performance with the number of RGCs (Figure 6), the fraction of correct predictions is estimated and averaged over 100 randomly chosen RGC subsets (cross-validation) ranging from 2 to 600 RGCs amongst the whole available RGC population. To compute the variation of the performance across time (Figure 7), the fraction of correct predictions is estimated using an observation window that ranged from 0.05s to 0.5s after the stimulus onset.
Results
We present the results from two datasets obtained with the 4096 APS CMOS MEA (D1, with 764 RGCs and D2, with 649 RGCs). Initially, we performed similar experiments using conventional 60-channels MEAs and reached the same conclusions as for D1 and D2 by pooling the data from several retinas (D3, 9 retinas, 258 RGCs). However, datasets from individual retinas recorded with the 60-channels MEA did not produce significant results. The recording capabilities of the 4096 APS CMOS MEA allow us to simultaneously record from hundreds of RGCs in the same retina, yielding results with much more robust statistics. Assuming there are about ~4000 RGCs/mm² (not including displaced amacrine cells) (Rodriguez et al., 2013), or 0.004 RGCs/µm², we estimate that each electrode-pixel area (measuring 42 x 42 µm, or 1764 µm²) can potentially record from a maximum of ~7 RGCs. We record on average from 1 to 2 units per electrode-pixel area, which amounts to 14-29% of all theoretically available RGCs. This provides a huge step forward compared to what has been achieved with earlier recording platforms, enabling us to acquire a much clearer picture of how concerted spiking patterns across a large RGC population encode information about the stimulus. Despite small variability between preparations, the overall pattern of results obtained by the different techniques is the same, thus suggesting that the WFS is a powerful strategy for fast
information transfer.
Retinal responses are noisy but carry synergistic information
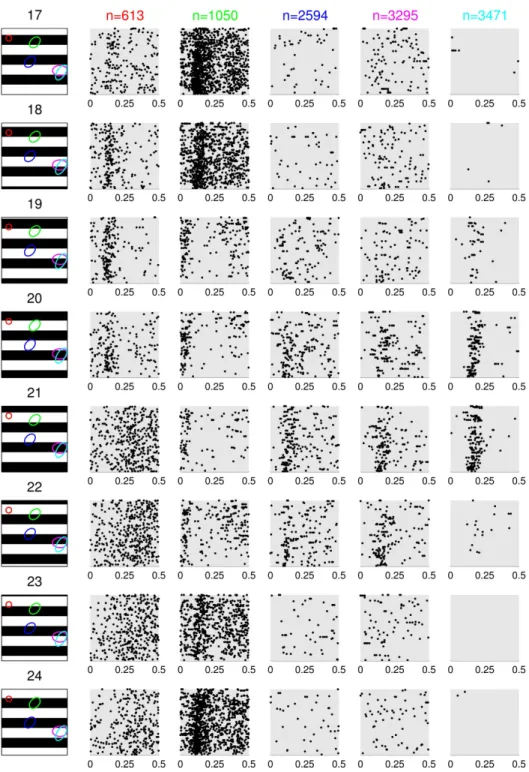
Typical RGC responses from the dataset D1 to flashing gratings with different spatial phases are illustrated in Figure 1. Contrary to previous reports in salamander (Gollisch and Meister, 2008), we found no RGC exhibiting a clear latency tuning to the grating phase. However there is a clear modulation of the RGC spike count with the grating phase. However, despite that clear link between the spike count and grating phase, substantial levels of spontaneous activity appear to blur the temporal precision of the responses to the preferred stimuli in most cells (Figure 1).
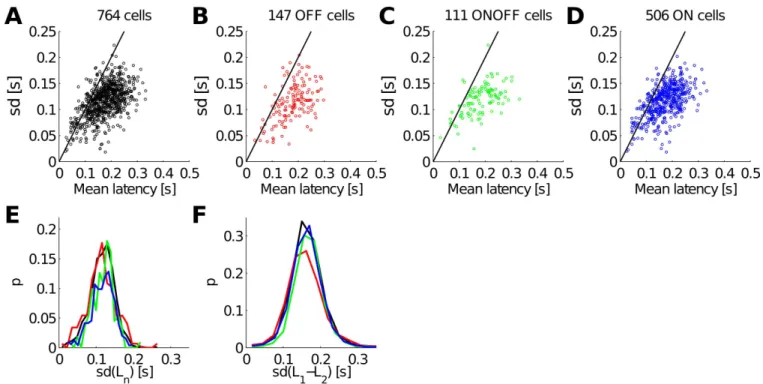
To estimate the overall reproducibility of the RGC responses, we plotted the standard deviation (SD) versus the mean latency of the first spike for individual RGC responses over 105 trials of the first phase of the 37mcpd gratings considering the 764 RGCs (Figure 2A), or separating OFF cells (Figure 2B), ON-OFF cells (Figure 2C), and ON cells (Figure 2D) (see Materials and Methods). Surprisingly, all cells showed large variability in the latency of their first spike with a standard deviation
comparable to the mean. Within each cell type, the mean latency was variable but this variability was qualitatively similar in different cell types. These similarities in RGC responses are striking even when comparing the probability distributions of the standard deviations (Figure 2E). Thus, here the reproducibility of RGC responses to several presentations of the same
stimulus seems to be quantitatively low, and therefore these latencies may not be an accurate indicator of the stimulus content. Similar results were obtained for D2 (data not shown).
Even if the latency of individual cells is noisy, i.e. the standard deviation is large, perhaps the difference between the
latencies of cell pairs (L1-L2) is more reliable, as shown in Gollisch and Meister (2008). In other words the standard deviation of the latency differences may be significantly smaller. We computed and plotted the probability distributions of the standard deviations of latency differences for all cell pairs (black), OFF cell pairs (red), ON-OFF cell pairs (green), and ON cell pairs (red) (Figure 2F, dataset D1). Here again, the latency differences of RGC subpopulations seem to share the same variation across repeated presentations of the same stimulus. Thus, this rules out the possibility that there may be subsets of neurons in which the absolute relative latency is highly repeatable. Moreover, by comparing Figure 2E and Figure 2F, one could argue that the standard deviations of the latency differences may be on average even larger, or at least equal to those of the individual latencies. This demonstrates that the latency differences of cell pairs is not an accurate indicator of the stimulus content either. Similar results were obtained for D2 (data not shown).
As modulation of the RGC spike count with the grating phase is nevertheless conspicuous (Figure 1), we performed a Partial Information Decomposition (PID) (see Materials and Methods) to quantify the amount of redundant, unique and synergistic information available in the spike counts (Figure 3B and 3C, dataset D1and dataset D2 respectively). This analysis shows that a considerable portion of the available information carried by the spike trains is synergistic, suggesting that the relative activities, i.e. the concerted spiking pattern of the entire RGC population carries information that is not available in the spiking of individual neurons. Shuffling the responses to each stimulus of one neuron of each pair relative to the other had a negligible effect on the PID (data not shown), suggesting that the synergy does not arise due to noise correlations. This analysis also suggests that although the noise level (spontaneous activity) may impair the reliability of the responses in individual RGCs, more reliable results are achieved when considering multiple RGC responses simultaneously rather than when treating individual RGC responses separately.
Accessing the synergistic information with the relative activities
Although the PID results suggested there was synergy in RGC pair spiking responses, the limitations of the PID (see Methods) prevent us from using it to answer how much synergy there is in larger populations or other response features, such as the timing of spikes. To address these questions indirectly, we investigated whether the WFS, which takes the relative activities of the entire RGC population into consideration, could be a plausible alternative indicator of the stimulus content. So here, the synergistic information conveyed by the WFS refers to the mean response properties of the neurons, i.e. to signal correlations in the response rather than to noise correlation..
To quantify the differences between the WFS obtained with gratings of different phases, we used the Spearman rank
correlation coefficient ρ (see Materials and Methods). This measure can be interpreted as a distance between two ranked lists: ρ = 1 for identical ranked lists and ρ = −1 for ranked list that are opposite.
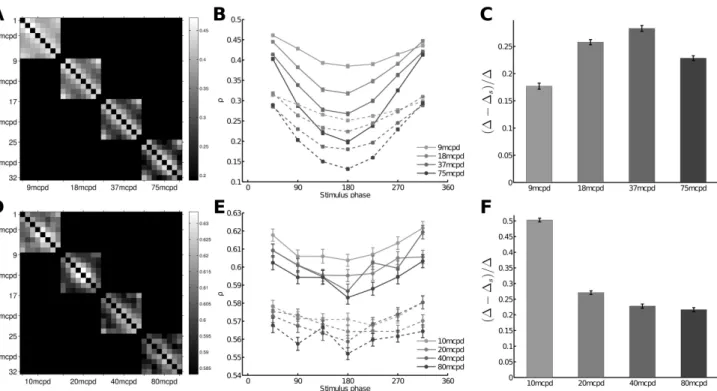
Figures 4A, 4B, 4C show the Spearman rank correlation analysis for the dataset D1 (similar results were obtained for D2, data not shown). Figure 4A shows the mean rank correlation ρ between responses recorded from two stimuli
φ,
computed across all trials, between all stimuli pairsφ
iandφ
jsharing the same spatial frequency, i.e. ρ(φ
i, φ
j). This representationshows periodic patterns matching the phase differences. Given a spatial frequency and the grating with phase 0° as a reference, one can plot the variations of ρ(0, φ)|{φ=45..315}, where φ are the phases of the other gratings. Results are shown in Figure 4B (continuous lines): ρ(0, φ) is high for phases near 0° and decreases for phases φ = 90°to 180°. The ρ varies cyclically with the phase of the gratings and this effect is even stronger for high spatial frequencies, suggesting that the WFS is tuned to the phase of the grating and that it is a good indicator of the stimulus content. One could assume that even if the individual cell latency may have some trial-to-trial variability, these variations could be positively correlated in cells recorded simultaneously, leading to a preservation of the relative activities from trial to trial. This hypothesis can be assessed by artificially destroying the noise correlation by pairing RGC responses belonging to different trials. By pairing RGC responses shifted by one trial, Gollisch and Meister (2008) observed a loss of up to 20% of the mutual information. Here, we paired RGC responses by randomly shuffling the trials, resulting in an overall loss of correlation. Results are shown in dashed lines in Figure 4B. WFSs are less distinct from each other, but the shuffling of trials does not completely impair the information contained in the WFS as the tuning to the phase is still visible. To quantify the loss related to the shuffling of trials for each frequency, we compared the average difference across trials between ρ(0, 45) and ρ(0, 180) denoted by ∆ and the same
quantity when trials are shuffled, denoted by ∆s. Figure 4C shows (∆-∆s)/∆ as a function of the grating frequency. Shuffling the trials leads to a loss of ρ up to 30%.
Figures 4D, 4E, 4F show the Spearman rank correlation analysis for the dataset D3. Both datasets D1 and D3 show similar periodic variation of the distance as a function of the phase. However, this effect is less clear for dataset D3. In this particular data set, the spikes are ranked within each recorded retinas (responses of RGCs belonging to different retinas are not paired). Thus, even if in total there are 258 RGCs, in practice only a few of them encode simultaneously for the stimulus content. For dataset D1, the use of 4096 APS CMOS MEA provides a huge improvement in deciphering the concerted spiking pattern of a large RGC population because here, 764 cells are simultaneously taken into consideration.
Relative activities provide efficient coding capability
To quantify the coding capability of the relative activities, we considered a discrimination task consisting of identifying which of the eight gratings is represented in the RGC population response for a given spatial frequency (see Materials and Methods). Figure 5 shows a comparison of the fraction of correct identifications for the independent spike count code (black), the independent latency code (gray), the ROC with latencies (red), and the ROC with spike counts (blue). All 764 RGCs of dataset D1 (Figure 5A) and 649 RGCs of dataset D2 (Figure 5B) were used in this analysis. Results show that all the
decoders perform well in this task (close to 1, maximal value), even if the latency decoder seems to slightly lose performance at the highest spatial frequency. Note that although the individual RGC responses were not precise in time (large SD values, Figure 2A), the sum of the information contained in the spiking of individual RGCs was sufficient to perform well in this task. This may be due to the large number of RGCs considered with different response patterns and the low spatial complexity of the stimuli used in this task. The ROC with spike counts (correlated spike count) and the ROC with latencies (WFS) still appear to outperform the classical decoders, demonstrating that the relative activities efficiently encode for spatial information about the stimulus.
Relative activities enable efficient transmission of visual information with only few neurons
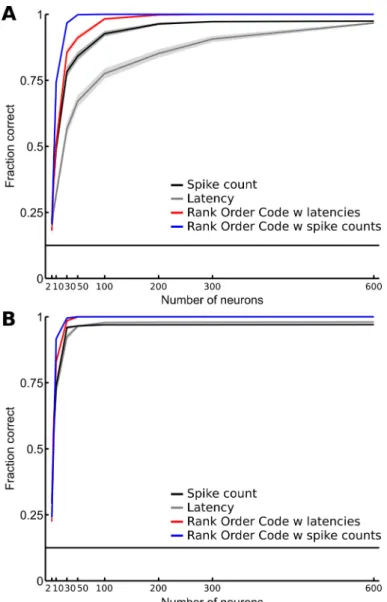
One may wonder if the large number of RGCs may obscure more subtle differences in the coding efficiency of the spike count code, the latency code, the ROC with latencies, and the ROC with spike counts. To address this question, we investigated how the decoders’ performances vary with the size of the RGC population. We performed the discrimination
task with increasing numbers of RGCs and considering only gratings of 18mcpd spatial frequency. At this spatial frequency and when all the RGCs are taken into consideration, all four decoders performed equally well, with a score ≥ 0.9 (Figure 6). Figure 6 shows the evolution of the fraction of correct identifications as a function of the number of RGCs, from 2–600 RGCs, for the dataset D1 (Figure 6A) and the dataset D2 (Figure 6B). As expected, all four decoders perform better when the number of RGCs increases. However, in Figure 6A, the ROC with spike counts and the ROC with latencies both rapidly outperform the classical spike count and latency decoders. To illustrate the benefit of taking correlations in the response into account, let us focus on the ROC with latencies in Figure 6A. It reaches a score of 0.8 with only 30 neurons. The independent latency decoder needs 300 neurons to reach the same 0.8 score. Thus, to reach 80% accuracy level like a correlated latencies code (WFS) does with 30 cells, one would need 300 independent cells, i.e. ten times more independent cells. Even if the overall performances are better than for dataset D1, similar results were obtained for dataset D2 (Figure 6B).
Relative activities enable fast transmission of visual information
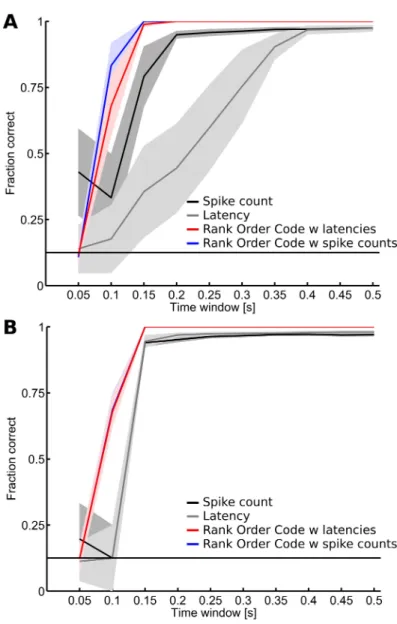
Finally, we investigated how fast each of the four coding strategies can transmit information by computing the fraction of correct identifications as the length of the observation window varied from 0.05 sec to 0.5 sec after the stimulus onset. Responses to the 18mcpd spatial frequency gratings were used in this analysis and the results are shown in Figure 7A for dataset D1, and in Figure 7B for dataset D2. Overall, the performance of all four decoders increases with the length of the observation window. In figure 7A, the independent spike count and the independent latency decoders respectively need 0.2s and 0.4s after the stimulus onset to reach their maximal performances. Once again, the ROC with spike counts and the ROC with latencies decoder rapidly outperform the two independent decoders and they reach their maximal performance within 0.15s after the stimulus onset. So here, even though both ROCs and independent decoders are based on the same basic measure (latencies or spike counts), taking into account the correlation within the population significantly improves performance, enabling rapid transmission of the relevant information. Although the overall performances are better than for dataset D1, similar results were observed for dataset D2 (Figure 7B).
Discussion
Several coding strategies have been investigated by different groups using mostly artificial stimuli. Two main streams of thought have emerged: one considering RGCs as independent encoders, and another one considering them as synergistic encoders, i.e. when the relative activities in a RGC population contains information that is not available in the spiking of individual RGCs. Nirenberg et al. (2001) argued that RGCs encode information individually as they measured very little increase in mutual information between stimulus and response when taking into account correlations between RGCs versus considering them independently. However, as the same group notes in a later paper (Latham and Nirenberg 2005), synergistic information can exist in a system without strong pairwise correlations. Moreover, there is a growing body of evidence that when RGCs are considered as synergistic encoders, they carry complementary and more precise information about the stimulus.
Overall, our findings suggest that synergistic encoding of information in the relative activities of a neuronal population is a feature of RGC responses at the population level. Here, we used the PID (Williams and Beer, 2010) to directly quantify the amount of synergy in the RGC population response and found it to be a significant fraction of the total information carried by pairs of neurons. Shuffling the data did not reduce the synergy, so noise correlations are unlikely to be the source. Therefore, how this synergy arises is unclear and remains an interesting topic for future work. It should be noted that, in the absence of noise correlations, the synergy defined in eq. 7 reduces to Red(S;R1,R2) – I(R1;R2), and thus is maximized as signal
correlations go to zero (assuming fixed redundancy). This suggests a combinatorial code in which different cells encode orthogonal stimulus features. Possible examples include distinct cell types providing complementary information about the stimulus or cells with spatially separate receptive fields providing information about the spatial structure of the stimulus that is unavailable when considering individual neurons. As a simple example of the former, consider an ON cell that fires a single spike if and only if it sees a light increment in some part of its receptive field and an OFF cell that responds similarly to light decrements. Both cells have overlapping receptive fields. Imagine that both cells are illuminated by a uniform grey field that is replaced, with equal probability, by either a black field, a white field, or a black and white field split down the center of the two receptive fields (this example is similar to that used by Williams and Beer (2010), to illustrate the asymmetry of the PID). Either cell alone can distinguish one stimulus from the other two, but not the remaining two from
each other (e.g. the ON cell fires to both the white and split fields but not the black field). Distinguishing all three stimuli requires both cell types and, according to PID, 21% of the information about the stimulus available in pair responses is synergistic, but the information lost by ignoring correlations in this system is exactly zero. Obviously this example is not representative of real retinal coding, but rather serves to illustrate how synergy can arise through different cell types without strong pairwise correlations. The amount of synergy may also depend on the stimulus itself, with different stimulus classes lending themselves more or less well to synergistic encoding. Direction selectivity is an example of this. Imagine two direction-selective cells with perpendicular preferred directions that fire strongly to motion along their preferred direction, weakly or not at all to motion against this direction and moderately to motion perpendicular to it. Suppose we wish to distinguish bars moving in four perpendicular directions aligned with the two cell’s preferred directions. Both cells provide redundant information about which axis the bar is moving along. Additionally, each cell provides unique information about whether the bar is moving towards or against its preferred direction. This is all the information there is to be about the bar’s motion direction: unlike in the split fields example, there is no synergistic information, illustrating how different stimuli can affect the amount of synergy present. However, we cannot address the question of how the stimulus affects the amount of synergy with the type of stimulus (square wave gratings) used here.
Having demonstrated the existence of synergistic information in the population response, several strategies can be used to decode the relative activities. Assuming that the firing order is stimulus-specific, the simplest algorithm is the winner-take-all decoder (Barnden and Srinivas, 1993). In this decoder, for an incoming firing pattern across the entire RGC population, the decision of the classifier is determined by the RGC with the shortest latency. But this decoder can be unreliable, especially if the timing of incoming spikes is variable, for instance when there is strong spontaneous activity (as observed in our
recordings), or if spikes generated by different RGCs occur in very short succession, or even become completely
synchronous. Another possibility is to consider the spatiotemporal patterns of all spikes within a given time window and to use the tempotron algorithm (Gütig and Sompolinsky, 2006). The tempotron consists of a single integrate-and-fire model neuron (IF) that receives inputs from the population of RGCs. Depending on the relative timing of the incoming spikes and on their synaptic weights (that are a priori determined; supervised algorithm), the summation of all the inputs will determine whether the IF neuron will fire or not. Thus, this model can classify the input spikes patterns into those that elicit a spike in the IF neuron, as well as those that do not trigger the IF neuron. The tempotron was used to analyze salamander retinal
responses and was able to decode complex visual features (Gütig et al., 2013). The authors applied this decoding strategy to fast-OFF RGCs, using a total of only 41 pooled RGCs recorded from nine different retinas. However, how this coding scheme would behave with other RGC subtypes or with a mixture of RGC subtypes, and how performance will be affected by using a larger RGC population were left as open questions.
In the present study, we investigated in the mouse retina whether the relative latencies between neuron pairs could be a good indicator of the stimulus content, as shown in Gollisch and Meister (2008) for the salamander retina, but the outcome was negative. RGCs in the salamander retina exhibit lower levels of spontaneous activity (Gollisch and Meister, 2008) than in mouse (Figure 1). Therefore salamander RGCs demonstrate high reproducibility in their latencies (especially for so called fast OFF RGCs) to the onset of the same stimulus (with only a few ms of latency standard deviation), which may explain why the authors were able to detect fine tuning of the absolute relative latencies between pairs of neurons. Unfortunately, the low reproducibility observed here in mouse RGC responses (Figure 4) might have hidden fine tuning of absolute relative latencies. One could also argue that those animals (salamander vs mouse) are different from an ecological and behavioral point of view and that their visual system may have been tuned to fit their own ecological constrains.
Going further, we investigated whether the population response as a whole could be a better indicator of the stimulus. We have applied a simpler decoding strategy based on the ROC decoder (Thorpe et al., 2001), which can take latencies (ROC with latencies, WFS read-out) or spike counts (ROC with spike counts) as inputs, to a large, mixed RGC population (D1, 764 RGCs; D2, 649 RGCs), regardless of their specific functional subtypes. Here, the WFS, is represented by the rank of the first stimulus-evoked spikes for each RGC. To assess the performance of the ROC decoder for the stimuli used in this work, we designed a discrimination task where the goal was to identify the phase of the gratings. We found that the ROC with latencies and spike counts decoders are able to perform the task better than the spike count- or the latency-based decoder (Figure 5). A step further, we wondered how the size of the RGC population could impact the performance of each decoder in the
discrimination task. This question is important since in a more naturalistic scenario, one could argue that local analyses of spatial structure based on fewer specialized cells will be required. To answer this question we performed the discrimination task using increasing numbers of RGCs (Figure 6). Even if all decoders increase their performances with the number of RGCs, the ROC with latencies and spike counts tend to perform better than the classical independent decoders for
populations of 50 RGCs or more. The difference in the effect of number of neurons on the WFS and individual latency codes in particular is consistent with the findings of Schwartz et al. (2012), who reported that, for large numbers of neurons, a latency code assuming independent neurons suffers greatly in performance compared to one that exploits the full correlation structure of the latencies.
Regardless of the RGC subtype and the level of spontaneous activity, one of the main conclusions is that the WFS robustly encodes sufficient information about spatial cues to succeed in this discrimination task. Since there is evidence that different RGC subtypes encode different features of the stimuli (Zhang et al., 2012; van Wyk et al., 2006), an interesting perspective would be to further investigate the specific role of each sub-populations of RGCs within the WFS. More generally, assuming that the functional and morphological characterization of RGCs is available, one could consider an ensemble of
discrimination tasks and determine which sub-populations are relevant for each task.
ROCs convey visual information faster than classical coding strategies. This is what we observed by comparing the discrimination performances of the different decoders as a function of the duration of the time window after the stimulus onset (Figure 7). Already at the retinal output level, we show that a simple decoder that exploits the relative activities allows the visual information to be extracted much faster than the classical decoders. These results are in line with previous studies which have suggested that the ROC scheme, initially based on the latencies, could be an efficient and fast strategy for processing visual information (Thorpe et al., 2001; Guyonneau et al., 2004; VanRullen et al., 2005; Masquelier and Thorpe, 2007). The relevance of the WFS for a whole RGC population read-out by a ROC has been investigated at the retinal level using a simulated RGC population (VanRullen and Thorpe, 2001). However, since we used multiple trials for the decoding as in Jacobs et al. (2009), one could argue that the direct link to the original concept in rapid single-trial classification tasks (Thorpe et al. 1996) cannot be done. Nevertheless, we reran the analysis using all-but-one cross-validation (hence each trial is decoded individually) and found the WFS (ROC with latencies) to be at least as good as (in one retina) or better than (in the other) the independent spike count code and in all cases better than the independent latency decoder. Figure 7 demonstrates that the rank format makes things easier for the classifier (discarding noise, but not signal). This is consistent with the idea that some of the trial-to-trial variability in the latencies is shared across cells. This kind of variability is detrimental to the independent code, but not to the ROC scheme.
Although our results demonstrate the power and efficiency of the ROC scheme, they give no hint as to how it might be implemented biologically. One has to ponder that a code based on the absolute relative latencies in the entire population should subsume the WFS code and, hence, could perform better. But to our knowledge, only mechanisms which are sensitive to a tight spike timing correlation, such as Spike-Timing-Dependent Plasticity, have been reported in the literature and could plausibly be able to read out the earliest firing inputs, i.e. here the WFS, (Guyonneau et al., 2004; Masquelier et al., 2008). Decoding latency ranks could be done by biologically plausible mechanisms such as shunting inhibition (Thorpe et al., 2001). To our knowledge, no one has ever proposed a mechanism to decode spike count ranks.
Nevertheless, one has to note that the ROC with spike counts tends to perform slightly better than the ROC with latencies (figures 5,6,7). For this particular task, it is highly possible that the information provided by the ROC with spike counts is superior to what the other codes investigated here are able to provide (but it may not be the case for more complex stimuli). Already in Figure 1, the modulation of the spike count across the stimuli is visible by eye in the raster plots, which is not the case for the latencies. So, the information carried by the spike count would be less noisy than the information carried by latencies. Thus, even if taking into account correlations between neuron latencies (ROC with latencies) extracts more of the total information available in the latencies, the ROC with spike count wins over, because it there is more information in the firing rates to begin with. The most important point here is that those results are in line with previous studies where the functional significance of the concerted firing pattern has been investigated, for instance using a model of multi-neuron spike responses (Pillow et al., 2008). The authors showed that a read-out model that exploits the response correlation structure extracts 20% more information about the stimulus than a read-out model based on the independence assumption, and also preserves 40% more visual information than optimal linear decoding. Otherwise stated, if there are correlations in the firing patterns of a RGC population, it is beneficial to incorporate this structure in the read-out model.
We must remember that the stimuli used in our study are simple. All the four codes performed the discrimination task equally well. It may be that the discrimination task, as executed, is not sufficiently demanding to compare the potential performance of these codes thoroughly. The fine encoding provided by combinatorial codes might not be necessary or might not provide a lot more useful information about the stimuli than classical independent codes already do. Nevertheless, those combinatorial codes seem to do a better job at extracting information about the stimuli with small neural population and short time windows
(Figure 6 and Figure 7). In future studies, it would be interesting to test those codes in a much more demanding discrimination task involving more complex stimuli.
How those codes would perform with a discrimination task involving stimuli with richer spatial content is an important open question and the answer may not be trivial. In Schwartz et al. (2012), when flashing black and white shapes onto salamander retinas, the authors reported that simple linear decoders, i.e. decoders based on independent spike train coding strategies, can only decode coarse stimulus properties such as the overall size or contrast. Thus, to perform high-fidelity discrimination, one needs non-linear decoders that take correlations between RGC responses into account. So one could assume that in a discrimination task involving richer stimuli, independent coding schemes would perform less well than coding schemes that take into account correlations in the population responses. In other words, the ROC-based scheme, which considers the relative activities, would perform better than classical independent schemes in complex discrimination tasks.
Nevertheless, one could wonder whether the performance of the WFS represents a true timing code or is merely an artefact of rate coding. For example, one would intuitively expect a cell with a high stimulus-driven firing rate to fire its first spike following the stimulus sooner, on average, than a cell with a much lower stimulus-driven firing rate. We reran the discrimination analysis with jittered spike times (σ = 20ms, data not shown) – which should destroy timing information while preserving rate information – and saw no clear differences in WFS performance. Combined with the large amount of information available in correlated spike counts (i.e. the ROC with spike counts) here, this is consistent with (but does not prove) a latency code that arises as an epiphenomenon of rate coding. However, the debate between whether or not latency coding is an artefact of rate coding is an open question and a complete discussion of this is beyond the scope of this paper.
We are not arguing that there is only one reliable neural code. Indeed, there might be several concurrent, parallel streams of information sent from the retina to the brain, each encoding for different stimulus features (Masland, 2012). Here we show that, in parallel with the classical individual spike count and individual latency codes, the relative activities, e.g. the WFS, also co-exists and may encode for reliable information about the visual scene. To our knowledge, our study represents the first experimental evidence that the relative activities and in particular the WFS, i.e. the first stimulus-evoked spikes across the whole RGC population, obtained by large-scale RGC population recordings, is relevant and our results suggest that the ROC scheme can be a powerful mechanism to encode and transmit visual information through visual pathways.
Since understanding how neurons fire with respect to one another is of fundamental importance for deciphering neural codes in sensory systems, our results on the WFS may have implications beyond retinal coding. In the olfactory system, the WFS and spike-timing in neuronal ensembles play an important role in information encoding (Shusterman et al., 2011; Smear et al., 2011). In the somatosensory system, it has been shown that the relative timing of the first spikes after the stimulation onset contains rich information about the stimulus, such as the direction, the force, and the shape of the surface contacting the fingertip (Johansson and Birznieks, 2004). Similar observations have also been reported in the auditory system (Christopher deCharms and Merzenich, 1996; Chase and Young, 2007; Brasselet et al., 2012). All these observations reinforce the universality and power of the WFS, which represents a common denominator in various sensory modalities, conveying sufficient information for the encoding and fast transmission of relevant sensory information to the brain, allowing it to process and produce fast sensory-input driven appropriate responses.
Acknowledgements
The authors would like to thank Bruno Cessac and Matthias Hennig for their insightful discussions and the two referees that helped to improve the manuscript. The research received financial support from the 7th Framework Program for Research of the European Commission (Grant agreement no 600847: RENVISION, project of the Future and Emerging Technologies (FET) program Neuro-bio-inspired systems (NBIS) FET-Proactive Initiative)) and the Wellcome Trust (grant number 096975/Z/11/Z).
Author Contributions
GP defined experimental design, performed the rank correlation analysis and the discrimination task and wrote the manuscript. JMB conducted all experiments using 60-channel MEAs, performed the PID analysis and wrote the manuscript. GH performed the HD large scale MEA experiments and contributed to data analyses and writing. TM contributed to data analysis and writing. LB, AM and SDM contributed by developing the 4096 electrode array platform integrated with a high-resolution photostimulation system; LB for writing. PK and ES contributed to experimental design, data analysis and writing.
References
Barnden J, Srinivas K (1993) Temporal winner-take-all networks: A time-based mechanism for fast selection in neural networks. Neural Networks, IEEE Transactions on 4:844-853.
Berdondini L, Imfeld K, Maccione A, Tedesco M, Neukom S, Koudelka-Hep M, Martinoia S (2009) Active pixel sensor array for high spatio-temporal resolution electrophysiological recordings from single cell to large scale neuronal networks. Lab on a Chip 9:2644-2651.
Brainard D (1997) The Psychophysics Toolbox. Spatial Vision 10:433-436.
Brasselet R, Panzeri S, Logothetis NK, Kayser C (2012) Neurons with stereotyped and rapid responses provide a reference frame for relative temporal coding in primate auditory cortex. The Journal of Neuroscience 32:2998-3008.
Carcieri SM, Jacobs AL, Nirenberg S (2003) Classification of retinal ganglion cells: A statistical approach. Journal of Neurophysiology 90:1704-1713.
de Charms RC, Merzenich MM (1996) Primary cortical representation of sounds by the coordination of action-potential timing. Nature 381:13.
Chase SM, Young ED (2007) First-spike latency information in single neurons increases when referenced to population onset. Proceedings of the National Academy of Sciences 104:5175-5180.
Chichilnisky EJ (2001) A simple white noise analysis of neuronal light responses. Network: Comput Neural Syst 12:199-213.
Crouzet SM, Kirchner H, Thorpe SJ (2010) Fast saccades toward faces: face detection in just 100 ms. Journal of Vision 10:16.
Gautrais J, Thorpe SJ (1998) Rate coding vs temporal order coding : a theorical approach. Biosystems 48:57-65.
Gollisch T, Meister M (2008) Rapid neural coding in the retina with relative spike latencies. Science 319:1108-1111. DOI: 10.1126/science.1149639.
Greschner M, Thiel A, Kretzberg J, Ammermüller J (2006) Complex spike-event pattern of transient on-off retinal ganglion cells. J Neurophysiol 96:2845-2856.
Gütig R, Sompolinsky H (2006) The tempotron: a neuron that learns spike timing-based decisions. Nature neurosci 9:420-428.
Guyonneau R, VanRullen R, Thorpe SJ (2004) Neurons tune to the earliest spikes through stdp. Neural Computation 17(4):859-879.
Jacobs AL, Fridman G, Douglas RM, Alam NM, Latham PE, Prusky GT, Nirenberg S (2009) Ruling out and ruling in neural codes. Proceedings of the National Academy of Sciences 106:5936-5941.
Johansson R.S, Birznieks I (2004) First spikes in ensembles of human tactile afferents code complex spatial fingertip events. Nature neuroscience 7:170-177.
Kirchner H, Thorpe SJ (2006) Ultra-rapid object detection with saccadic eye movements: Visual processing speed revisited. Vision Research 46:1762-1776.
Kleiner M, Brainard D, Pelli D (2007) What’s new in Psychtoolbox-3? Perception 36:ECVP Abstract Supplement.
Latham PE, Nirenberg S (2005) Synergy, redundancy, and independence in population codes, revisited. J Neurosci 25:5195-5206.
Maccione A, Hennig MH, Gandolfo M, Muthmann O, Coppenhagen J, Eglen SJ, Berdondini L, Sernagor E (2014) Following the ontogeny of retinal waves: panretinal recordings of population dynamics in the neonatal mouse. J Physiol 592:1545-1563.
Masland RH (2012) The neural organization of the retina. Neuron 76:266-280.
Masquelier T, Thorpe SJ (2007) Unsupervised learning of visual features through spike timing dependent plasticity. PLoS Comput Biol 3(2):e31.
Masquelier T, Guyonneau R, Thorpe SJ (2008) Spike timing dependent plasticity finds the start of repeating patterns in continuous spike trains. PLoS ONE 3(1):e1377.
Muthmann JO, Amin H, Sernagor E, Maccione A, Panas D, Berdondini L, Bhalla US, Hennig MH (2015) Spike detection for large neural populations using high density multielectrode arrays. Front Neuroinform 9:28.
Nirenberg S, Carcieri S, Jacobs A, Latham PE (2001) Retinal ganglion cells act largely as independent encoders. Nature 411:698-701.
Pelli D (1997) The VideoToolbox software for visual psychophysics: Transforming numbers into movies. Spatial Vision 10:437-442.
Pillow JW, Shlens J, Paninski L, Sher A, Litke AM, Chichilnisky E, Simoncelli EP (2008) Spatio-temporal correlations and visual signalling in a complete neuronal population. Nature 454:995-999.
Rieke F, Warland D, de Ruyter van Steveninck R, Bialek W (1997) Spikes: Exploring the Neural Code (Bradford Books)
Rodriguez AR, de Sevilla Müller LP, Brecha NC (2014) The RNA binding protein RBPMS is a selective marker of ganglion cells in the mammalian retina. J Comp Neurol 522(6):1411-43.
Schneidman E. Puchalla JL, Segev R, Harris RA, Bialek W, Berry MJ (2011) Synergy from silence in a combinatorial neural code. J Neurosci 31:15732-41
Schwartz G, Macke J, Amodei D, Tang H, Berry II M (2012) Low error discrimination using a correlated population code. J Neurophysiol 108:1069-1088.
Shusterman R, Smear MC, Koulakov AA, Rinberg D (2011) Precise olfactory responses tile the sniff cycle. Nature neurosci 14:1039-1044.
Smear M, Shusterman R, O’Connor R, Bozza T, Rinberg D (2011) Perception of sniff phase in mouse olfaction. Nature 479:397-400.
Timme N, Alford W, Flecker B, Beggs JM (2014) Synergy, redundancy, and multivariate information measures: an experimentalists perspective. J Comput Neurosci 36:119-140.
Thorpe SJ, Fize D, Marlot C (1996) Speed of processing in the human visual system. Nature 381:520-522.
Thorpe SJ, Delorme A, VanRullen R (2001) Spike based strategies for rapid processing. Neural Networks 14:715-726.
VanRullen R, Thorpe SJ (2001) Rate coding versus temporal order coding: What the retina ganglion cells tell the visual cortex. Neural Computing 13:1255-1283.
VanRullen R, Guyonneau R, Thorpe SJ (2005) Spike times make sense. Trends in Neurosci 28:1-4.
Williams PL Beer RD (2010) Nonnegative decomposition of multivariate information. arXiv p. 1004.2515v1.
van Wyk M, Taylor W, Vaney D (2006) Local edge detectors: A substrate for fine spatial vision at low temporal frequencies in rabbit retina. J Neurosci 26:13250.
Zhang Y, Kim IJ, Sanes JR, Meister M (2012) The most numerous ganglion cell type of the mouse retina is a selective feature detector. Proceedings of the National Academy of Sciences 109:E2391-E2398.
Figure 1:Typical RGC responses of the dataset D1 to flashed gratings of spatial frequency 37mcpd and different phases. Colored ellipses superimposed on grating images show the estimated receptive fields of the chosen RGCs. For each RGC chosen, the 105 repetitions, recorded with the 4096 APS CMOS MEA are plotted from 0s (stimulus onset) to 0.5s. We found no RGC exhibiting a clear latency tuning to the grating phase. However, a clear modulation of the RGC spike count with the grating phase can be observed for some cells.
Figure 2:Latency variability and information decomposition. (A-F) Considering stimulus 17 (φ = 0°, 37mcpd). (A) The standard deviation is plotted as a function of the mean latency over the 105 repetitions, for all 764 RGCs of the dataset D1, for (B) only the 147 OFF cells, for (C) only the 111 ONOFF cells, or for (D) only the 506 ON cells (see Materials and Methods for the classification method). The black line corresponds to a standard deviation that is equal to the mean latency. This shows the considerable variability of individual latencies. (E) The probability distribution of the individual latency standard deviations for all cells (black), OFF cells (red), ON-OFF cells (green), and ON cells (blue). (F) The probability distribution of the standard deviations of latency difference for all cell pairs (black), OFF cell pairs (red), ON-OFF cells pairs (green), and ON cell pairs (blue).