Publisher’s version / Version de l'éditeur:
Vous avez des questions? Nous pouvons vous aider. Pour communiquer directement avec un auteur, consultez la première page de la revue dans laquelle son article a été publié afin de trouver ses coordonnées. Si vous n’arrivez pas à les repérer, communiquez avec nous à PublicationsArchive-ArchivesPublications@nrc-cnrc.gc.ca.
Questions? Contact the NRC Publications Archive team at
PublicationsArchive-ArchivesPublications@nrc-cnrc.gc.ca. If you wish to email the authors directly, please see the first page of the publication for their contact information.
https://publications-cnrc.canada.ca/fra/droits
L’accès à ce site Web et l’utilisation de son contenu sont assujettis aux conditions présentées dans le site LISEZ CES CONDITIONS ATTENTIVEMENT AVANT D’UTILISER CE SITE WEB.
Annual Conference of the Transportation Association of Canada (TAC)
[Proceedings], pp. 1-19, 2008-09-21
READ THESE TERMS AND CONDITIONS CAREFULLY BEFORE USING THIS WEBSITE.
https://nrc-publications.canada.ca/eng/copyright
NRC Publications Archive Record / Notice des Archives des publications du CNRC : https://nrc-publications.canada.ca/eng/view/object/?id=9f89b2fd-d1a4-46b5-b59f-f2c5795a3beb https://publications-cnrc.canada.ca/fra/voir/objet/?id=9f89b2fd-d1a4-46b5-b59f-f2c5795a3beb
NRC Publications Archive
Archives des publications du CNRC
This publication could be one of several versions: author’s original, accepted manuscript or the publisher’s version. / La version de cette publication peut être l’une des suivantes : la version prépublication de l’auteur, la version acceptée du manuscrit ou la version de l’éditeur.
Access and use of this website and the material on it are subject to the Terms and Conditions set forth at
Reliability-based decision support tool for life cycle design and
management of highway bridge decks
http://irc.nrc-cnrc.gc.ca
R e l i a b i l i t y - b a s e d d e c i s i o n s u p p o r t t o o l f o r
l i f e c y c l e d e s i g n a n d m a n a g e m e n t o f h i g h w a y
b r i d g e d e c k s
N R C C - 5 0 4 4 8
L o u n i s , Z . ; D a i g l e , L .
2008-10-07
A version of this document is published in / Une version de ce document se trouve dans:
Annual Conference of the Transportation Association of Canada (TAC), Toronto, Ontario, September 21-24, 2008, pp. 1-19
The material in this document is covered by the provisions of the Copyright Act, by Canadian laws, policies, regulations and international agreements. Such provisions serve to identify the information source and, in specific instances, to prohibit reproduction of materials without written permission. For more information visit http://laws.justice.gc.ca/en/showtdm/cs/C-42
Les renseignements dans ce document sont protégés par la Loi sur le droit d'auteur, par les lois, les politiques et les règlements du Canada et des accords internationaux. Ces dispositions permettent d'identifier la source de l'information et, dans certains cas, d'interdire la copie de documents sans permission écrite. Pour obtenir de plus amples renseignements : http://lois.justice.gc.ca/fr/showtdm/cs/C-42
Reliability-Based Decision Support Tool for Life Cycle
Design and Management of Highway Bridge Decks
Zoubir Lounis, Ph.D., P.Eng. Lyne Daigle, M.Sc., P.Eng.
Institute for Research in Construction (IRC) National Research Council Canada (NRC)
Paper prepared for presentation
at the “Bridges – Links to a Sustainable Future” Session of the 2008 Annual Conference of the
Transportation Association of Canada Toronto, Ontario
Abstract
A considerable percentage of highway bridges in North America is in a structurally/functionally deficient state due to aging, aggressive environment and increased traffic load and volume. The consequences of this deficiency are numerous, including reduced safety, serviceability and service life, which lead to increased risk of injuries and fatalities; and increased maintenance costs and user costs. Reliable
predictions of life cycle performance are critical to the optimization of their design and maintenance that will lead to reduced risks of failure and life cycle costs.
This paper provides an overview of the reliability-based life cycle performance and life cycle cost analysis models developed at NRC-IRC. These models can be used to predict the service life and cost of highway bridge decks built in corrosive environments. The service life prediction models predict the time dependent probability of damage initiation and accumulation in bridge decks, from chloride ingress to spalling and/or delamination of the concrete cover. The life cycle cost analysis model provides predictions of the total costs incurred over the life cycles of bridge decks, which include the costs of design, construction, maintenance and repair activities, as well as user costs. These models have been integrated into a decision support software tool called “SLAB-D”. A case study outlines the main capabilities of the models and decision support tool for the life cycle-based design and management of bridge decks. This tool can be used to help bridge designers and managers quantify and visualize how changes to the bridge deck design and maintenance will affect its service life and life cycle cost.
Keywords: highway bridge decks, life cycle management, reliability, service life, life cycle costs
1. Introduction
The reinforced concrete (RC) deck slab-on-girder system is one of the most common bridge superstructure systems in North America. Deck slabs provide a smooth riding surface and transfer the truck load to the girders and diaphragms. They are directly exposed to traffic and to the aggressive effects of the environment and hence are the most deteriorated elements of the highway bridge network. This extensive deterioration is mainly caused by chloride-induced corrosion of the reinforcement. The primary source of chlorides derives from deicing salts applied to roadways and bridges during winter. Given this predominant deterioration mechanism, most RC bridge deck failures are due to loss of serviceability and functionality and not loss of strength and collapse. It is estimated that about one-third to one-half of all bridge rehabilitation costs in North America are related to bridge deck deterioration [1,2].
The selection of an optimal design or rehabilitation alternative for a concrete bridge deck requires a reliable estimate of the owner and users costs that will be incurred throughout its life cycle. The evaluation of the life cycle cost requires a reliable prediction of the life cycle performance of the deck including the service life of for all competing design and rehabilitation alternatives. Existing deterministic service life prediction models cannot consider explicitly the uncertainty associated with the values of governing parameters (depth of the concrete cover, chloride diffusivity into concrete, chloride concentration at the surface, chloride threshold level for corrosion) as well as the uncertainty associated with the physical models. As a result, they cannot capture the variability in the times at which the deck starts deteriorating and reaches different thresholds of damage.
Recognizing the limitations of the deterministic methods, the development of a more reliable service life
prediction model that includes uncertainty of all parameters that affect the deck performance was the
primary objective of a comprehensive NRC-IRC led research project. The second objective was to integrate service life prediction and life cycle costing models into user-friendly software, referred to as “SLAB-D”, for the life cycle analysis of concrete bridge decks. The concepts, models and decision support tools developed to predict service life and estimate life cycle cost of bridge decks are presented hereafter.
A case study is included to illustrate the main features and capabilities of the predictive models and software.
2. Quantitative Service Life Prediction Models
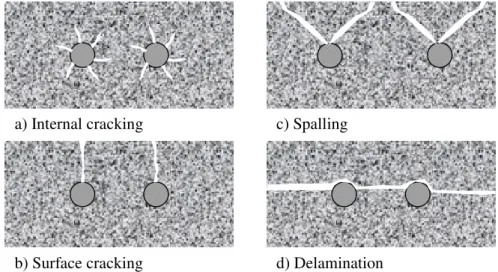
Highway bridge decks slabs are directly exposed to chlorides from deicing salts, which penetrate the concrete cover and initiate corrosion of the reinforcing steel, once their concentration reaches a threshold level. The corrosion of the reinforcing steel leads to the formation of corrosion products, which is accompanied by an increase in volume. This volume increase induces tensile and compressive stresses in the concrete cover. Once the maximum tensile stress reaches the tensile strength of concrete, internal cracks are initiated at the steel/concrete interface (Fig. 1-a). After the accumulation of additional corrosion products, the cracks start to propagate. Depending on the design of the deck, the cracks may propagate in three different ways: i) vertically until they reach the deck surface, thus leading to the formation of longitudinal cracks (Fig. 1-b), ii) at an angle (about 45°) that lead to the spalling of the cover (Fig. 1-c) and, iii) horizontally leading to the delamination of the cover (Fig. 1-d). As proposed by Tuutti [3], the service life of concrete structures built in a corrosive environment is modeled as a two-period process (Fig. 2) and is expressed as follows:
p i
L t t
t = + (1)
The service life (
t
L) is defined as the time it takes for the concrete deck to degrade to a condition state thatreaches a critical level of serviceability that can be defined as the minimum performance level. Based on the AASHTO guide [4], the condition state description of RC deck slabs refer to the evaluation of the percentage of deck area that is spalled or delaminated. On a scale of 1 to 5, condition state 1 corresponds to a deck with a surface in excellent condition and condition state 5 is described as a deck presenting a combined area of distress (spall + delamination + patches) of more than 50%. The prescribed minimum level of serviceability is set by
bridge owners based on their rehabilitation and maintenance policies. The corrosion initiation time (ti) is the
period during which chlorides penetrate and contaminate the concrete. The reinforcing steel remains in a passive state for a relatively long period of time. Once the chloride ions reach the reinforcing steel and accumulate
beyond the threshold chloride content, the corrosion of steel is initiated. The corrosion propagation (tp) is the
period during which the corrosion products accumulate and induce increasing tensile stresses in the concrete cover, which lead to the deterioration of the concrete cover as illustrated in Fig. 1.
The developed service life models can predict the time it takes to reach anyone of the following six limit states: 1) Critical chloride contamination of the deck
2) Corrosion initiation
3) Onset of internal cracking at the steel/concrete interface 4) Onset of surface cracking
5) Onset of spalling 6) Onset of delamination
a) Internal cracking
b) Surface cracking
c) Spalling
d) Delamination
Fig. 1. Schematic presentation of corrosion-induced failure modes of RC bridge deck slabs.
Dam age Time (years) Chloride contamination Corrosion Internal cracking Failure Spalling/ Delamination Service life (tL)
Initiation period (ti) Propagation period (tp) Surface
cracking
Fig. 2. Service life of reinforced concrete bridge deck slabs.
2.1
Chloride contamination and corrosion initiation
Crank's solution [5] of Fick's second law of diffusion is used to predict the chloride ingress into the concrete cover, which is given by:
( )
⎥ ⎥ ⎦ ⎤ ⎢ ⎢ ⎣ ⎡ ⎟ ⎟ ⎠ ⎞ ⎜ ⎜ ⎝ ⎛ − = t D x erf C t x C c s 2 1 , (2)where C (x,t) = chloride concentration at depth x after time t
Cs = chloride concentration at the deck surface
Dc = coefficient of diffusion of chloride ions into concrete
erf = error function
In this chloride contamination model, both the diffusion coefficient Dc and the surface concentration Cs
assumptions and real case situations where Cs and Dc vary with time and space, “apparent” values of
surface chloride concentration and diffusion coefficient are used.
The surface chloride concentration varies with time and with the drying and wetting cycles of the concrete deck surface. At a shallow depth, the chloride concentration reaches a maximum value that can be assumed quasi-constant after an initial exposure time [2]. This value is referred to as the "apparent" surface chloride concentration. It is generally obtained from regression analysis as the best fit of Crank's equation to the chloride profiles obtain from field data. Weyers et al. [2] graded the severity of the corrosive environments to which bridge decks are exposed into four categories and provided the corresponding range of values and mean value of the apparent surface chloride concentration.
The rate of chloride diffusion in concrete, usually measured by the chloride diffusion coefficient, depends on many other concrete properties (water-to-cement ratio, temperature, cement type, age, moisture, etc.). An apparent value of the chloride diffusion coefficient can be obtained in the field from cored concrete
samples of the investigated deck. A regression analysis is performed to best fit the chloride profiles
measured from these cores with Crank's equation. The apparent diffusion coefficient thus obtained implicitly includes the effects of the influencing parameters mentioned above and can vary with time, especially during the first 5-10 years after the deck construction or if the environmental conditions change. Chloride diffusion coefficients found in the literature are measured in the laboratory (standard ambient temperature), in outdoor testing conditions or are taken from field measurements. Their values can vary by more than one order of magnitude due to the diversity of the mixes tested and difference in ages, curing and testing conditions. The two variables recognized to have the most influence on the coefficient of diffusion are the water-cement ratio and the presence of supplementary cementing materials [2, 6, 7]. Since chloride profile measurements of the deck under analysis are not always possible or economical, databases of chloride diffusion coefficient values have been generated to help in the selection of an appropriate apparent chloride coefficient of diffusion and implemented in “SLAB-D” software [8]. Depending on the testing conditions of the coefficients selected from the databases, temperature and/or time correction(s) may be needed. The correction factors are assumed to be independent and are applied to the coefficient of diffusion as follows:
Dccor = Dc (Tcf)(tcf) (3)
where Dccor = corrected apparent chloride diffusion coefficient
Dc = apparent chloride diffusion coefficient from the database
Tcf = temperature correction factor
tcf= time correction factor
If the time or temperature correction is not applied, the corresponding correction factor is set to 1. The temperature correction factor is dependent on the bridge location and should be applied to coefficients of diffusion that were measured in a laboratory at room temperature. Temperature correction factors were derived for different cities across Canada as function of the water-to-cementitious materials ratio (w/cm). Time correction can be applied to account for the dependence of the chloride diffusion coefficient on the time of exposure, especially if the reference value taken for chloride coefficient of diffusion was measured after a short exposure time. The time correction factor is determined as follows [9, 10, 11]:
tcf = (tref/t)m (4)
where tcf= time correction factor
tref = reference time (exposure time of reference value from database)
t = exposure time (of deck under analysis)
The age reduction factor is taken from a review of published data for different concrete mixes [9].
When chlorides penetrate the concrete deck slab, they eventually reach the top reinforcing steel. Although the steel is initially protected by a thin passive film, as the chloride concentration increases with time, it will lead to a break down of this protective passive film and initiate corrosion of the reinforcing steel. The
amount of chlorides that initiates corrosion is known as the threshold chloride concentration or level (Cth).
To predict the time of corrosion initiation (ti), the chloride concentration is set equal to the chloride
threshold value Cth at which corrosion initiation is expected to occur, and the variable x (the depth from
the surface) is set equal to the effective cover depth of the reinforcing steel, c. Equation (2) becomes:
2 1 2 1 4 ⎥ ⎥ ⎦ ⎤ ⎢ ⎢ ⎣ ⎡ ⎟⎟ ⎠ ⎞ ⎜⎜ ⎝ ⎛ − = − s th c i C C erf D c t (5)
The values of chloride threshold content proposed in the literature cover a wide range and depend on several parameters. The factors that affect the threshold chloride concentration include [12]:
Condition of the steel/concrete interface (type of reinforcing steel, presence of corrosion inhibitors) Properties of concrete
Exposure conditions (source and type of chloride contamination, temperature, moisture content)
The threshold chloride content typically used in North America is 0.6 kg/m3 to 0.9 kg/m3 or 0.17% to
0.26% of cementitious material weight. However, a wider range of chloride threshold values, expressed as total chlorides, is reported in the literature for different testing conditions. SLAB-D on-line help gives reference values of threshold chloride for different types of reinforcing steel and for cases where a corrosion inhibitor is used.
2.2 Corrosion-induced damage
The corrosion propagation time (tp) is the time required, after the onset of corrosion, to induce high tensile
stresses in the concrete cover, which lead to its fracture through internal cracks, surface cracks, delamination and spalling. It is given by the following equation:
( )
⎥ ⎦ ⎤ ⎢ ⎣ ⎡ − Δ = s r r p Sj d d tρ
α
ρ
π
1 2 (6)where Δd = increase in rebar diameter due to corrosion build-up
d = rebar diameter
S = rebar spacing
ρs = density of steel
ρr = density of corrosion product
α = molecular weight ratio of metal iron to the corrosion product
jr = rate of rust production per unit area
In SLAB-D, the default values for ρs, ρr, and αare assumed equal to 7860 kg/m3, 3600 kg/m3 (for Fe(OH)3
calculated based on Andrade and Alonso [14] relationship between the rate of radius loss and corrosion
rate, a user input data given in μA/cm2
.
Assuming that concrete is a homogeneous elastic material with a tensile strength f’t and that rust products
are equally distributed around the perimeter of the reinforcing bars [13], stresses generated in the concrete deck by corrosion built-up products are estimated based on the thick-wall cylinder model [15] (Fig. 3).
This model allows the calculation of the rebar diameter increase (Δd) related to the different
corrosion-induced damage limit states and associated propagation time with equation (6). Complete development of the thick-wall cylinder equations as applied to the different stages of reinforced concrete deterioration is presented in Lounis et al. [16].
Corrosion products
σ
r+d
σ
rσ
rσ
tσ
tσ
t =f’ta)
b)
Fig. 3. Thick-wall cylinder model of corroding RC deck: a) Tensile stresses developed at crack initiation, b) Propagation of internal cracks in thick-wall concrete cylinder (adapted from [16]).
3. Reliability-Based Service Life Analysis
A concrete bridge deck is a structure with a heterogeneous material having variable properties (permeability, diffusion coefficient, chloride threshold level, strength), variable dimensions (concrete cover, bar spacing), and is exposed to a variable corrosive environment (chloride concentration on the deck surface from de-icing salts). The reliability-based service life analysis includes this variability and uncertainty in the prediction of the time to reach the different limit states. The parameters that describe the different mechanisms of deterioration of RC decks and known to possibly have a considerable level of variability [1,2] are modeled as random variables described by an average value and its associated coefficient of variation (COV) that characterizes the level of dispersion of the parameter.
For illustration purposes, consider the example of the limit state of corrosion initiation of reinforcing steel.
If after a reference period of time, the mean value of chloride concentration at the steel level (Cst), is found
lower than the mean value of chloride threshold level (Cth), as shown in Fig. 4, the deterministic model
predicts no corrosion (the steel is in the passive state). In actual field conditions, after the measurements of chloride concentrations at the steel from several samples taken randomly over the bridge deck, it is found that a number of samples have chloride concentrations that are either higher or lower than the mean value as illustrated by the frequency distribution or probability density function (pdf) of the chloride concentration shown in Fig. 4. Similarly, the threshold chloride concentration has also a scattered distribution with a pdf as shown in Fig. 4. The probability of corrosion is given by the shaded area (Fig.
4), where Cst > Cth. The extent of corrosion initiation is neither zero nor 100%, as predicted by the
deterministic models, but is equal to a finite value, which starts at zero at the beginning of the chloride ingress stage and increases with time to ultimately reach 100%. Therefore, at a given time in the service
F re q u e n c y Probability of corrosion initiation: Pcor Cst, Cth Mean Cst Mean Cth pdf of Cst pdf of Cth F re q u e n c y Probability of corrosion initiation: Pcor Cst, Cth Mean Cst Mean Cth pdf of Cst pdf of Cth
Fig. 4. Deterministic vs. probabilistic predictions of corrosion initiation in RC decks.
life of an RC deck, corrosion will be started on a certain percentage of the total reinforcing steel while the remaining percentage will be in the passive state. Similarly, for a given period of time, a certain proportion of the deck surface will have cracks, and/or delaminations, and/or spalls, and the remaining proportion of the deck surface will be damage-free.
The chloride contamination and corrosion-induced deterioration stages of reinforced concrete deck are modeled using the limit state formulation. The limit state of a system is reached when the load (S) is equal to the resistance (R). The adequate performance of such a system is achieved when R>S and inversely, R<S would indicate its failure. Referring to the reliability-based approach and the example presented previously, the term “resistance” refers to the chloride threshold and the term “load” refers to the chloride concentration at steel level. The failure is the event of chloride concentration at steel level exceeding the
chloride threshold. The probability of failure (Pf) is the probability that the load is greater than the
resistance (Pf=P[S>R]) at a given time. All deterioration stages have been formulated using this
load-resistance approach where the values of both S and R are functions of several variables. In the corrosion propagation stages, the load or “load effect” is defined as the stresses induced by corrosion build-up products (Fig. 3) that lead to cracking, spalling and delamination. The resistance refers to the resistance of the concrete cover to a level of tensile stresses that would cause cracking, spalling and delamination.
4. Life Cycle Cost Analysis Model
The developed life cycle cost analysis (LCCA) model enables to compare the economic performance of different bridge deck alternatives that meet the same requirements and fulfill the same objectives over a common analysis period or life cycle. This model includes all agency and users costs incurred during design, construction, maintenance and rehabilitation/replacement activities (MR&R) over the entire deck life cycle and is implemented in the SLAB-D software.
4.1 Present value approach
The LCCA model is based on the concept of “the time value of money”. Costs occurring at different points in time during the life cycle are converted to their equivalent present value by a process known as discounting as follows:
t
r
F
P
)
1
(
+
=
(7)where P = present value of an expense occurring in (t) years
F = future cost (express in constant dollars)
r = discount rate
The resulting or total cost of a bridge deck alternative is known as the Present Value Life Cycle Cost (PVLCC) and it is used to compare two or more alternative designs. The PVLCC of a bridge deck is given by:
s MRRU MRRA PV PV PV C PVLCC= 0+ + − Re (8)
where C0 = Construction cost
PVMRRA = Present value of all MR&R activities agency costs
PVMRRU = Present value of all MR&R activities user costs
PVRes = Present residual value
and, ( )
(
)
(
)
(
)
.... 1 1 1 3 3 2 2 1 1 + + + + + + = t t t U or A MRR r C r C r C PV (9)where Cx = Cost of a single occurrence of a MR&R activity (agency and/or user cost)
r = Discount rate (assumed to be constant within analysis time)
tx = Time of activity occurrence, t is smaller or equal to analysis period (life cycle)
Costs of all occurrences of all defined activities are summed up. The costs of MR&R activities are expressed in today’s dollar value. The discount rate (r) represents an estimate of the average rate of return on private investment, before taxes and after inflation. As stated before, all deck alternatives are compared on the same analysis time regardless of their possibly different predicted service lives. The service life of one alternative may be shorter than the analysis time and, for this case, rehabilitation or replacement activity must be scheduled to extend the service life to cover or extend beyond the analysis period. If the deck service life extends beyond the analysis period, it will have a residual service life equal to the
difference between the service life of the deck and the analysis period. The residual value (VRes),
sometimes called “salvage value”, is calculated based on the value of the remaining service life (residual
life) and converted to present value (PVRes) using Eq. 6. The present residual value is subtracted form the
PVLCC since it is considered as a remaining benefit for the agency at the end of the analysis period as opposed to a cost.
4.2 Costs
The categories of costs considered have a great impact on the results of the economic analysis. Over the life cycle of a bridge deck, different types of costs are incurred. These costs can be classified according to their time of incurrence or according to the entity that incurs them. In SLAB-D, the latter approach was chosen and both agency and user costs are considered.
Agency/Direct costs
Agency costs are the costs associated with the design, construction, inspection, routine maintenance, repair, rehabilitation, and replacement of a given bridge deck. They consist primarily of the in-place costs
of materials and labor for the different actions performed on a bridge deck within its life cycle. These are tangible costs measurable with monetary values [17]. The design cost includes the costs of all studies, environmental and other reviews, and consultant contracts prior to solicitation of construction bids for a new bridge deck or major rehabilitation of an existing bridge deck. The construction costs include the administrative and contract costs of the deck and ancillary facilities such as approach slabs. Unit costs and bills of quantities are the most widely used basis for developing construction costs estimates [17].
The inspection, maintenance, repair and rehabilitation costs include: Costs of routine (visual) inspections of the bridge deck;
Costs of periodic or special inspections using non-destructive and semi-destructive evaluation (NDE) methods such as the techniques of half-cell potential, radar, chloride content analysis; Costs of routine maintenance, which include the costs of asphalt overlays with or without
membranes, crack sealing, minor patch repairs, deck washing, and maintenance of drainage and deck joints;
Patch repair and rehabilitation costs refer to the costs of major patch repairs and concrete overlays of decks using latex modified concrete, low-slum dense concrete, or microsilica concrete. These costs include the costs of removal of spalled, delaminated and critically chloride contaminated concrete; and
Replacement cost includes the cost of demolition and removal in addition to costs similar to the costs discussed above, i.e. costs of design and construction.
User/Indirect costs
User costs are those costs associated with traffic disruption due to inspection, maintenance, repair, rehabilitation, and replacement of the bridge deck. For bridges carrying a high volume of traffic, the user costs might be substantially larger than agency costs. User costs include the travel delay costs, vehicle-operating costs (VOC) and accident/crash costs [17, 18, 19]. The user costs increase with increasing traffic volume and increasing duration and disruption of the maintenance or rehabilitation activity. In SLAB-D, the economic analysis can be performed with or without the user costs. When included, the user costs are presented separately from the agency costs. The user cost model used is based on the methodology of CALTRANS [18].
Travel delay costs are the costs imposed on bridge users due to temporary closures of bridge lane(s) for a MR&R activity that causes traffic congestion. Delay costs are calculated using:
(
)
(
)
[
truck]
delay auto delay MRR n a C ADTT C ADTT ADT t S L S L TDC =( − ) − + (10)where TDC = travel delay costs
L= length of affected roadway on which vehicles drive
Sa= traffic speed during MRR activity
Sn = normal traffic speed
ADT =average daily traffic (number of vehicle per day, including trucks)
ADTT = average daily truck traffic
tMRR= duration of MRR activity;
Cdelay= hourly time value of drivers (automobile or truck)
The vehicle operating costs are the costs incurred by vehicle drivers crossing a bridge that is affected by a given MR&R activity. These costs include accelerated vehicle depreciation, increased vehicle repair costs, increased fuel consumption, and increased tire wear.
VOC MRR n a C t ) ADT )( S L S L ( VOC= − (11)
where VOC=vehicle operating costs
CVOC = hourly vehicle operating cost
Accident or crash costs are those costs incurred due to an increase in the accident rate during MR&R activities on bridge decks. The user costs reflect the loss of life, injuries, and damage to property. Such costs may be quite high and depend primarily on the traffic volume and the increase in the accident rate induced by the work on the bridge deck. This cost can be estimated as follows [17, 18, 19, 20]:
ACC MRR n a A )t C A )( ADT ( L AC = − (12)
where AC= accident costs
Aa=accident rate during MR&R activities (in number of accidents/million vehicles.km)
An= normal accident rate (per million vehicles.km)
CACC =average cost per accident
The statistics collected by the insurance industry and accident rates maintained by the provincial transportation agencies, police departments, and national agencies may be used to extract data on accident
rates and costs. Reference values for CVOCand Cdelay can be found in [19, 20].
Delay costs and vehicle operating costs can also be due to poor condition of the driving surface of the bridge deck and not be associated to a particular MR&R activity event. These costs are on-going user costs that start when the bridge deck condition reaches a critical state and usually degrades with time until some repair, rehabilitation or replacement activity takes place. LCCA module of SLAB-D does not include this type of user costs.
5. Case Study - Life Cycle-Based Design of Bridge Deck Replacement
In the following case study, a comparison of life cycle designs for the replacement of a damaged bridge deck is carried out. Although many design alternatives could be compared (different cover depth, different rebar material, etc.), two alternatives based on a different concrete mix were chosen for simplicity. 5.1 Service Life Prediction
The first alternative is to replace the bridge deck using normal performance concrete (NPC) with a water/cement ratio of 0.4 and a 28-day compressive strength of 30 MPa. The reinforcement consists of #10M conventional black steel rebars with a yield strength of 400 MPa. The second rehabilitation alternative is to use high performance concrete (HPC) containing 25% of fly ash with a 28-day compressive strength of 45 MPa. Dimensions and traffic data (Table 1) are similar to those of a highway bridge located on A-20 over Henri River in the municipality of Val-Alain in Québec [21, 22, 23]. The data for the service life parameters of both replacement alternatives are given in Table 2.
Table 1. General information on investigated highway bridge.
Bridge width 12.57 m
Bridge length 47.5 m
Deck thickness 225 mm
Isotropic reinforcement percentage for both mats 0.3%
Annual Average Daily Traffic (AADT) 22000
Annual Average Daily Truck Traffic (AADTT) 4500
Normal traffic speed (km/hr) 100
Table 2. Service life parameters.
Parameter Mean value COV* (%)
Concrete cover depth (mm) Bar spacing (mm) Bar diameter (mm) 70 150 9.5 25 5 -
Surface chloride content (kg/m3)
Chloride (apparent) coefficient of
diffusion (cm2/year) - NPC
Chloride (apparent) coefficient of
diffusion (cm2/year) – HPC
Threshold chloride content (kg/m3)
6 0.40 0.20 0.70 25 25 25 20
Corrosion rate (μA/cm2
) 0.5 20
*
COV = coefficient of variation
The mean value of the first three parameters in Table 2 are taken from the construction specifications and variations can be estimated based on the quality control of workmanship. The surface chloride content is assumed to be taken from chloride profile measurements performed on the old deck. The chloride diffusion coefficients are estimated using reference values and correction factors [8]. For NPC with a
w/cm ratio of 0.4, a chloride diffusion coefficient of 0.4 cm2/year is found in the database, typical values
vary between 0.3 and 0.5 cm2/year after the correction for time exposure is applied (COV of 25%).
Temperature correction is not necessary since testing conditions of the coefficient selected from the database (-15°C to 25°C) approximate temperature variations experienced in Canada. The same approach is used to estimate the coefficient of diffusion and associated COV of HPC. The chloride threshold is
taken as 0.70 kg/m3 with a COV of 20%. If different types of top steel reinforcement were used, different
threshold chloride values would be used for each type of steel.
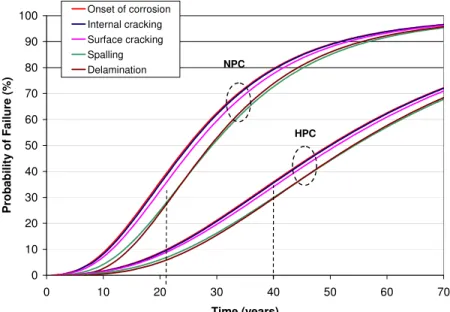
Figure 5 presents the time-dependent probability of failure associated to the five limit states (corrosion initiation, onset of internal, onset of surface cracking, spalling and delamination) for both alternatives as calculated the developed reliability-based models. A 30% probability of failure due to spalling is reached after 22 years for the NPC deck and after 40 years for the HPC deck, which in this case study is considered to be the end of service life. In the SLP module, parameters and COV included in Table 2 can easily be modified (user-input) to analyze their influence on the service life and improve the alternatives design. SLAB-D allows the comparison of up to five different design alternatives at the same time and can also perform deterministic service life analyzes where the predicted times to reach the different limit states
represent average values for each alternative. To include the effect of construction, material and environment variability in a deterministic service life analysis, a sensitivity analysis can be performed on each of the governing parameters as shown in Fig. 6. As an Example, the variation of concrete cover depth from 50 to 80 mm increases the time to onset of corrosion from 12 to 32 years, respectively, for the NPC alternative. 0 10 20 30 40 50 60 70 80 90 100 0 10 20 30 40 50 60 70 Time (years) Probability of Failure (%) Onset of corrosion Internal cracking Surface cracking Spalling Delamination NPC HPC
Fig. 5. Reliability-based service life predictions of NPC and HPC bridge decks.
Time to Failure (years)
Cover Depth (mm) Onset of corrosion
5.2 Life Cycle Cost Analysis
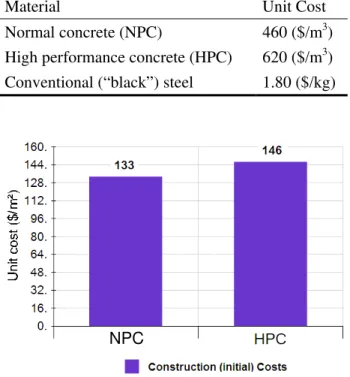
The analysis time period (or life cycle) is taken as 40 years and the discount rate used is 3%. The components of the initial construction costs (in-place costs for the steel and concrete mixes) of the two alternatives are listed in Table 3. Additional construction costs are not specified for the two alternatives as they are considered to be approximately the same.
Table 3. In-place costs of materials.
Material Unit Cost
Normal concrete (NPC) 460 ($/m3)
High performance concrete (HPC) 620 ($/m3)
Conventional (“black”) steel 1.80 ($/kg)
NPC
Fig.7. Initial agency costs of the two bridge deck alternatives.
As expected, on the basis of the initial construction costs only, the use of NPC with conventional steel is a
more cost-effective alternative ($133/m2) than the HPC deck ($146/m2). Figure 8 summarizes the timing
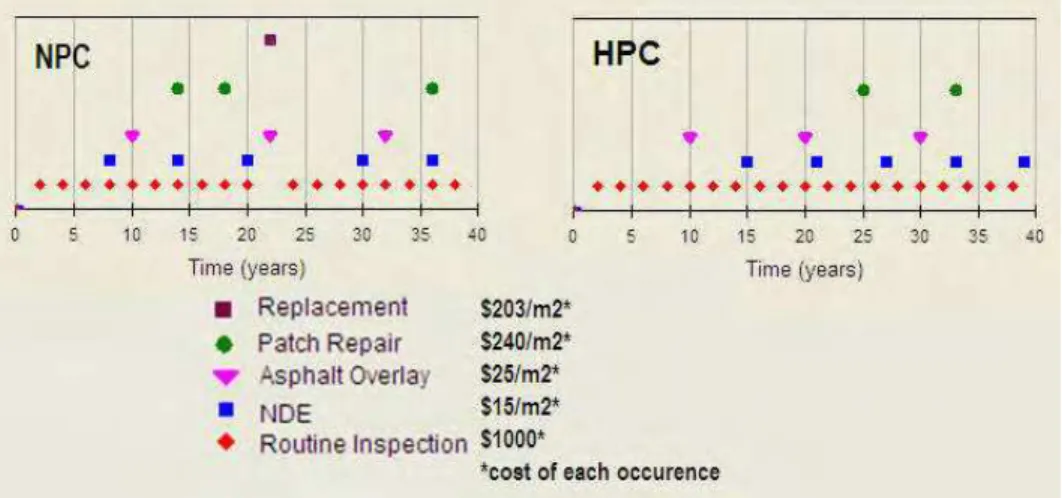
and costs of the different MR&R activities of both alternatives. The cost and time data presented in this example are taken from various sources [2, 17,19, 24, 25] or assumed. The cost of the patch repairs includes:
Cost of removing the contaminated or deteriorated concrete Cost of concrete patching
Cost of traffic control when the bridge is partially opened to traffic
In this case study, patch repairs are made when the probability of spalling reaches 10% and 20% and that the end of life criterion is defined as the time to reach a 30% probability of spalling. Times corresponding to these probabilities are predicted using the reliability-based service life models [16] (Fig. 5) for both alternatives. It is assumed that after 22 years, the damaged NPC deck is replaced with a similar type of deck (i.e. normal concrete with black steel reinforcement in both top and bottom mats). The replacement cost includes the initial construction cost and the costs of demolition and disposal that were assumed equal
to $70/m2. Since the end of life of the HPC deck is equal to the analysis period, its replacement is not
included in the life cycle cost analysis (LCCA). At the end of the analysis period, the HPC alternative will have no residual service life or value. For the NPC alternative, the schedules of MR&R activities for the replacement deck (year 22 and after) are similar to those of the initial deck construction (up to year 22).
Users costs are included in the analysis after the estimated values of the duration of each (MR&R) activity (average for both ways), the length of affected road during the activity (average for both ways), and the reduced traffic speed during the activity (Table 4) are used. These values are considered to be the same for both deck alternatives except for the replacement that is only affecting the NPC deck. The different unit or hourly user costs as well as traffic information are shown in figure 9. Accident costs and the normal accident rate are taken from statistics published by Transport Canada and Statistics Canada [26, 27, 28]. Considering the lack of statistical data on accident in work zones, a rule of thumb of three times the normal accident rates is used as suggested by Walls and Smith [20]. Details on user cost estimation are found in Daigle and Lounis [29].
Fig. 8. Costs and schedule of inspection and repair activities for NPC and HPC decks over 40 years.
Table 4. Data related to user cost calculation.
Activities Duration (days) Length affected (km) Traffic speed reduced to (km/hr) Routine inspection 0.35 0.1 80 Detailed inspection (potential survey ) 0.5 0.5 50 Asphalt overlay 1.5 1 40 Patch repair 2.5 1 30 Replacement 15 1 30
Based on the PVLCC [Eq. 7], the HPC deck alternative is 25% more cost-effective than the NPC deck alternative when the comparison is made considering the agency costs (Fig. 10). In terms of user costs, the PVLCC of the HPC deck alternative represent only a fraction (37%) of the users costs associated with the NPC deck alternative (Fig. 11). The replacement of the NPC deck after 22 years of the 40-year analysis period accounts for 50% of the estimated user costs. The remaining difference between the two alternatives is associated with the earlier and more frequent patch repairs of the NPC deck. The HPC deck alternative incurs lower life cycle agency and user costs than the normal concrete deck alternative. Hence, based on the information data of the presented case study, the HPC deck alternative is more cost-effective than the NPC deck alternative in terms of life cycle agency costs and user costs.
Fig.9. Traffic information, unit user costs and accident rates.
NPC
5.3 Sensitivity Analysis
The LCCA module of SLAB-D includes a sensitivity analysis function that can be applied to practically all the parameters used in the LCCA where the effect of the varying parameter on either the agency costs or the users costs can be displayed. Based on the case study data, figure 11-a) shows the effect of the discount rate variation (from 2% to 6%) on the present value agency costs. Even with a discount rate of 6%, the HPC alternative is more cost-effective than the NPC alternative, although the difference between the two has been reduced. The effect of the variation of the accident rate during MR&R activities on the users costs is illustrated in figure 11-b. A reduction of the MRR accident rate to 2.5/million vehicles·km compared to an initial value of 6/million vehicles·km, generates a reduction of 33% of the user costs for both deck alternatives.
a)
b)
Fig. 11. LCCA Sensitivity analyses: a) Influence of discount rate on agency costs; b) Influence of accident rate during MRR on Users Costs.
6. Conclusions
In order to select the most cost-effective strategy for maintenance and design of concrete bridge decks, owners must predict the service life and total life-cycle costs of bridge decks. The developed service life prediction models offer unique capabilities in the reliability-based prediction of life cycle performance and cost of concrete bridge deck.
The multi-stage physical models of concrete deterioration, due to corrosion, provide a complete analysis of the deck service life from the onset of chloride ingress to the deck spalling or delamination. The uncertainty of the key parameters being considered, the resulting service life predictions are presented for each deterioration stages or limit states as time-dependent probabilities. These time-dependent probabilities reflect better the actual condition of concrete decks that do not uniformly deteriorate with time due to the variable properties of its heterogeneous materials, variable dimensions and variable corrosive environment.
The life cycle cost analysis model is a convenient tool for comparing life cycle costs of different deck design or maintenance alternatives. Users costs are presented separately from agency costs as they tend to have a more significant influence than in the past in the decision-making process. The integration of the service life prediction and life cycle cost analysis models into SLAB-D software provides bridge owners
with a reliable and effective decision support tool for the selection of cost-effective options for the design and rehabilitation of bridge decks.
7. Acknowledgments
The authors would like to acknowledge the financial contribution to this project of the following partners: Alberta Infrastructure and Transportation
Cement Association Of Canada City of Hamilton
City of Ottawa City of Winnipeg
Engineered Management Systems Inc. Federal Bridge Corporation Ltd.
Manitoba Department of Transportation and Government Services Ministère des transports du Québec
Nova Scotia Department of Transportation and Public Works Public Works and Government Services Canada
Region of Durham
8. References
1. Lounis, Z., and Mirza, M. S. 2001. Reliability-based service life prediction of deteriorating concrete structures. Proceedings of the Third International Conference on Concrete Under Severe Conditions, Vancouver, 965-972.
2. Weyers, R. E., Fitch, M. G., Larsen, E. P., Al-Qadi, I. L., Chamberlain, W. P., and Hoffman, P. C. 1994. Concrete Bridge Protection and Rehabilitation: Chemical and Physical Techniques - Service Life Estimates. SHRP-S-668, Strategic Highway Research Program, National Research Council. 3. Tuutti, K. 1982. Corrosion of Steel in Concrete. Swedish Cement and Concrete Research Institute,
Stockholm, Sweden, 469 p.
4. AASHTO 1998 (Rev. 2002). Guide for Commonly Recognized Structural Elements. American Association of State Highway and Transportation Officials, 54 p.
5. Crank, J. 1975. The Mathematics of Diffusion (2nd ed.), Oxford University Press, London, 414 pp.
6. Tang, L, and Nilsson, L.-O. 1992. Chloride Diffusivity in High Strength Concrete at Different Ages. Nordic Concrete Research, Pub. No. 11 (1), 162-171.
7. Pedersen, V,. and Arntsen, B. 1998. Effect of Early-age Curing on Penetration of Chloride Ions
Into Concrete in the Tidal Zone. Proc. of the 2nd Intl. Conf. on Concrete under Severe Conditions,
CONSEC ’98, Tromso, Norway, June 21-24, 468-477.
8. Daigle, L. and Lounis, Z. 2006. SLAB-D: Version 1.0: User’s manual: Service Life Analysis of Bridge Decks. NRC Client Report B5318.3, 119 p.
9. Bamforth, P.B. 1998. Spreadsheet model for reinforcement corrosion in structures exposed to chlorides. in Concrete under Severe Conditions 2: Environment and Loading (Vol. 1), O.E. Gjørv, K. Sakai and N. Banthia (eds.), E & FN Spon, London, 64-75.
10. Maage, M., Helland, S., Poulsen, E., Vennesland, Ø., and Carlsen, J.E. 1996. Service life prediction of existing concrete structures exposed to marine environment. ACI Materials Journal, 93(6), 602-608.
11. Mangat, P.S., and Molloy, B.T. 1994. Prediction of long term chloride concentration in concrete. Materials and Structures, 27, 338-346.
12. Glass, K., and Buenfeld, N.R. 1995. Chloride threshold levels for corrosion induced deterioration of steel in concrete. Chloride Penetration into Concrete, L.-O. Nilsson and J.P. Ollivier (eds.), 429-440.
13. Bažant, Z.P. 1979. Physical model for steel corrosion in concrete sea structures – theory. Journal of the Structural Division, Vol. 105(ST6), 1137-1153.
14. Andrade C. and Alonso C. 2001. On-site measurements of corrosion rate of reinforcements. Construction and Building Materials, 15(2-3), 141-145.
15. Timoshenko, S.P. 1956. Strength of Materials. Part II: Advanced Theory and Problems, Princeton, NJ.
16. Lounis, Z., Martin-Perez, B., Daigle, L., Zhang, J. 2006. Decision Support Tools for Service Life Prediction and Rehabilitation of Concrete Bridge Decks - Final Report, Institute for Research in Construction, National Research Council Canada (B5318.2), 260 p.
17. Hawk, H. 2003. Bridge Life-Cycle Cost Analysis. NCHRP Report 483, Transportation Research Board.
18. Golabi, K., Thompson, P.D., and Hyman, W.A. 1993. Pontis- Version 2.0: Technical Manual: A Network Optimization System for Bridge Improvement and Maintenance. Report FHWA-SA-93-031, Federal Highway Administration, Washington, D.C.
19. Ehlen, M.A., and Marshall, H.E. 1996. The economics of New Technology Materials: A Case Study of FRP Bridge Decks. NISTIR 5864, 67 p.
20. Walls, J., and Smith, M.R. 1998. Life Cycle Cost Analysis in Pavement Design. Interim Technical Bulletin, Publication No. FHWA-SA-98-079, 107 p
21. Goulet, S. 2004. Projet de construction d’un pont possédant une durée de service anticipée de 150 ans. 2004 Annual Conference of the Transportation Association of Canada, Québec City, September 19-22.
22. Ministère des Transports du Québec. 2007. http://transports.atlas.gouv.qc.ca (accessed in April 2007)
23. Ministère des Transports du Québec. 2004.“Débit de circulation 2004 (map)”. Direction du laboratoire des chaussées, Services des chaussées, donnees_circulation@mtq.gouv.qc.ca.
24. Babaei, K., and Hawkins, N.M. (1992). Performance of rehabilitated/protected concrete bridge decks. Corrosion Forms & Control for Infrastructure, Chaker, V (ed.), ASTM STP 1137, 140-154. 25. Markow M., Madanat S. and Gurenich D. (1993). Optimal rehabilitation times for concrete bridge
decks. Transportation Research Record 1392, Transportation Research Board, 79-89. 26. Statistics Canada. 2003. Canadian Vehicle Survey, Cat. No. 53-223-XIE.
27. Transport Canada. 2006. Road Safety in Canada – 2003. TP 13951E.
28. Transport Canada. 1994. Guide to Benefit-Cost Analysis in Transport Canada. TP11875E.
29. Daigle, L. and Lounis, Z. 2006. Life cycle cost analysis of high performance concrete bridges considering their environmental impacts. INFRA 2006 - Le Québec en chantier : optimiser les interventions (Ville de Québec, November 20, 2006).
![Fig. 3. Thick-wall cylinder model of corroding RC deck: a) Tensile stresses developed at crack initiation, b) Propagation of internal cracks in thick-wall concrete cylinder (adapted from [16])](https://thumb-eu.123doks.com/thumbv2/123doknet/14162790.473473/9.918.197.721.336.548/cylinder-corroding-tensile-stresses-developed-initiation-propagation-internal.webp)