Cost Reduction Methodology and Management
by
Gary Tarpinian
B. S., Electrical and Computer Engineering
University of Wisconsin-Madison, 1990
Submitted to the Sloan School of Management and
the Department of Electrical Engineering and Computer Science
in Partial Fulfillment of the Requirements for the Degrees of
Master of Science in Management
And
Master of Science
at the
Massachusetts Institute of Technology
June 1999
@ 1999 Massachusetts Institute of Technology
Signature of Author
Certified by
Certified by
Accepted by
Accepted by
Sloan School of Management
Department of Electrical Engineering and Computer Science
rofessor
Elizabeth Eccher, Thesis Advisor
-S10n
School of Management
Professor Alvin Drake, Thesis Advisor
Departmen
ica
/erin
an
Computer
Science
Art Smith, Chairman
EECS
p rtment C,rr~itt* on Graduate Students
Larry Abeln, MBAPgram Director
Sloan School of Management
MIT Libraries
Document Services
Room 14-0551 77 Massachusetts Avenue Cambridge, MA 02139 Ph: 617.253.2800 Email: [email protected] http://Iibraries.mit.edu/docsDISCLAIMER OF QUALITY
Due to the condition of the original material, there are unavoidable
flaws in this reproduction. We have made every effort possible to
provide you with the best copy available. If you are dissatisfied with
this product and find it unusable, please contact Document Services as
soon as possible.
Thank you.
Some pages in the original document contain pictures,
graphics, or text
that is
illegible.
Cost Reduction Methodology and Management
by
Gary Tarpinian
Submitted to the Sloan School of Management and
the Department of Electrical Engineering and Computer Science
in Partial Fulfillment of the Requirements for the Degrees of
Master of Science in Management
And
Master of Science
at the
Massachusetts Institute of Technology
June 1999
ABSTRACT
Intel Corporation recognized the ability to perform continuous cost reduction was
necessary to maintain competitiveness in manufacturing operations. Intel was
concerned with not only reducing the variable costs of producing semiconductors, but
also in doing so quickly in order to maximize profitability for products of limited life-cycle.
This thesis is based upon work that took place in 1998 at an Intel wafer fabrication
facility near the corporate headquarters Santa Clara, CA. The objective of this thesis is
to describe a cost reduction methodology used within Intel factories to achieve
reductions in wafer manufacturing costs. Organization, information, project definition,
and tools characterize the methodology. Cost reduction teams were organized around
the key cash cost drivers in the factory: spares, gas/chemicals, test wafers, and labor.
Information was used to continuously monitor spending, measure improvements, and
benchmark against the virtual factory to identify opportunities for improvement. Cost
reduction projects were identified, characterized, prioritized and tracked with the help of
cost reduction management tools developed at Intel.
This work included interviews with over thirty participants in Intel's cost reduction effort
at Santa Clara and other manufacturing sites. These interviews identified a need for an
improved method for managing cost reduction projects. Feedback from the various
stakeholders led to the development of a comprehensive project database that
incorporated best practices from a variety of sources from within Intel as well as
financial and operational analysis techniques from outside the organization. The project
database allowed factory managers and technicians to perform economic analysis of an
individual project, aggregate the results of a portfolio of projects, forecast manufacturing
costs, and evaluate team and factory performance with respect to cost reduction. The
research also addresses the role of risk management and organizational learning in a
continuous cost improvement strategy.
ACKNOWLEDGMENTS
The research presented in this thesis was performed under the auspices of the MIT
Leaders for Manufacturing Program, a partnership between MIT and a number of major
U.S. manufacturing companies. I would like to thank MIT and the Leaders For
Manufacturing program for its support of this work and the opportunity to learn and grow
as an individual over the past two years.
Special thanks go to Intel Corporation for its support of my internship and this paper.
Many people played an important role in making my experience at the D2 facility in
Santa Clara, CA a very rewarding one. In particular, two key individuals provided much
appreciated time, support, and encouragement during my internship: Melinda Manente
(LFM '95) and Chris Keith (LFM '96).
Special thanks go to my advisors, Elizabeth Eccher and Alvin Drake, for their support
during my internship and the development of this paper.
I would also like to extend my appreciation to my classmates at LFM who contributed to
my education over the past two years. I have learned from your ideas, values, and
commitment. In particular, I would like to thank my fellow Intel LFM Interns (ILls),
Shafali Rastogi, Manish Bhatia, and Ajay Amar, who helped me to shape this work and
make my internship a success. You all played an important part in making my LFM
experience a very positive and fulfilling one.
Finally, I thank my wife Donna and my children Kelsey and Matthew for indulging me
with your support and patience these last two years. I solemnly promise to refrain from
further educational pursuits for at least two years.
Table Of Contents
1. Introduction 6
1. 1. Chapter Description 6
1.2. Mainufacturing-Business Climate at Intel in 1998 6
1.3. Aission ojthe D2 Facility in Santa Clara, CA 8
2. Cost Reduction Methodology at Intel 10
2.1. Organization 10
2.2. Inforimatiol I I
2.3. Project definition 12
2.4. Tools 12
2.5. Relationship between the BUE and Project Database 15
2.6. Cost management at Intel - A Example 16
2.7. Chapter Summary 21
3. Data Collection 22
3.1. Chapter Overview 22
3.2. Participating on Teams 22
... Voice of the Customer Interviews 22
34. Interview Data Analysis 24
3.5. Cost Project Tracking Systems 27
3. 6. l)ata colect ion conclusions 30
4. Project Definition and Functional Requirements 31
4.1. Chapter Overview 31
4.2. Midstream recommendations 31
4.3. Projcet Definition 31
4.4. Functional Requirements 32
4. 5. Project dcfinition conclusions 36
5. Prototype Development 37
.5.1. Chapter Overview 37
5.2. Computing Environnent 37
-5.3. 1)atabase Structure 37
5.4. User interface 39
.5.5. Data Entry Screens 39
5.6. Project Savings Calculators 40
.5.7. I)ata Alanipulation. Calculations, and Reports 41
5.8. Prototype Development Conclusions 44
6. Pilot Program 46
6. 1. Chapter Overview 46
6.2. Istalling the prototype 46
6.3.. Selecting a Target Group 46
6.4. Populating the Database with Projects 48
6.5. Collecting and Incorporating Customer Feedback 49
6.6. Pilot Prograin Conclusions 50
7. Implementation 51
7. 1. Chapter Overview 51
7.2. Delivering Tools 51
7.3. hinrming Stakeholders 51
7.4. Training Users and Providing Technical Support 52
7. Collect'ig and Incorporating Feedback 53
7.6. limplemnenation Conclusions 53
Table Of Figures
Figure I - Cost Comparison of Three Intel factories 7
Figure 2 - Tool Cost Pareto for Spare Parts 1I
Figure 3 - Pareto of Parts for Tool C 12
Figure 4 - Excerpt from the Bottoms-Up Estimate for Spares 13
Figure 5 - Sample Chart from Project Database 14
Figure 6 - Relationship between BUE and Project Database 15
Figure 7 - Costs for the Tool C PM kit PM 17
Figure 8 - BUE $/wafer start Cost Estimate for PM kit PM 17
Figure 9 - Project Description Screen 18
Figure 10 - Ownership Screen 18
Figure I I - Dates and Status Screen 19
Figure 12 - Savings Screen 19
Figure 13 - Confidence Screen 20
Figure 14 -Savings Summary Report 21
Figure 15 -Voice of the customer Interviewees at D2 23
Figure 16 -VOC Interview Questions 24
Figure 17 -Sample Project Tracking Document 28
Figure 19 - Project Database Functional Requirements 35
Figure 20 -Project Database Field Classifications 38
Figure 21 - Project Database Main Screen 39
Figure 23 -Spares Calculator 40
Figure 24 -Sample Cash Flow and NPV Graph 41
Figure 25 -Pareto Diagram of Project Net Present Value 42
Figure 26 -Project Selection Criteria Screen 43
1. Introduction
1.1.
Chapter Description
The purpose of this thesis is two-fold. The first is to describe in detail tools and a methodology for identifying, prioritizing, and executing cost reduction projects in a manufacturing setting. The second is to present a framework for developing such a system so that it will appropriately fit the organization for
which it is intended. This chapter includes an assessment of the manufacturing-business climate at Intel to provide the necessary context for the rest of the document. The cost reduction methodology described in Chapter 2 consists of the organization, information systems, processes, and tools used to conduct cost reduction at Intel. The processes used to develop a new cost management tool for Intel are described in Chapters 3-8. The development process is broken into five phases: data collection, definition of
functional requirements, prototype development, pilot program, and implementation. For each phase of development. this thesis provides instructions and guidelines followed by specific examples and lessons learned from implementation of a system at an Intel semiconductor manufacturing facility'.
1.2.
Manufacturing-Business Climate at Intel in 1998
InteL the undisputed world leader in microprocessor sales, was encountering a crisis in 1998, during what many would consider the worst downturn ever in the semiconductor industry. The market had softened for lntel's highest performing chips, and the competition had seriously eroded Intel's share of the low-end
PC processor business.
Intel responded to the market changes by segmenting the microprocessor market into three performance levels (Celeron, Pentium, and Xeon), and by aggressively pursuing cost reduction in operations. The cost reduction mandate was passed down to the factories from the highest levels of management, and it took
little time to trickle down to the factory floor.
1.2.1. Capital Intensive Industry
The semiconductor manufacturing industry was somewhat unique in that it was so overwhelmingly capital intensive. As an industry, depreciation of equipment and facilities were two of the greatest expenses. Factories typically cost more $1 Billion and had a useful life of two to four years. Once the factory\ was built, little could be done to reduce the rate at which the property depreciated.
The data for all examples of cost reduction projects at Intel are fabricated to protect proprietary in formiatin011.
Depreciation was driven by obsolescence, so the equipment depreciated at the same rate whether it was
80%c utilized or 40% utilized. Another significant operating cost driver was labor. Factory technicians
were highly skilled and highly paid. For every technician in the factory, there was an engineer or manager outside the fab working to maintain production, cycle time and Work In Process (WIP) turn goals. While labor costs are theoretically variable with production level, in practice it was difficult to quickly adjust headcount. Technicians required a great deal of training before they were productive, and equipment maintenance demanded technician support around the clock.
Fab Operating Costs for D2, F11, andF 12
0 F1 1
Figure 1 - Cost Comparison of Three Intel factories
The next largest costs were the consumables, or variable costs associated with manufacturing
semiconductors. Variable costs included the raw silicon wafers used to make product, chemicals, gases, spare parts. and test wafers. The focus of the cost reduction efforts at Intel was on labor and these consumables. since they were largely within the control of the factory management. Figure 1 shows the costs that go into making a wafer, ordered by magnitude in a Pareto diagram.
1.2.2. Volume and Wafer Costs
The other variable that greatly affected wafer cost was production levels. A factory manager could significantly reduce his or her average wafer cost by increasing the wafer starts per week. Since much of the operating costs were fixed in the short term (depreciation and labor) increasing production levels
spread the fixed costs out over more wafers and therefore lowered the average cost per wafer. This strategy' could have lead to inefficiencies for the overall company if total production was not carefully managed. Had all the factories together overproduced, Intel would have exceeded market demand and created excess inventory. Ideally, each factory produced at a level where the marginal cost per wafer was the same as the other factories.
1.2.3. Copy EXACTLY! And the Virtual Factory
Two terms coined within Intel are necessary to describe their operations strategy. The first is copy
EXA CTL Y!. Copy EXACTLY! refers to the practice used by Intel to copy manufacturing operations from
one factory to another. Stated in its simplest form, "everything which might affect the process, or how it is run" is to be copied down to the finest detail, unless it is either physically impossible to do so, or there
is an overwhelming competitive benefit to introducing a change. The second term is virtual
factory.
Thevirtual factory is the set of Intel factories tooled to produce the same products. As the name suggests, the virtual factory operated as a single entity with respect to manufacturing processes, capacity planning, engineering. and purchasing. For the purposes of this thesis, the virtual factory was made up of the following manufacturing sites:
* D2 in Santa Clara, CA
* Fl I in Rio Rancho, NM * F12 in Chandler, AZ
* Fl5 in Portland, OR
" IFO in Ireland
All members of the virtual factory produced 8-inch wafers containing logic or memory chips using one of
several possible manufacturing processes.
1.3.
Mission of the D2 Facility in Santa Clara, CA
D2 was one of two development factories operated by Intel. The development factory was responsible for
developing the manufacturing process2 by which a new generation of semiconductor products was
manufactured. When the process at D2 reached a level of stability and yields were acceptable, the process
A process is the combination of equipment and procedures that make up a recipe for manufacturing w\afers.
was ported over to the high volume factories within the virtual factory. Engineers from the high volume factories temporarily relocated to D2 to learn the process and facilitate a smooth transfer back to their home fab.
In addition to operating as a development factory, D2 also produced products that were sold for revenue. Production levels were maintained to allow ample capacity for process development, but still utilize the equipment at reasonable levels. This ensured that the processes were capable within a production environment and not just in a laboratory setting. Production also subsidized the development mission by
2. Cost Reduction Methodology at Intel
This chapter describes the organization, information, and tools that make up the cost reduction
methodology at Intel. An example of a cost reduction project from conception to execution is provided as a means to demonstrate how the methodology and tools were used in practice.
2.1.
Organization
D2 had organized several cost teams made up of management, engineers, tool owners, and representatives
from finance and purchasing. The purpose of the teams was to identify opportunities to reduce manufacturing costs, execute projects to achieve cost savings, and report results to management. The teams were organized around the following commodities:
" Spares: Spares are spare parts consumed by the manufacturing equipment in the factory. The majority of the spares were consumed as a result of planned maintenance. The remainder was spares used because of unplanned failure of parts. The planned maintenance work was scheduled according to a time-based or a wafer-based schedule.
" Chemicals and Gases: The semiconductor manufacturing process involves the consumption of various chemicals and gases. Consumption of chemicals and gases was approximately linear with production
level.
* Test wafers: Test wafers are silicon wafers consumed in the manufacturing process to calibrate and confirm proper equipment operation. In some manufacturing processes, the ratio of test wafers to product wafers approached or exceeded one.
* Labor: Technicians and engineers working in and supporting the fab were classified as a commodity for cost measurement purposes.
These four commodities made up the majority of the cash costs of operating the D2 semiconductor fab. The commodity cost reduction team structure was duplicated throughout the virtual factory, and representatives from like teams communicated periodically.
In addition to the cost teams, D2 established a higher-level cost reduction forum made up of senior factory management and the leaders from each team. The forum was known as "Cost Ops", and it met
once a week to discuss recent spending trends, review ongoing cost reduction efforts, and evaluate new init iat ives.
2.2.
Information
The cost teams had ample and timely data from which they would analyze detailed spending profiles for
D2 as well as the virtual factory. Typically, the commodity team would break spending down by tool and by the specific commodity purchased. Information was typically presented to the team in Pareto style
charts to focus attention on the highest costs. Figure 2 is an example of a typical Intel cost Pareto. Attention would be focused on Tools C and F first, since they represent the highest costs.
Figure 2
-
Tool Cost Pareto for Spare Parts
Cost data for each fab were often used for benchmarking purposes. Cost was often presented normalized to S/wafer start to adjust for differences in production levels. Figure 3 is an example of a Pareto diagram for the spare parts used by Tool C. The spares team would focus its attention on the PM kit since D2's costs were considerably higher than either Fab 11 or Fab 12. Attention would also be focused on the holder. since D2's costs were lower than average. The virtual factory competed but also cooperated to help each other reach the lowest costs possible.
SPARES COST PARETO
90 80 70 60-50 40- 30- 20-10 0
COST PARETO -TOOL C SPARES $1.20-$1.00 -- -$0.80 -F11 b $0.60 -F12 $0.40
o
D2 $0.20 $0.00PM gasket holder pad lamp retainer
kit
parts
Figure 3 -Pareto of Parts for Tool C
2.3.
Project definition
Using information from Pareto diagrams to focus their efforts, teams would then brainstorm to come up with cost reduction projects. When a potential project was identified, there was a formal process of review by the virtual factory to assess the risks and benefits of the project. Usually one factory would take the lead on the project and collect experimental data. The data would be reviewed by the virtual factory joint engineering team and the project either approved or disapproved. If approved, the project would be executed throughout the virtual factory, consistent with the Copy EXACTLY! Strategy.
2.4.
Tools
To aid in the characterization, assessment, and tracking of projects, Intel developed several tools.
2.4.1. Bottoms-Up Estimate
The Bottoms-Up-Estimate (BUE) was a cost model that captured the cash costs associated with operating a fabrication tool. taking into consideration factory load, product mix, planned maintenance schedules and frequency. parts cost. and a parts list for each maintenance activity. Based on this information, tool
owners developed detailed cost models that could then be used to create "should cost" estimates of spare
parts consumption. Typically, the models were created using multi-page spreadsheet models and required detailed understanding of how the tool operated.
Tool Y
Unit-based PM activity Units Units/ units per Cost per PM Cost per
wafer PM Wafer
5000 wafer PM Wafers 1 5000 $67.65 $0.014
Target A PM Seconds 0.3 12000 $7,168.71 $.1792
Target B PM Seconds 0.6 3600 $11,053.71 $1.842
Target C PM Seconds 0.1 12,800 $37,523.64 $0.293
Tool Y Major PM Hours 0.25 225 $418.71 $0.465
Wafer Holder Change PM Counts 10 48500 $2,648.00 $0.546
Oil, lube, and filter Wafers 0.66 1150 $732.26 $0.420
Figure 4 - Excerpt from the Bottoms-Up Estimate for Spares
Figure 4 is an example from a BUE developed for a wafer-processing tool. In the figure, there are six different unit-based planned maintenance activities. The second PM (highlighted in bold) replaces a Target A after every 12000 seconds of use. Each wafer consumes 0.3 seconds of target life. Each Target
A PM has a cost of $7168, resulting in a cost of $0.1792/wafer. This same calculation is performed for
all PMs for this tool. The result is an estimate of the spares cost on a per/wafer basis, assuming that spares are consumed only from scheduled maintenance and that all scheduled maintenance occurs exactly when it is required. In reality, Non-PM spares made up a significant portion of the spares costs, and maintenance was performed before or after the exact PM scheduled time.
D2 realized the following benefits from developing the BUE:
* Collecting the needed cost data helped tool owners identify the largest spares cost drivers. * Discrepancies between the predicted and actual consumption could be investigated.
* Tool owners could perform "what if" analyses to determine how changes to the PM schedule would influence spares spending.
The BUEs helped justify efforts to convert many time-based PMs to wafer-based. In other words, instead of replacing a part every 30 days, it might be replaced after some number of wafers are processed. This
would tend to reduce spares consumption in an under-utilized factory as well as rationalize the useful life of the part.
2.4.2.
The Cost Reduction Project Database
A second tool Intel used to manage and track cost reduction projects was the Cost Reduction Project
Database. The project database allowed management and tool owners a way to keep track of all the cost reduction projects in D2 and the virtual factory. The project database provided a means to capture all relevant information about a project, keep track of the project status, generate reports and graphs, and aggregate the results.
Litho Monitor Reduction Projects
p1
p1
Bww 1 6ww from 1889.41 26ww0010
M010 EQ E LT. 105 *Autocal o Focus Mon NLT. 135 r- 009 Resist Thickness E 010 Resist Thickness * LT 110 oLT. 602 52wwFigure 5
-
Sample Chart from Project Database
The database captured information about the purpose of the project, the functional area (e.g., lithography), the specific tool affected, estimated completion dates, estimated savings, and impact on yield and cycle time. The database included tools to help calculate savings estimates and risks. Wherever possible, the database helped the user to use a common set of assumptions about factory production levels, product
mix, and commodity costs. Figure 5 shows a sample chart from the project database. In the example, there are ten different projects each with unique estimated savings and completion dates. This kind of chart would help tool owners prioritize their efforts and forecast savings into the future based on expected gains from the planned projects.
The project database provided Intel the following benefits:
66n
I
I
li~
4ww* Documentation for hundreds of cost reduction projects across functional areas and throughout the virtual factory.
" Accurate and complete descriptions of each project, including savings estimates. * The ability to aggregate the results of a portfolio of projects.
* Forecasting capability to help predict future manufacturing costs.
The database was developed using best practices from within Intel and results of interviews with project stakeholders. The process of developing this project database is the focus of Chapters 3-7 of this document. A complete list of functional requirements can be found in Chapter 4.
2.5.
Relationship between the BUE and Project Database
Figure 6 illustrates the relationship between the BUE and the project database. The two tools
complimented each other. The BUE captured the estimated spending for an entire tool area. The project database helped manage the process of reducing spending.
For a given project, the BUE could be used to help estimate the savings from the project. By using the
BUE as a cost model and performing "what-if' analysis, tool owners were able to quickly estimate the
total savings of a cost reduction project by comparing before and after costs. The savings estimates could then be entered into the project database, which could be used to calculate the total benefit of the project over time and prioritize the project among other candidate projects.
Completed projects
Bottoms-Up
Factorv
Estimate
sProject Database
Estimate dsavings -production
-- -- 1evels
-L f d -pro duct mix
2.6.
Cost management at Intel
-
A Example
The following example takes a project from conception through completion using the Intel cost reduction methodology used by the commodity teams, including use of the tool described above. The example takes place over the course of several weeks. The example project, factory loading assumptions, and all associated cost data are fictitious.
Week
1:
At the weekly spares cost reduction team meeting, the team leader announces that according to the latest cost data, the spares spending at D2 was the highest in the virtual factory and 50% higher than the best factory (see Figure 1 on page 7). D2 has been tasked with reducing spares spending to match the virtual factory average. Figure 2 on page I I shows spares spending for the top six tools, indicating that tools C and F have the highest spares spending. The owners of these two tools are asked to seek out opportunities to reduce spares costs for these tools.Week 2: The owner of Tool C opens up the meeting by presenting spares consumption for the past six months, normalized by the number of wafers processed at each factory (Figure 3 on page 12). Based on
her analysis, she has found that D2 is spending about $ 0.40 more per wafer than Fl 1 or F12 for the PM kit. The PM kit is replaced by a monthly planned maintenance (PM) activity, and is the single most expensive part consumed. She has looked into why costs are higher at D2 by comparing notes with her
counterparts at the other factories. It turns out that while all three factories are spending the same for the kits and replacing them monthly, D2 has lower utilization on tool C than either Fl1 or F12. Therefore, the cost per water is higher at D2. The team leader suggests that she look into why the PM is performed every month, and if it could be converted into a wafer-based PM instead of a time-based PM. For example, if all factories replaced the PM kit every 20,000 wafer passes instead of every month, then the per wafer cost would be the same for all factories. The tool owner agrees to look into the basis for the PM and to investigate the potential cost savings.
Week 3: The owner of Tool C has learned from the vendor that the recommended monthly replacement of the PM kit is driven by degradation of the shield as a function of wafers processed, and the one-month periodic was established by assuming 80% tool utilization. She recommends that the PM be converted to
a wafer-based PM. Based on her calculations and conversations with the vendor about how the life of the
SPRUING,RF ,CON7A CT G $ 2.5G $ 1536 SH2D PLATE 1 5 34.45 $ 34.45 SCR&VPA NHEAD,G-32X&8 2 5 2.43 $ 426 SCRA PANHEAD,8.32XY8 12 5 5.82 $ 6924 SHED KIT 1 $ 4,503.00 $ 4,503D TEST RAFER 1 5 87.45 $ 87.46 LA SCOR 3 $ 80.00 $ 240.0D Tdal $ 4,95496
Figure 7 - Costs for the Tool C PM kit PM
She also presents data from her BUE to estimate the potential savings from extending the PM (see Figure 7). In addition to the $4,503 for the PM kit, there are additional parts, labor and a test wafer to re-qualify the tool after the PM. The total cost is $4,954.96 each time the PM is performed.
Figure 8
-
BUE $/wafer start Cost Estimate for PM kit PM
Each PM should be good for 24,000 wafer passes, and each wafer passes through Tool C several times. Therefore, the cost per Process A and Process B3 wafer is $0.62 and $1.03, respectively. Figure 8 shows the variables for determining the wafers costs. Based on the current process mix and factory loadings,
extending the PM should reduce spares costs for Tool C by about $0.50 per wafer.
The team leader and the tool owner decide to pursue changing the PM kit PM frequency. This will require writing a white paper proposal to justify the change to the virtual factory, testing the change during a pilot phase, data evaluation, and virtual factory approval. The project is now ready to be entered into the Cost Reduction Project Database.
Week 4: The owner of Tool C has entered the preliminary project data into the project database.
I Process A and Process B are different recipes used to produce semiconductors at D2. Qbr cost Tdal C-st
Project Title:
Tool C
PM Extension
Please use a uniqueproject name to identify this projectBriefly explain the nature of the project, what will change, and the nature of the savings?
What commodity is the primary focus?
Select the functional area. Select a tool
Extend the shield kit PM from time-based (monthly) to wafer-based (24,000 wafer passes). ISpares T hin Films ITOOL C Factory -D2: R F11: TV F12: P IFO: F F15: r - Pirocess -pw: CE Code: I
Figure 9 - Project Description Screen
Figure 9 shows the project description screen, where the tool owner enters the name of the project, a brief description of what the project does, the factories and processes to which the project applies, tool group, tool, and commodity.
VF Owner:
phone number: 1765-451-1234
pager number: 1765-555-1234
lab: D2 E
Figure 10 -Ownership Screen
Figure 10 shows the ownership screen where the tool owner can enter her name and contact information. She also enters her home factory, establishing herself and D2 as the lead person and factory for this
project. Select all that apply for this project
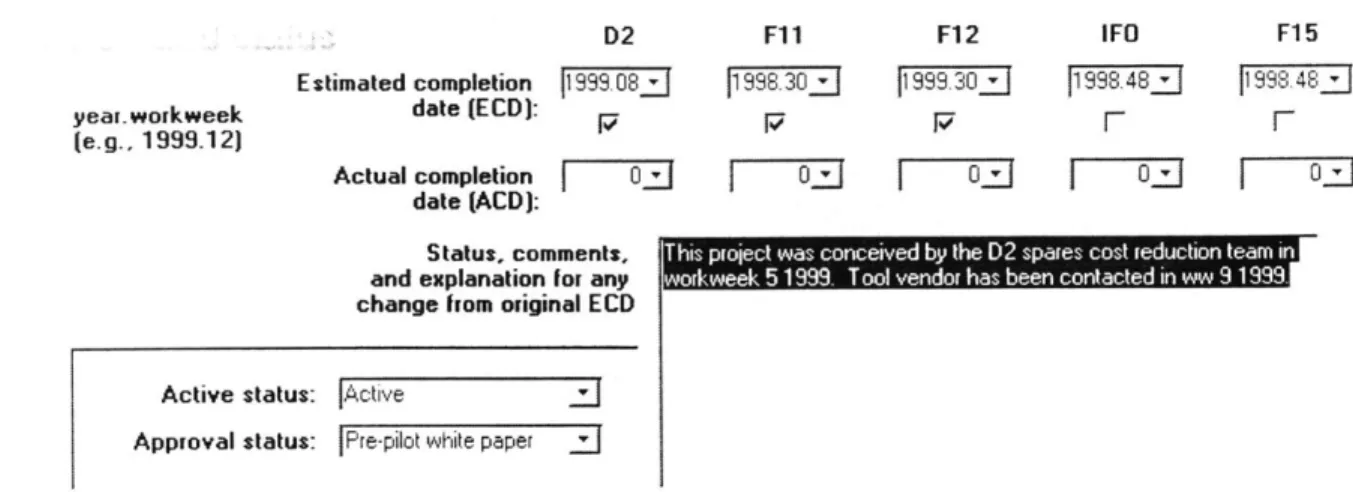
D2 Estimated completion P1999. 08j date (ECD): Actual completion | 0 date (ACD): Status, comments
and explanation [F any change from Original ECD
F11 11998.30j 0 F12 1999.33 Q 0F IFO 11998.48. 03 J
I
~
is wa proec coceve by th D sprsc tre uint n oI we 5 1999 Too ha -edo Iencnatd n 919.Active status: jActive
Approval status:
|Pre-pilot
white paper IFigure 11 -Dates and Status Screen
Figure I I shows the dates and status screen. Each factory has two dates associated with each project: an estimated completion date (ECD) and an actual completion date (ACD). ECDs were established when the piroject was initiated, and ACDs were noted when the project is completed. All dates in the database use the year.workweek format. The status menus helped further classify the projects. The active status differentiated projects that were currently in process from those that had been completed or dropped. The approval status stated at what stage of the virtual factory approval process the project is in. The large text box is an area to type anything related to the project that others might need to know.
The tool owner has entered workweek 1999.084 as the estimated workweek for D2, and workweek
1999.30 for Fl I and F12. Since IFO and F15 do not use Tool C, the project does not apply to them.
802 17 7IMI:-803 r $0.000 854 P $0.220 856 r $0.000 858 $0.000 859
r
$0.000 $/wsStrategy |reduce consumption
Basis for savings: PM extension
Figure 12 -Savings Screen
Figure 12 shows the savings screen where the tool owner enters in the expected savings from the project. Referring back to Figure 8 where she calculated the casts before and after the project, she estimates the
Intel measures time in workweeks. 1999.30 means the 3 0*' week of 1999.
year.workweek (e.g., 1999.12)
F15
savings to be $0.65 for process X wafers and $0.22 for P854 wafers. She also captures the basis and strategy for capturing the savings: reduce consumption of spares through PM extension.
difficulty in - J How difficult will it be to execute this project plan?
Certainty of gain A sure thing :J Once executed, how confident are the gains? Level of autonomy JAutonomous J How many FAs are required to execute this project?
"Confidence" may mean different things to different people. In order to make an objective predictor. please answer the above questions. Overall confidence will be calculated as a function of these factors.
Figure 13 -Confidence Screen
Figure 13 shows the confidence screen. This screen captures the certainty or uncertainty of the projects success using three different metrics: difficulty, certainty of gain, and level of autonomy. Difficulty captures how hard is to do what you say you are going to do. Certainty of gain means even if you execute the project as planned, how certain is the gain. Level of autonomy asks how many different stakeholders must be involved to complete the project. Based on these three metrics, the project database estimates the success of the project and discounts the expected value accordingly. For example, a project that is expected to save $200,000 with a confidence of 75% would be valued at $150,000.
Now that the project has been captured in the database, it will appear with other projects in various reports used by management, as well as her own reports for tracking projects in her area.
Week 6: The manager of the Thin Films area requests a summary of all projects currently being worked on in Thin Films. Figure 14 (next page) shows an excerpt from the savings summary report for thin films, including the Tool C PM kit project.
Week 8: Management is pleased with the results of the project and asks whether the PM could be extended further. to 36,000 wafer passes. The spares calculator shown in Figure 21 can be used to calculate the expected savings, assuming the entire cost of the PM, to be about $0.21/ws for process X
wafers. However, the tool vendor warns that beyond 24,000 passes, die yield may be degraded. The
yield impact can also be reduced to a $/ws, and weighed against the benefit of the lower PM cost.
Week 9: The engineering committee reviewing the project approves implementation for the entire virtual factory. The database and the BUE are updated to reflect the actual completion dates, status, and costs.
Savings
summary
T il Grop Project Narae Prclect Description Oomrrmdity FA Ow ner/8t TO L
T F 690 Montor Frequencyto be Product Thh :ies 9 E El
reduced by2X + Montors Firn W Precu e nc
V". tt?~s
prblms.
T F.X'E Water reuse to be increased Product Thi :Aies 9 El 0 El El El
upto 10 tirnes. Montors Firrs tws #ope Id c hine.
T F.X 91 Montor Frequencywil be Product Thin :Wies 0 El 0 El El El
reduced 5 foki. Montors Firrm 6ws J12 U #DBG kDJ33 o3. -ny
deacwIrm
we direr InQ I r
Stiznmar; for'Tool Group'= TCOL A(3 d st2i recordi)
gLin 12.3 s $ i.0 1.33 00.33 13.33
T 0 CO0L C
Tool C Eendthe Wt PM Spares Thri :Wies E 9 El 0 Jane Aistin [It PM frortrne-based (rrenthly) Firs ws j # # Jam # ja spreci
&-iension to wafer-based C24,000 #om m o #con0i-en
som som
wairpasses) &week by re D2
spares os I
Mu::en knT
Sunm3r: ,or'Tool Group'= TCOL Cfl I ibll rec crd)
Figure 14 -Savings Summary Report
2.7.
Chapter Summary
This chapter describes the methodology used within Intel factories to achieve reductions in wafer manufacturi ng costs. Organization, information, project definition, and tools characterize the methodology. Cost reduction teams were organized around the key cash cost drivers in the factory: spares, gas/chemicals, test wafers, and labor. Information was used to continuously monitor spending, measure improvements, and benchmark against the virtual factory to identify opportunities for
improvement. Cost reduction projects were identified, characterized, prioritized and tracked with the help of two cost reduction management tools developed at Intel. The first tool was the bottoms up estimate, a cost model that reflects all the planned costs of operating a tool in the factory. The second tool was the project database, a system for characterizing and tracking cost reduction projects from conception to completion.
3. Data Collection
3.1.
Chapter Overview
The cost reduction culture at D2 was studied as part of an overall process to develop a formal methodology for sustained cost competitiveness. The development process included data collection, project definition, prototype development, pilot program, and implementation. This chapter describes a two-stage data collection process used to develop an understanding of the strengths and weaknesses of the cost reduction environment at Intel. The first stage included a period of informal, passive data collection to get to know the organization. Informal data collection took the form of attending cost team meetings and getting involved in small projects. The second stage was a period of more active collection including formal interviews to document how engineers and managers performed cost reduction and what could be done to help them. Voice-of-the-Customer (VOC) interview techniques were used to collect customer
needs. The VOC data was then organized in a useful format using the Strengths-Weaknesses-Opportunities-Threats framework. The VOC interviews also provided an opportunity to collect inforniation on existing cost reduction project tracking tools. This chapter summarizes these tracking tools by commodity team and describes the strengths and weaknesses of each. The VOC data and the analysis of existing tools are organized for use in creating functional requirements in the next chapter.
3.2.
Participating on Teams
During the passive phase, it was possible to learn a great deal about the organization by attending daily operations meetings, weekly factory cost meetings, and commodity cost team meetings. Each commodity group (spares, chems/gases, monitors/test wafers) met regularly to discuss the status of cost projects actively being pursued ii various parts of the factory. These meetings provided many opportunities to see
how\ cost reduction was being managed at the factory floor level.
3.3. Voice of the Customer Interviews
The next phase of data collection required a more comprehensive understanding of the needs of the cost reduction effort at D2. A useful technique for collecting information on existing cost reduction efforts
was to conduct Voice-of-the-Customer interviews with many key players in the cost reduction effort. The Cost Ops forum was used as a starting point for identifying interview candidates. Figure 15 is an initial
Interviewees
D2 and F17 Operations Manager Product marketing
Finance Manager D2 purchasing
Test Wafer Reduction Team Finance Reps to Cost Teams
Chems/Gases Reduction Team Buyers (Finance)
Spares Reduction Team D2, F11, and F12 Cost Managers
Shift Mangers Tool Group Leaders
Figure 15 -Voice of the customer Interviewees at D2
Representatives were targeted from each of the commodity teams tasked with cost reduction. Where possible, counterparts from other members of the virtual factory were included. The list of interviewees started at about 20, but grew with time as one person would recommend that someone else be added. The following lessons resulted from the interviews and could be consider best practices when conducting the VOC interviews:
. Approximately one hour was adequate for the VOC interviews. Most people have very full schedules and rmay be reluctant to give up time if they were not getting something in return.
. Providing a list of topics or questions before the meeting allowed the interviewees to consider issues in advance. Figure 16 shows the interview topics used.
- Greater insight resulted from the interviews when they were conducted as open-ended discussions, rather than going through a standard list of questions.
. A good mix of time was to spend the first 1/2 of the interview dealing with functional aspects of cost
reduction such as organization and decision making methods, and the second half focusing on managerial aspects; how they manage or are managed, how they keep track of their efforts, and how they report up and down the chain.
. Every interview began with an explanation of the scope and purpose of the cost reduction
methodology project and the reason they were chosen for the interview. Often this lead to specific examples of cost projects with which they were involved.
. Interviewees examples of successful and unsuccessful cost reduction efforts, best practices they could pass along to other teams, and needs that they could identify that would help them perform cost reduction more effectively were very useful.
. It was useful to transcribe notes into a structured framework (SWOT) within 48 hours while the interview was still fresh in memory. Direct quotes and images were captured whenever possible.
Voice of the Customer Interview Guideline Questions
FunctionalHow/to what extent are you involved in cost cutting?
How is your cost effort organized? (team/individual, representation)
How do you decide what projects to take on? (risk, net savings, payback
period, low hanging fruit)
What kinds of tools or skills did you use? What have you lacked?
What methods have worked well for you? What has not worked well?
Managerial
'How was the
"cost
message delivered to you? Is the message consistent?
How do you track progress? What metrics do you use?
How do you communicate the results to management?
What roadblocks have you encountered?
What would you change with respect to the cost reduction effort?
Who else should I talk to?
Figure 16 VOC Interview Questions
3.4.
Interview Data Analysis
Below\ is a summary of the strengths, weaknesses, opportunities, and threats (SWOT) extracted from the interviews of D2 and virtual factory cost team members. The SWOT analysis proved to be an effective framework for organizing the results of the interviews. Based on the SWOT framework, broad
generalizations were created and used as basis for developing the functional requirements of a cost manageient system.
3.4.1.1. Strengths
D2 appeared to be very focused on cost reduction. All levels and functions were well aware of the cost
goals. The following specific examples were mentioned repeatedly throughout the interviews as strengths
of the ong"oing cost reduction effort:
- Healthy comnpetition among fabs: Each week, D2 compared itself to the virtual factory average and
the virtual factory best across many cost areas. This created a healthy sense of urgency and competition, and motivated the cost teams to seek out improvements.
. Consistent message: There appeared to be a consistent message delivered to and by all levels of management that cost reduction was a priority. By explicitly targeting cost reduction, the Quarterly Business Unit Meeting (BUM) delivered by top management to the entire company helped reinforce the significance of cost reduction to company performance.
. Thinking globally-Actin g locally: Cost targets were set at the virtual factory level, yet commitments
were assigned at lowest level possible. Individual technicians and tool owners were assigned and held accountable for identifying and executing cost reduction opportunities. This sense of ownership helped to ensure that the projects were accomplished.
. Bottoms- Up-Estimates: The BUEs were widely considered valuable tools for managing cost. Some
believed that the exercise of building the BUE was equally as useful as actually using it afterwards because they learned about the costs associated with their tool.
- Xf mi!onal teams: Technicians, engineering, finance, and purchasing were all represented and
actively participated on the cost teams.
. White papers: The White paper process, a formal review at the virtual factory level of significant
process or equipment modifications, was considered an effective mechanism for monitoring and implementing change.
3.4.1.2. Weaknesses
The majority of perceived weaknesses associated with the cost reduction effort were cultural. Risk aversion. many believed, was the single greatest barrier to cost reduction. The low hanging fruit had been picked. and the next generation of projects would require greater risk-taking. The following items were mentioned as specific problems within the cost effort.
. Yie/l culture is unyielding: Despite the need to reduce costs, the culture within the factory was still
strongl\ tied to obtaining high yields and low cycle time. There was little room for compromise in these t\w o areas, even when significant cost savings were possible.
. D2 too risk averse: Risk was generally not quantified when evaluating a change. Elements of risk
included issues such as "can we execute the change?", "will the change deliver the desired result?" or "will there be unanticipated side effects of change?" Instead of quantifying the risk, people tended to gravitate toward projects that contained little risk.
- VF team structure lacked leadership: Many decisions that affect cost were made at the virtual factory
level and by consensus. At times this meant a single dissenting opinion could suppress a good idea. . Weak or1ganiational learning: While cost teams had made progress, there was no system of
continuous learning and informational exchange to help foster future improvements. There was a lack of infrastructure to grow and maintain a cost-conscious culture within the factory. To illustrate the point, cost reduction topics made up only a few percent of the 1998 papers submitted at a company-wide learning conference despite cost reduction being a top priority for the company that year. Cost reduction was considered a one-time event rather than a permanent way of thinking and working.
3.4.1.3. Opportunities
The following comments describe activities that were suggested as opportunities to make significant improvements to the cost reduction effort.
. It rodluce cost imlipJroveients earlier in the ramip: Many felt that by the time cost is considered in the
process development, many variables had been fixed. If process development and cost reduction
were pursued more concurrently, greater improvements could have been achieved.
. Usc ecess capacity to experiment: Excess capacity in the virtual factory was a significant
opportunity to experiment with cost reduction ideas. Experiments with labor, for example, had been carried out with great success.
. Usc D2's stock of PhDs to reduce costs: There was great brain-power within D2 that could have been
applied to cost reduction. D2 should have been the leading exporter of cost reduction ideas, but in fact it often lagged the high volume factories.
. Free up rechnical staff with administrative help: Cost team leaders and members spent many hours
each week creating materials to present at cost meetings. An administrative assistant dedicated to cost reduction could collect and disseminate cost project information, prepare presentation slides, etc., freeing technical people to spend time working on projects.
3.4.1.4. Threats
. The capacity-constrained mindset: D2 made decisions as though it was capacity constrained when the virtual factory actually had excess capacity. When a factory is capacity constrained, one can apply constraint-theory to bottlenecks to justify high production costs. In a market-constrained
environment, however, one should consider the marginal cost of a wafer, not revenue, when justifying production costs, such as monitors.
. Suppliers and vendors had no incentive to reduce: Vendors were an excellent source of knowledge
and ideas for reducing costs. However, Intel did not provide the vendors an incentive to share the information. In many cases, it was contrary to the vendor's interest to help Intel cut costs. Vendors also claimed that Intel has been resistant to adopt their ideas.
. There were no daily cost indicators at the factory floor level: There was a perceived lack of cost information in some tool groups. This appeared to be an organizational flaw, rather than a real lack of information, since other tool groups had ample access to real-time cost data.
. Scarce low hanging fruit: It is widely believed all of the "low risk, high reward" projects would be completed by the forth quarter of 1998. After the current round of projects, there would not be enough good projects to keep the momentum going and costs would plateau.
- False perception ofinprovenients: The bulk of the projected wafer cost savings resulted from
increased production at D2 rather than cost reduction efforts. While increased utilization helped make D2 more competitive with the virtual factory, it artificially inflated the effectiveness of cost reduction efforts and may also have inhibited the development mission of D2.
3.5.
Cost Project Tracking Systems
A by-product of the interviews was a collection of examples of how people managed their cost reduction
efforts. Methods varied from pencil-and-paper lists to detailed databases containing hundreds of projects. For some groups. creating the list was a one-time event and the list was rarely if ever revisited, while others reflected on their list daily or weekly. There were many independent project databases and project evaluation tools in circulation. Each database, spreadsheet, and project evaluation tool required
considerable time to create and even more to maintain.
3.5.1. Commodity Team Solutions
Each commodity team had its own method of tracking projects. While there were differences in style and format. they all contained the same basic components and served the same purpose.
3.5.1.1. Monitors
The monitor reduction team had a spreadsheet format that all tool groups started out using, but then modified to meet their specific naming conventions and format needs. For example, the projects for an in-line monitor reduction project were primarily focussed on labor savings, and measured effectiveness in technician hours saved. Test-wafer projects, like those shown in Figure 17, might involve reduced consumption of test wafers through increased reuse or elimination of monitor steps. The original monitor team format did not work for both kinds of projects.
Project Description Tool Type Process New ECD Owner D2 Annual Comments/Status (Tool JET) Savings
25o reduction in use of thickness Tool A Both ww48 Bruce Lee $75,000 D2 to start collecting data
monitor wafers.
Sputter TF reuse to feed sputter Tool B Both ww4 G. Smith $45,000 F1 5 to run Pilot thickness retarget.
Regeneration of thickness monitors Tool F A ww46 S. Gardner $520,000 Thickness issues
observed with reuse wafers.
Qual 1Ox regen loop for sputter etch Tool N Both ww42 D. Kennedy $172,000 Pilot running @ F11, data
monitor not looking good
Figure 17 Sample Project Tracking Document
3.5.1.2. Spares
The spares teams were using an MS Access 2.0 database borrowed from Fl I to maintain all their projects. The F I I database offered substantial search, filter, and report capability; however, few project owners were comfortable enough with Access to use the database effectively. Most kept separate lists that they used for routine tracking of projects.
3.5.1.3. Chems/Gases
Chemicals and gases projects were generally less complicated, and were captured in a single list maintained by the team leader. This allowed the team leader the opportunity to add up the net effect of many projects, in whichever combination she needed. This ability to aggregate results of many projects made her list useful for forecasting future costs.
3.5.1.4. Labor
As a result of an all-day labor reduction meeting and subsequent brainstorming sessions, D2 had in excess of 700 different labor projects on record. Of the 700, about 400 were considered active, at some level. These projects were maintained in five or more separate Excel spreadsheet files, but all used the same
format. Separate files were created to avoid conflicts between groups needed to access the data at the same time.
3.5.2.
Common Weaknesses
All or most of the existing cost project tracking systems shared common weaknesses.
3.5.2.1. Redundant data
Many people were expected to keep track of the same projects in more than one place. For example, one member of the monitor reduction team had a spreadsheet of her own that she used to document projects for her tool group meetings, and another spreadsheet that was supposed to be used for the monitor reduction team.
3.5.2.2. Lack of Consistency and data integrity
There was no consistency among the cost teams, no way to aggregate the benefits of many projects, and no way to forecast savings into the future. Some projects measured savings in total dollars, others in dollars/wafer, and others in terms of labor hours. A lack of consistency in data formats made the
information difficult to manipulate. For example, all projects have an estimated completion date. Sometimes the completion date was in a standard date format (2/15/99); other times in a workweek format (WW 43); other times listed by quarter (Q2 1999). Often times projects would be recorded without key pieces of information like estimated savings or completion dates. Without data consistency, the project information could not be manipulated, sorted, or aggregated. The data was only useful as a static list.
3.5.2.3. No link between projects and projections
There were tables and charts containing cost projects and other tables and charts showing wafer cost-cutting goals, but no logical link between the two. Long range wafer cost goals were established and committed to without the benefit of knowing what projects were planned, what the benefit would be, or the when the savings would be realized. As a first cut, management might say, "everyone cut costs by
301/ " without tying the goals to the existing project roadmaps. 3.5.2.4. The process X Cost scorecard
An interesting exception was the process X Cost Scorecard. A team was formed specifically to track the costs associated with the process X process used to make FLASH memory. Intel had to drastically cut costs to meet a price set by the open market. The process X Scorecard team developed a baseline cost
made up of ten or more detailed cost categories (e.g., the cost of clean-room gowns). From this baseline, the process X Scorecard team established goals for each cost team that would allow Intel to meet the market price plus margin. The process X Scorecard team then tasked the cost teams to provide project roadmaps that would allow the teams to make the cost target. If the cost team could not meet their targets, they would appeal to the Scorecard team, and the savings allocated elsewhere. This was an excellent example of target costing.
3.5.2.5. Arbitrary assumptions
The cost reduction teams estimated economic benefit for each project without a common set of assumptions and guidelines. Assumptions regarding factory loadings, wafer costs, labor rates, and product mix were at the discretion of the person planning the project. Therefore, comparing the relative benefits of two projects was often difficult.
3.6.
Data collection conclusions
Data collection occurred in two forms. The first form was passive, by observing, participating on teams, and by testing reactions to new ideas and tools. The other form of data collection was active, through surveys or interviews.
Conclusions from the interviews were that Intel was very focused on cost reduction, but there were aspects of the organization and culture that may have been preventing greater improvements. There was a variety of tools in place to help with cost reduction, but there was no single solution that applied to the entire factory and satisfied the needs of the many stakeholders.
The purpose of the data collection was to help in the next step, which was to define a project and the functional requirements for a system to provide sustained cost competitiveness at Intel. Functional requirements are covered in the next chapter.
4. Project Definition and Functional Requirements
4.1.
Chapter Overview
During the Project Definition phase, preliminary recommendations were formulated and presented to the factory management. Feedback from the recommendations established a direction for the remainder of the cost reduction methodology project. Considered while defining the project were aggregated findings from research including Voice of the Customer data, best practices, existing tools such as cost models and project tracking databases, and examples of effective cost reduction management from outside literature.
4.2.
Midstream recommendations
The following preliminary recommendations were presented to D2 management following the data collection phase. The presentation occurred at approximately the midpoint of the six-month work.
Strategic recommendations:
- D2 should take a leadership role in cost reduction: deliver a low cost process to the high volume
factories.
- Take risks t D2: Isolate failures, leverage successes. Create a metric to encourage calculated
risk-taking.
S /Introduce cost reduction in process development: create a cost scorecard for process development.
Tactical recommendations:
- Develop BUEs at the virtual
factory
level.- Ev'aluare projects acrossfunctional areas using NPV analysis: include startup cost, yield, WIP,
confidence.
* Balance priorities between yield, cycle tine, cost.
0 Consolidate and integrate factory tools such as the project databases, BUEs, and cost scorecard.
4.3. Project Definition
Most cost teams had some sort of cost project tracking system that they were currently using. The concept of a list of ongoing projects with due dates, savings estimates, and status seemed to be common across many cost teams. The cost reduction project database (henceforth referred to as Project99) was conceived to provide a master tracking system that incorporated the best practices of all the existing tools.