Earthquakes in Switzerland and surrounding regions during 2005
N
ICOLASD
EICHMANN, M
ANFREDB
AER, J
OCHENB
RAUNMILLER, S
TEPHANH
USEN, D
ONATF
ÄH,
D
OMENICOG
IARDINI, P
HILIPPK
ÄSTLI, U
RSK
RADOLFER& S
TEFANW
IEMERKey words: Earthquakes, focal mechanisms, moment tensors, Switzerland
ABSTRACT
This report of the Swiss Seismological Service summarizes the seismic activity in Switzerland and surrounding regions during 2005. During this period, 611 earthquakes, 96 quarry blasts and two landslides were detected and located in the region under consideration. With 19 events with ML≥ 2.5, the seismic
ac-tivity in the year 2005 was below the average over the last 30 years. However, with the earthquake of Vallorcine (ML4.9) located just across the border to
France, between Martigny and Chamonix, and the two earthquakes of Rumis-berg and Brugg (ML4.1), located in the lower crust beneath the Jura
Moun-tains of northern Switzerland, the year 2005 saw three events that produced shaking of intensity IV and V (EMS98). Of the 611 recorded earthquakes more than 110 events are aftershocks of the Vallorcine quake. Moreover, 51 events occurred within two days at the end of August during a period of very intense rainfalls. The epicenters of these events were concentrated in several clusters distributed over a wide area of central Switzerland, and their focal depths were shallow, so that they most likely constitute a case of precipitation-induced seismicity.
ZUSAMMENFASSUNG
Dieser Bericht des Schweizerischen Erdbebendienstes stellt eine Zusammen-fassung der im Vorjahr in der Schweiz und Umgebung aufgetretenen Erdbe-ben dar. Im Jahr 2005 wurden im erwähnten Gebiet 611 ErdbeErdbe-ben sowie 96 Sprengungen und zwei Bergstürze erfasst und lokalisiert. Mit 19 Beben der Magnitude ML≥ 2.5 war die seismische Aktivität im Jahr 2005 unter dem
Durchschnitt der vergangenen 30 Jahre. Mit dem Erdbeben von Vallorcine (ML4.9), in Frankreich nahe der Grenze zur Schweiz zwischen Martigny und
Chamonix gelegen, und den zwei Ereignissen von Rumisberg und Brugg (ML
4.1), in der unteren Kruste des Nordschweizer Juras, haben sich jedoch drei Beben ereignet, die Erschütterungen der Intensität IV und V (EMS98) verur-sacht haben. Von den 611 aufgezeichneten Erdbeben gehören mehr als 110 Ereignisse zu den Nachbeben von Vallorcine. Ausserdem sind 51 mehrheitlich kleine Beben innerhalb von nur zwei Tagen Ende August während einer Peri-ode ausserordentlich intensiver Regenfälle aufgetreten. Die Epizentren dieser Beben waren in verschiedenen Häufungen konzentriert, die über ein grösseres Gebiet der Zentralschweiz verteilt waren, und ihre Herdtiefen waren durch-wegs flach. Somit handelt es sich hier sehr wahrscheinlich um einen Fall von niederschlagsinduzierter Seismizität.
RESUME
Le présent rapport du Service Sismologique Suisse résume l’activité sismique en Suisse et dans les régions limitrophes au cours de l’année écoulée. En 2005, 611 séismes, 96 tirs de carrière et deux glissements de terrain ont été détectés et localisés. Avec 19 événements de magnitude ML≥ 2.5, l’activité sismique de
l’année 2005 a été inférieure à la moyenne de ces 30 derniêres années. Cepen-dant, des intensités IV et V (EMS98) ont localement été atteintes lors du séis-me de Vallorcine (ML4.9) localisé de l’autre côté de la frontière avec la
Fran-ce, entre Martigny et Chamonix et lors des deux séismes de Rumisberg et Brugg (ML4.1), localisés dans la croûte inférieure sous les montagnes du Jura
du nord de la Suisse. Parmi les 611 séismes enregistrés, plus de 110 étaient des répliques du séisme de Vallorcine et 51 se sont produits pendant deux jours à la fin du mois d’août lors de pluies très intenses. Localisés proche de la surface et distribués par paquets, sur une grande partie de la Suisse centrale, ces 51 événements constituent probablement un exemple de sismicité induite par précipitations.
been published for the years 1972–1974. These reports to-gether with historical records of earthquakes dating back to the 13th century have been summarized by Pavoni (1977) and provided the basis for the first seismic hazard map of Switzerland (Sägesser & Mayer-Rosa 1978). With the advent Introduction
Past earthquake activity in and around Switzerland has been documented in an uninterrupted series of annual reports from 1879 until 1963 (Jahresberichte des Schweizerischen Erdbebendienstes). Three additional annual reports have
Swiss Seismological Service, Institute of Geophysics, ETH Hönggerberg, CH-8093 Zürich, Switzerland. (http://www.seismo.ethz.ch) Contribution No. 1478, Institute of Geophysics, ETH-Zürich.
0012-9402/06/030443-10 DOI 10.1007/s00015-006-1201-1 Birkhäuser Verlag, Basel, 2007
of routine data processing by computer, the wealth of data acquired by the nationwide seismograph network has been regularly documented in bulletins with detailed lists of all recorded events (Monthly Bulletin of the Swiss Seismological Service). Since 1996, annual reports summarizing the seismic activity in Switzerland and surrounding regions have been published in the present form (Baer et al. 1997, 1999, 2001, 2003, 2005; Deichmann et al. 1998, 2000a, 2002, 2004). In the course of reassessing the seismic hazard in Switzerland, a new uniform earthquake catalog covering both the historical and instrumental periods has been compiled (Fäh et al. 2003). The data in the new Earthquake Catalog of Switzer-land (ECOS) are available on line (http://seismo.ethz.ch, Swiss Earthquake Catalogs). The new seismic hazard map of Switzerland based on this catalog was officially released in 2004 (Giardini et al. 2004). In addition, numerous studies covering different aspects of the recent seismicity of Switzer-land have been published in the scientific literature (for an overview and additional references see, e.g. Deichmann 1990; Pavoni & Roth 1990; Rüttener 1995; Rüttener at al. 1996; Pavoni et al. 1997; Deichmann et al. 2000b; Kastrup et al. 2004).
Seismic stations in operation during 2005
The Swiss Seismological Service operates two separate nation-wide seismic networks, a high-gain seismometer network and a low-gain accelerograph network. The former is designed con-tinuously to monitor the ongoing earthquake activity down to magnitudes well below the human perception threshold, whereas the latter is principally aimed at engineering concerns and thus only records so-called strong motions. The observa-tions presented here are based mainly on the high-sensitivity monitoring network.
Since February 2002, the national high-gain network con-sists almost entirely of digital data acquisition systems with high dynamic range and with either three-component broad-band STS-2 seismometers or Lennartz 5-second sensors (BB and EB in Table 1). For a detailed description of this data ac-quisition system, see Baer et al. (2001).
In order to monitor with greater precision an ongoing se-quence of earthquakes in the immediate vicinity of the south-ern segment of the new Gotthard railway tunnel that is still under construction, a set of eight stations with short-period seismometers and in part with three-component accelerome-ters were installed during the late Fall of 2005 in the region between the Lukmanier Pass and the Leventina Valley (Table 1 and Fig. 1). In addition, an accelerometer has been installed in the tunnel itself (MFSFA in Table 1). These eight stations are operated under a contract with AlpTransit-Gotthard AG. The signals of six of these stations are inte-grated in realtime in the national high-gain network, while the data of one station (LUKA1) is downloaded per tele-phone, and two stations (CHAT1 and CHAT2) store the data on site.
National high-gain network recorded in Zürich
Code Station name Type
ACB Acheberg, AG EB-3
AIGLE Aigle, VD BB-3
BALST Balsthal, SO BB-3
BERNI Bernina, GR BB-3
BNALP Bannalpsee, NW BB-3, SM-3 BOURR Bourrignon, JU BB-3, SM-3 BRANT Les Verrières, NE BB-3
CHKAM Kamor, SG BB-3
DAVOX Davos, GR BB-3
DIX Grande Dixence, VS BB-3, SM-3 EMV Vieux Emosson, VS BB-3, SM-3
FLACH Flach, ZH EB-3
FUORN Ofenpass, GR BB-3 FUSIO Fusio, TI BB-3, SM-3
GIMEL Gimel, VD BB-3
GRYON Gryon, VS EB-3
HASLI Hasliberg, BE BB-3 LIENZ Kamor, SG BB-3, SM-3 LKBD Leukerbad, VS EB-3 LKBD2 Leukerbad, VS SP-3 LLS Linth-Limmern, GL BB-3, SM-3 PLONS Mels, SG BB-3 MMK Mattmark, VS BB-3, SM-3 MUGIO Muggio, TI BB-3 MUO Muotathal, SZ BB-3 SALAN Lac de Salanfe, VS EB-3 SENIN Senin, VS BB-3, SM-3 SLE Schleitheim, SH BB-3 STEIN Stein am Rhein, SH EB-3 SULZ Cheisacher, AG BB-3, SM-3
TORNY Torny, FR BB-3
TRULL Trullikon, ZH EB-3 VDL Valle di Lei, GR BB-3, SM-3 WEIN Weingarten, TG EB-3
WILA Wil, SG BB-3
WIMIS Wimmis, BE BB-3 ZUR Zürich-Degenried, ZH BB-3, SM-3
AlpTransit-Gotthard Network
Code Station name Type
CHAT1 Predelp, TI SP-3 CHAT2 Alpe di Cari, TI SP-3 CHIR1 Chironico, TI SP-3, SM-3 DOETR Doetra, TI SP-3, SM-3 LUKA1 Lucomagno, TI SP-3, SM-3 MFSFA Faido (Tunnel), TI SM-3 NARA Leontica, TI SP-3 RITOM Lago Ritom, TI SP-3, SM-3 TONGO Tortengo, TI SP-3
Single stations
Code Station name Type
BBS Basel-Blauen, BL SP-1
BERT Bern, BE SP-3
GNV Geneva, GE SP-1
Table 1. Seismograph stations operational at the end of 2005. Instrument types: SP = 1 second, EB = 5 seconds, BB = broad band, SM = accelerometer, 1 = vertical component only, 3 = vertical and horizontal components. Signals of LKBD2 and BBS are transmitted via analog telemetry; data of the single station BBS are recorded by the Landeserdbebendienst Baden-Württemberg and those of BERT and GNV are recorded locally on paper.
Thus, by the end of 2005, the number of stations transmit-ting data in realtime to the recording center of the Swiss Seis-mological Service in Zurich included 28 broad-band instru-ments (STS2), 8 five-second seismometers, 6 short-period sen-sors and one accelerometer. (Table 1 and Fig. 1).
The data of the national strong-motion network is recorded on site and can be downloaded interactively by telephone. To complement this acceleration data with signals that are avail-able in realtime, 12 stations of the broad-band network are equipped with an additional three-component Kinemetrics EpiSensor accelerometer (Table 1). In 2005, FUSIO was added to this set of stations.
Data from foreign networks
For detailed studies of selected earthquakes and for constrain-ing the location and the focal mechanisms of earthquakes situ-ated on the periphery or outside the Swiss station networks, we use additional data obtained from the Erdbebendienst des Landesamtes für Geologie, Rohstoffe und Bergbau Baden-Württemberg in Freiburg (LED), from the Zentralanstalt für Meteorologie und Geodynamik in Vienna (ZAMG), from the SISMALP array operated by the Laboratoire de Géophysique Interne et Tectonophysique, Observatoire de Grenoble (LGIT), from the Laboratoire de Détection et Géophysique in Bruyères-le-Châtel (LDG), from the RéNaSS array operat-ed by the Ecole et Observatoire des Sciences de la Terre in Strasbourg, from the Istituto Nazionale di Geofisica e Vul-canologìa in Rome (INGV), and from the Istituto di Geofisica, Università di Genova.
To improve the reliability of automatic locations for events at the periphery or outside of Switzerland we have implement-ed an automatic system for retrieving near-realtime data from
some of the institutions listed above (Baer et al. 2003). More-over, in the course of a cross-frontier cooperative effort to ex-change seismic data in realtime, we continuously record and archive the signals of two Austrian stations (DAVA and WTTA) as well as four stations in northern Italy (MABI, MDI, MONC and DOI).
Hypocenter location procedures
In the past, source locations were calculated either with a mod-ified version of the widely used HYPO-71 algorithm originally developed by Lee & Lahr (1972) or with a grid search algo-rithm based on direct foreward modeling of travel times. The seismic velocity models used consist of three horizontal crustal layers with constant velocities overlying a mantle half-space. The models in a simplified way account for differences be-tween the near-surface geology in the Alps and foreland as well as for the large depth variation of the crust-mantle bound-ary. In addition, calculated travel times are corrected for dif-ferences in station elevation (for more details see Deichmann et al. 2004). An added feature of these two algorithms includes the possibility to use secondary arrivals, such as the reflection at the Moho, PmP, or the direct wave, Pg, at distances were the Moho refraction, Pn, is the first arrival.
With the year 2005, hypocenters of most of the local earth-quakes have been calculated using the software package Non-LinLoc (Lomax et al. 2000). This procedure is based on a com-bination of probabilistic earthquake location and non-linear, global search algorithms using nested grids or the Oct-Tree Importance sampling algorithm (Lomax & Curtis, 2001). The probabilistic, non-linear formulation of the earthquake loca-tion problem contains a complete descriploca-tion of localoca-tion un-certainties. In this approach, a priori known errors such as Fig. 1. Seismograph stations in Switzerland oper-ational at the end of 2005. The set of small trian-gles without station labels correspond to the Alp-Transit-Gotthard network (ATG-array).
BBS BOURR DAVOX DIX LLS MMK MUO TORNY SENIN SLE VDL WILA WEIN TRULL STEIN FLACH ACB SULZ LKBD GNV 6o 7o 8o 9o 10o 6o 7o 8o 9o 10o 46 o 47 o 46 o 47 o ZUR 50 km National network Single stations ATG array EMV LIENZ BNALP HASLI FUSIO BERNI GIMEL
High-gain seismic stations, 2005
BERT AIGLE WIMIS BALST PLONS FUORN SALAN MUGIO GRYON BRANT
measurement errors or travel time calculation errors are ex-plicitly incorporated in terms of probability density functions. These methods not only provide a complete description of un-certainty estimates, but can also be used with any available ve-locity model and method of travel time calculation. The P-wave velocity model used in this context was derived from a 3D tomographic inversion of local earthquake data with con-straints from controlled source seismics (Husen et al. 2003). A 3D S-wave velocity model is not available yet, so that the S-ve-locities are calculated from the P-velocity using a Vp/Vsratio of 1.71. In regions where it is well-constrained, the 3D velocity model gives more accurate ray paths, in particular at larger dis-tances and for arrivals refracted at the Moho. This permits more reliable focal depth determinations, even for events where the minimal epicentral distance is large relative to the focal depth.
Seismic activity during 2005 Overview
During 2005, the Swiss Seismological Service detected and located 611 earthquakes in the region shown in Figure 2. Based on such criteria as the time of occurrence, the loca-tion, the signal character or on direct informaloca-tion, 96 addi-tional seismic events were identified as quarry blasts and two as landslides.
Magnitude values of the events recorded in 2005 range be-tween ML0.1 and 4.9. The events with ML≥ 2.5 and the crite-ria used to assign the quality rating for the given locations as well as the corresponding estimated location accuracy are list-ed in Tables 2 and 3.
Where available, the epicentral coordinates and focal
depths given in Table 2 are based on the results that include additional data from foreign networks and on 2-D ray-tracing. For the stronger events, the traditional determination of focal mechanisms from the azimuthal distribution of first-motion polarities (faultplane solutions) has been complemented by a moment tensor based on full-waveform inversion. For these events we list in Table 4 the moment magnitude (Mw) in addi-tion to the local magnitude (ML).
Moment magnitude is calculated from the seismic moment M0 obtained from the moment tensor inversion using the
relation Mw = (2/3) log M0 – 6, where M0 is given in N-m
(Hanks & Kanamori 1979). In general a full-waveform inver-sion is performed for all events with ML≥ 3.5, but in some cases, with recordings with particularly good signal-to-noise ratios at low frequencies, it has been possible to invert for the moment tensor even for events with ML< 3. The complete set of moment tensors calculated by the Swiss Seismological Ser-vice, including plots of all waveform fits, is available on line (http://www.seismo.ethz.ch/mt/). More comprehensive and de-tailed explanations of the data analysis procedures are given in previous annual reports (e.g Deichmann et al. 2004) and can be downloaded from our website (Introduction.pdf under Reports at http://www.seismo.ethz.ch).
Figure 3 shows the epicenters of the 770 earthquakes with ML≥ 2.5, which have been recorded in Switzerland and sur-rounding regions over the period of 1975–2005. The chosen magnitude threshold of 2.5 ensures that the data set is com-plete for the given period and that the number of unidentified quarry blasts and of badly mislocated epicenters is negligible. These events represent less than 10 % of the total number of events detected during that time period in the same area. In what follows, we present the highlights of the seismic activity observed during 2005.
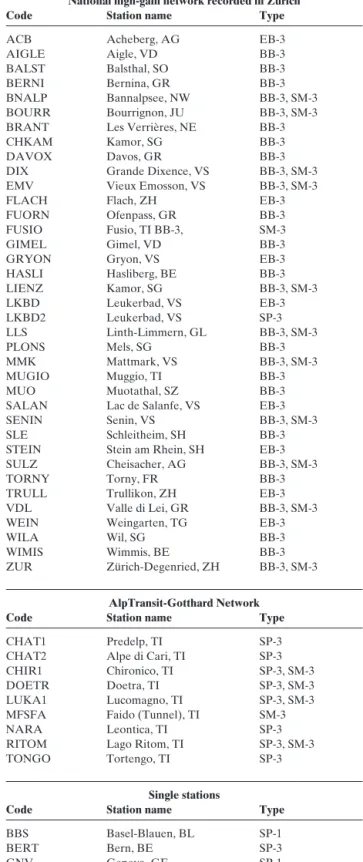
Fig. 2. Epicenters and focal mechanisms of earthquakes recorded by the Swiss Seismological Service during 2005. Epicenters of earthquakes mentioned in the text are Bad Ragaz (Ba), Bisistal (Bi), Brugg (Br), Faido (Fa), Grindel-wald (Gr), Riemenstalden (Ri), Rumisberg (Ru), Vallorcine (Va). 6 6 7 7 8 8 9 9 10 10 46 46 47 47 50 km Br Ru Gr Bi Ri Va Fa Ba
ing nodal plane of the moment tensor is similar to the one ob-tained from the faultplane solution, the strike and dip of the other nodal plane deviate by 16 and 22 degrees from the nodal plane compatible with the observed first-motion polarities.
The Rumisberg mainshock was preceded by a magnitude ML2.9 event on May 8th (Table 2) and a magnitude ML0.9 event on May 9th. Whereas the latter was probably located in the immediate vicinity of the mainshock and can therefore be considered a foreshock, the former was located 3–4 km further to the NE near Klus (SO), so that its relation to the mainshock is less evident. A total of 20 aftershocks were detected: after a series of 6 events with magnitudes ranging between 0.9 and 2.4 in the first 24 hours after the main event, sporadic activity, in-cluding an event of magnitude ML2.6 on July 21st, continued over the rest of the year (Table 2).
Bad Ragaz
The ML2.9 event of May 27th near Bad Ragaz (Table 2 and Fig. 2) is not very spectacular in itself. However, it is inter-esting, because its hypocenter coincides with that of a ML3.6 earthquake that occurred on February 23rd, 2000, and of an-other ML2.9 event on January 30th, 2001 (Baer et al. 2001; Deichmann et al. 2002). In fact, all three events seem to be part of a cluster that has been active off and on since the year 1998. From the broad-band signals of the event of 2005 it was possible to compute the moment tensor (Fig. 5). With a mo-ment magnitude Mw2.8 the corresponding focal mechanism is practically identical to that of the mainshock in the year 2000 (Baer et al. 2001).
Vallorcine
The strongest event of 2005 in the region covered by the map in Figure 2 occurred on September 8th, 13:27 local time. The
Date & Time Lat. Lon. X / Y Depth Mag. Q Location UTC [°N] [°E] [km] [km] [ML] 2005.01.19 14:46:51 47.365 7.174 580/246 3 2.6 B Saint Ursanne, JU 2005.02.27 08:20:15 47.345 9.828 780/246 1 2.5 B Mellau, A 2005.03.16 03:41:31 47.389 6.962 564/249 8 2.7 A Chevenez, JU 2005.05.08 14:29:40 47.291 7.681 618/238 25 2.9 A Klus, SO 2005.05.12 01:38:05 47.267 7.657 616/235 25 4.1 A Rumisberg, BE 2005.05.19 14:56:54 46.152 7.450 601/111 2 2.5 B Saint-Martin, VS 2005.05.19 17:16:28 45.943 8.195 659/ 88 10 2.9 B Cima Capezzone, I 2005.05.27 17:22:44 47.034 9.509 757/211 8 2.9 A Bad Ragaz, SG 2005.06.24 16:20:57 46.615 10.114 805/166 1 2.5 A Piz Quattervals, GR 2005.07.04 23:02:35 47.221 10.432 827/234 6 2.7 D Arlberg, A 2005.07.10 18:44:21 46.835 8.969 717/188 1 2.6 A Selbsanft, GL 2005.07.21 03:20:33 47.269 7.657 616/235 25 2.6 A Rumisberg, BE 2005.09.01 05:28:20 46.388 6.320 514/138 1 2.6 B Nyon, VD 2005.09.08 11:27:17 46.032 6.897 558/ 98 7 4.9 A Vallorcine, F 2005.09.08 11:53:10 46.031 6.905 559/ 98 6 3.0 A Vallorcine, F 2005.09.08 14:10:02 46.033 6.897 558/ 98 7 2.9 A Vallorcine, F 2005.11.12 19:31:16 47.523 8.166 655/264 20 4.1 A Brugg, AG 2005.12.03 03:31:41 46.651 9.998 796/170 4 2.5 B Brail, GR 2005.12.30 16:50:01 46.623 9.835 783/166 4 2.7 B Albulapass, GR
Table 2. Earthquakes with ML≥ 2.5. The focal
depths of the earthquakes for which focal mecha-nisms have been calculated are based on 2-D ray-tracing or on additional data from foreign networks.
Rating Criteria Uncertainty
Q GAP DM H Z (degrees) (km) (km) (km) A ≤ 180 ≤ 1.5×Z ≤ 2 ≤ 3 B ≤ 200 ≤ 25 ≤ 5 ≤ 10 C ≤ 270 ≤ 60 ≤ 10 > 10 D > 270 > 60 > 10 > 10 Table 3. Criteria and location uncertainty corresponding to the quality rating (Q) of the hypocentral parameters in Table 2. GAP = largest angle between epicenter and two adjacent stations; DM = minimum epicentral distance; H = horizontal location; Z = focal depth.
Significant earthquakes of 2005 Rumisberg – Balsthal
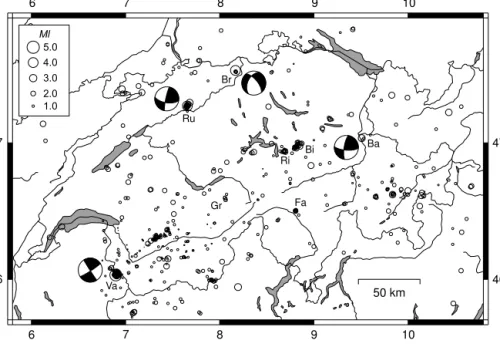
The first of the three ML> 4 events in 2005 occurred on May 12th at 03:38 local time. The epicenter was located near the town of Rumisberg on the southern edge of the Jura Moun-tains between the cantons Solothurn and Bern. Computed magnitudes are ML4.1 and Mw3.7. The epicentral intensity I0
reached IV (EMS98), and intensities of III and IV were re-ported from across most of northwestern Switzerland (Fig. 4 top). Such a large area of perceptible shaking for this event of moderate magnitude is due to its large focal depth of 25 km. This value is well-constrained by P- and S-wave arrivals at sta-tion BALST located 8 km from the epicenter and at several strong-motion stations at distances around 30 km in the Basel region. It is also confirmed by 2-D ray-tracing of Pn arrivals at several stations in eastern Switzerland.
The faultplane solution based on first-motion polarities cor-responds to a strike-slip mechanism with NW-SE and NE-SW oriented P- and T-axes, typical of northwestern Switzerland. The full-waveform inversion results in a moment tensor with a stronger thrust component (Figure 5). Whereas the E-W
strik-computed magnitudes are ML4.9 and Mw4.5. Its epicenter was located near the village of Vallorcine, on the French side of the border along the road between Martigny and Chamonix. The cracks in the walls of several houses and the numerous rockfalls along roads in the region north of the epicenter cor-respond to a maximum intensity of V (EMS98). It was clearly felt also over most of western Switzerland. A comprehensive macroseismic map that includes also observations in France and Italy is in preparation.
The moment tensor derived from a full-waveform inver-sion of a large number of broad-band records corresponds to a strike-slip mechanism with NNE-SSW and WNW-ESE trend-ing P- and T-axes (Figure 5). To study the relation of this earthquake and its aftershocks to the known faults in the re-gion, a temporary seismograph array was deployed in the epi-central area immediately following the mainshock (Fréchet et al. 2006). Over 300 events were recorded during the one-month campaign, and the Swiss national network routinely de-tected more than 110 aftershocks until the end of the year. Only two of these aftershocks reached a magnitude ML> 2.5 (Table 2). The routinely calculated focal depths of 6 and 7 km for the mainshock and the two strongest aftershocks listed in Table 2 are based on arrivals at Swiss stations alone. Because of the poor azimuthal station distribution, these values are poorly constrained. First results of the aftershock monitoring
campaign suggest that a focal depth of 3–5 km is more likely (Thouvenot et al. 2006).
Brugg
The third earthquake to cause shaking felt over a large region in 2005 occurred on November 12th at 20:31 local time. Its epicen-ter was located near the village of Mönthal (AG), 4 km W of Brugg. Computed magnitudes are ML4.1 and Mw3.6. Shaking intensity of IV (EMS98) was reported not only from the epicen-tral region, but also from many locations across most of northern Switzerland (Fig. 4). Just as in the case of the Rumisberg event, the wide area over which this event was felt is due to the relative-ly large focal depth. In fact, both the routinerelative-ly calculated depth, which is well constrained by P- and S-arrivals at stations SULZ and ACB located at epicentral distances of 4 and 9 km, as well as the depth resulting from 2-D ray-tracing give a value of 20 km.
The source location of this earthquake coincides within the location uncertainty with the ML4.0 event of June 28th, 2004 (Baer et al. 2005). This is illustrated by the seismograms in Fig-ure 6(a): the identical arrival-time difference between the S-and P-onsets as well as the striking similarity of the waveforms of the S-phase imply that the hypocenters of the events of 2004 and 2005 are located at the same distance from station SULZ and that the paths between source and station are practically Location Date & Time Depth Mag. Plane 1 Plane 2 P-Axis T-Axis
[UTC] [km] Strike/Dip/Rake Az/Dip
Rumisberg 2005/05/12 01:38 25 ML4.1 098/63/ 172 192/83/ 027 322/13 058/24 24 Mw3.7 101/60/ 146 208/61/ 034 335/00 065/44 Bad Ragaz 2005/05/27 17:22 9 Mw2.8 189/75/ 019 094/72/ 164 321/02 052/24 Vallorcine 2005/09/08 11:27 8 Mw4.5 147/88/ 006 057/84/ 178 282/03 013/06 Brugg 2005/11/12 19:31 20 ML4.1 206/48/-034 320/65/-133 182/50 079/10 18 Mw3.6 191/50/-130 314/57/-045 167/57 071/04
Fig. 3. Epicenters of earthquakes with Magni-tudes ML≥ 2.5, during the period 1975–2005.
6 6 7 7 8 8 9 9 10 10 46 46 47 47 50 km
Table 4. Focal mechanism parameters based on first-motion polarities (lines with ML) and
the same. However, the different relative amplitudes of the P-and S-phases visible on the vertical components at station SULZ shown in Figure 6(b) are an indication that the focal mechanisms of the two events differ. In fact, both the faultplane solution based on first-motion polarities and the moment ten-sor derived from the full-waveform inversion give a normal faulting mechanism (Fig. 5), for which the orientation of one of the nodal planes differs significantly from the mechanism of previous year’s event (Baer et al. 2005). It is also interesting to note that the P-wave onset of the event of 2005 observed at sta-tion SULZ (Fig. 6(c)) exhibits a small precursor phase before the onset of the main P-pulse, whereas the seismogram of the event of 2004 starts with a simple single pulse. Given the close spacing of the two hypocenters and the fact that this precursor phase is visible also at other stations situated at different az-imuths relative to the source, this difference in signal character can not be due to path effects but is probably due to a more complex rupture process in 2005 than in 2004.
The mainshock in 2005 was preceded by a small foreshock (ML1.2) on August 2nd and was followed from November 13th to December 5th by four aftershocks with magnitudes be-tween ML0.6 and 1.5.
Seismic events and rockbursts in the new Gotthard tunnel In the Spring of 2004, a sequence of five small earthquakes (ML 0.9–1.4) occurred near Faido, TI. This sequence was not recog-nised as being anything unusual at first. It was only in June Fig. 4. Macroseismic observations for the events of Rumisberg (2005/05/12,
03:38 local time) and Brugg (2005/11/12, 21:31 local time). Each value repre-sents the macroseismic intensity (EMS-98) assigned to a single postal code zone. The black dot corresponds to the instrumental epicenter. The Swiss cartesian coordinate grid is labeled in km.
600 700 700 600 600 650 650 650 650 600 200 200 300 300 250 250 250 250 Brugg 2005-11-12 Rumisberg 2005-05-12
Fig. 5. Faultplane solutions (above) based on first-motion polarities and moment tensors (below) based on full-waveform inversion (lower hemisphere, equal area projection). In the faultplane solutions, solid circles correspond to compressive first motion (up) and empty circles to dilatational first motion (down); on the moment tensors, triangles show the station locations.
Brugg 2005.11.12
Rumisberg 2006.05.12
2005, after a magnitude ML1.9 earthquake at the same location that it became clear that these events were part of an ongoing sequence of small earthquakes whose time of occurrence and epicentral location correlate with some rather violent rock-bursts in a section of the new Gotthard railroad tunnel, which is still under construction. In fact during the course of 2005, the national seismic network detected and located eight other events with the same epicenter and with magnitudes between ML0.9 and 1.6. An additional event with ML1.0 occurred on November 10th, 3–4 km SE of the others, and it correlates with a rockburst in a segment of the tunnel close to the epicenter. Computed focal depths, though poorly constrained, suggest a shallow source located at a depth of less than 2 km. To examine the causal relation between the earthquakes, rockbursts and observed deformation of the tunnel cross-section, an additional temporary network of seismometers was deployed in the epi-central area in the Fall of 2005, under contract from AlpTran-sit-Gotthard AG. (Table 1 and Fig. 1). First results based on records from these stations confirm the shallow focal depth as well as the correlation between these earthquakes and the ob-served rockbursts in the tunnel.
Rain-induced seismicity
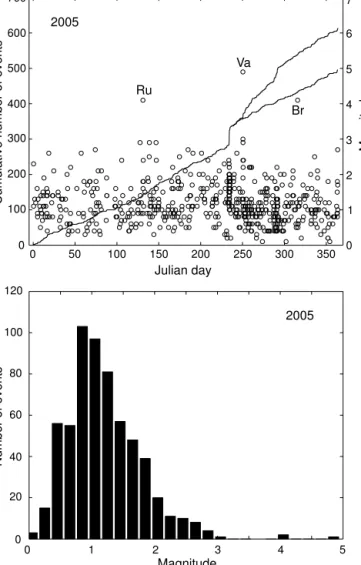
As can be seen in Figure 7, the curve of the cumulative number of events with time shows a pronounced jump at Julian day 235. This jump corresponds to an anomalous burst of activity that includes 51 events over a period of less than 48 hours that start-ed on the afternoon of August 22nd. Of these events, 39 oc-curred within 12 hours between 9 PM and 9 AM of the follow-ing day. Magnitudes of these events range between 1.0 and 2.4. Single earthquake swarms that produce a large number of small earthquakes over a period of a few days are quite common. What is however unusual about this concentration of seismic activity is that it occurred simultaneously over a very large re-gion that extends from Canton Schwyz in the northeast across the region around Stans and Alpnach, south of Lake Lucerne, all the way to Grindelwald in the Bernese Oberland. The main centers of activity were two separate clusters around Bisistal and south of Riemenstalden in Canton Schwyz (Fig. 2). Togeth-er these two clustTogeth-ers contributed more than half the total num-ber of earthquakes observed in those two days. Although focal depths of most of these events are poorly constrained by rou-tine location procedures, the shallow sources are confirmed at least qualitatively by both the signal character of the events
Fig. 6. Seismograms of the Brugg events of 2004 and 2005 recorded at station SULZ at an epicentral distance of 4 km. The traces are aligned at the arrival time of the P-wave: (a) horizontal displacement in EW direction, (b) vertical diplacement and (c)vertical velocity. Note the different time scales: (a) and (b) include both the and S-phases, while (c) shows an enlargement of the P-arrival alone. The identical S-P times and the similar waveforms of the S-phase seen in (a) are evidence for a similar source location. The different amplitude ratios between the P- and S-phases seen in (b) are due to differences in the focal mechanisms, and the small precursor before the P-wave onset of the event of 2005 seen in (c) is evidence for a more complex rupture process.
-1
-0.5
-1
0
0
1
1
2
2
3
0
3
4
4
5
5
6
6
7
0.5
7
P
P
S
SULZ-Z
SULZ-Z
SULZ-E
S
P
Time (s)
Time (s)
Time (s)
2005.11.12 2005.11.12 2005.11.12 2004.06.28 2004.06.28 2004.06.28(a)
(b)
(c)
(conspicuous surface waves even at short epicentral distances) and the fact that numerous events with magnitudes less than 2 were perceived by the population as loud bangs.
During this time, the region in which all of these earth-quakes ocurred, suffered very intense rainfalls, which caused massive floods and numerous landslides. Given this spatial and temporal coincidence and the shallow focal depths, it is thus likely that this unusual seismic activity was induced by a sud-den increase in pore pressure due to the intense precipitation. This hypothesis is furthermore supported by the fact that the two main centers of activity around Bisistal and Riemen-stalden are highly permeable karst regions, where surface waters and thus fluid pressure perturbations can propagate rapidly to greater depths.
Landslides
On May 14th at 18:49 local time, a sizeable landslide came down between Gondo and Zwischbergen, south of the Sim-plon Pass. The corresponding seismic signals were visible over most of the national network with amplitudes equivalent to a ML2.1 earthquake.
Twelve days later, on May 26th at 7:16 local time, the seis-mograph network detected another event with similar signal character and an epicenter west of station SALAN, in the re-gion of the Dents du Midi. Although it is higly unlikely that the recorded signals were produced by an earthquake or an explo-sion, it has not been possible to associate this event with a known landslide.
Discussion
In 2005, the total number of 19 events with ML ≥ 2.5 was below the 30-year average of 25 events in this magnitude cate-gory per year. However, this apparent activity deficit was compensated for by three earthquakes with MLbetween 4.1 and 4.9 and by the surge in microseismic activity associated with the intense precipitation at the end of August (Fig. 7). The main event of the year was certainly the ML 4.9 earth-quake of Vallorcine on September 8th and its large number of aftershocks.
Overall, as in previous years, most of the earthquakes oc-curred in the Valais and in Graubünden. However, two of the strongest events (Rumisberg and Brugg) occurred below the northern Alpine foreland. Routinely calculated focal depths for the 611 earthquakes recorded in 2005 range between close to the surface and 30 km, but only 44 of these hypocenters are deeper than 15 km. As in the past (e.g. Deichmann et al. 2000a), all of those deep sources with reasonably well-con-strained focal depths, and in particular the magnitude ML4.1 events of Rumisberg and Brugg, are located in the lower crust beneath the Jura Mountains or the Molasse Basin of northern Switzerland.
Acknowledgements
Monitoring the seismicity in a small country is not possible without interna-tional cooperation. We thank all individuals who kindly responded to our re-quests for information and data: W. Brüstle, S. Mellert and S. Stange of the Erdbebendienst des Landesamtes für Geologie, Rohstoffe und Bergbau Baden Württemberg in Freiburg, D. Spallarossa, S. Solarino and E. Eva of the University of Genova, R. DiStefano of the Istituto Nazionale di Geofisica e Vulcanologìa, Rome, F. Thouvenot of the Observatoire de Grenoble. We are also very grateful to our colleagues in the electronics lab, Ch. Bärlocher, M. Grieder, B. Rinderknecht, M. Schild and P. Zweifel, for their relentless efforts in ensuring the continuous reliability of the data acquisition systems and to A. Blanchard for logistic support. Financial support from the Nationale Genossenschaft für die Lagerung radioaktiver Abfälle, Nagra, for the opera-tion of the staopera-tions in northeastern Switzerland, as well as from the BLS Alp-Transit AG for the operation of the two stations near Leukerbad and from AlpTransit-Gotthard AG for the network around the southern segment of the new Gotthard Tunnel is gratefully acknowledged. We are also grateful to K. Ustaszewski for his helpful review.
Fig. 7. Earthquake activity during 2005: magnitude of each event and cumula-tive number of events (above); histogram of magnitudes (below). The events with ML> 4 are labled: Brug (Br), Rumisberg (Ru) and Vallorcine (Va). The
lower curve beyond Julian day 245 in the plot of the cumulative number of events represents the evolution in time without the Vallorcine sequence. The prominent step in the cumulative number of events at Julian day 235 is the contribution of the rain-induced seismicity between August 22nd and 24th.
0 50 100 150 200 250 300 350 0 1 2 3 4 5 6 7 700 600 500 400 300 200 100 0 Cumulative number of event s Julian day Magnitude Magnitude Number of event s 120 100 80 60 40 20 0 0 1 2 3 4 5 2005 Ru Va Br 2005
REFERENCES
BAER, M., DEICHMANN, N., FÄH, D., KRADOLFER, U., MAYER-ROSA, D., RÜTTENER, E., SCHLER, T., SELLAMI, S., SMIT, P. 1997: Earthquakes in Switzerland and surrounding regions during 1996. Eclogae geol. Helv. 90/3, 557–567.
BAER, M., DEICHMANN, N., BALLARINDOLFIN, D., BAY, F., DELOUIS, B., FÄH, D., GIARDINI, D., KASTRUP, U., KIND, F., KRADOLFER, U., KÜNZLE, W., RÖTHLISBERGER, S., SCHLER, T., SELLAMI, S., SMIT, P., SPÜHLER, E. 1999: Earthquakes in Switzerland and surrounding regions during 1998. Eclogae geol. Helv. 92/2, 265–273.
BAER, M., DEICHMANN, N., BRAUNMILLER, J., BALLARINDOLFIN, D., BAY, F., BERNARDI, F., DELOUIS, B., FÄH, D., GERSTENBERGER, M., GIARDINI, D., HUBER, S., KASTRUP, U., KIND, F., KRADOLFER, U., MARAINI, S., MATTLE, B., SCHLER, T., SALICHON, J., SELLAMI, S., STEIMEN, S., WIEMER, S. 2001: Earthquakes in Switzerland and surrounding regions during 2000. Eclogae geol. Helv. 94/2, 253–264.
BAER, M., DEICHMANN, N., BRAUNMILLER, J., BERNARDI, F., CORNOU, C., FÄH, D., GIARDINI, D., HUBER, S., KÄSTLI, P., KIND, F., KRADOLFER, U., MAI, M., MARAINI, S., OPRSAL, I., SCHLER, T., SCHORLEMMER, D., SELLAMI, S., STEIMEN, S., WIEMER, S., WÖSSNER, J., WYSS, A. 2003: Earth-quakes in Switzerland and surrounding regions during 2002. Eclogae geol. Helv. 96/2, 313–324.
BAER, M., DEICHMANN, N., BRAUNMILLER, J., HUSEN, S., FÄH, D., GIARDINI, D., KÄSTLI, P., KRADOLFER, U., WIEMER, S. 2005: Earthquakes in Switzer-land and surrounding regions during 2004. Eclogae geol. Helv. 98/3, 407–418.
DEICHMANN, N. 1990: Seismizität der Nordschweiz, 1987–1989, und Auswer-tung der Erdbebenserien von Günsberg, Läufelfingen und Zeglingen. Nagra Technischer Bericht, NTB 90-46, Nagra, Baden.
DEICHMANN, N., BAER, M., BALLARIN DOLFIN, D., FÄH, D., FLÜCK, P., KASTRUP, U., KRADOLFER, U., KÜNZLE, W., MAYER-ROSA, D., RÖTHLIS-BERGER, S., SCHLER, T., SELLAMI, S., SMIT, P., & GIARDINI, D. 1998: Earthquakes in Switzerland and surrounding regions during 1997. Eclogae geol. Helv. 91/2, 237–246.
DEICHMANN, N., BAER, M., BRAUNMILLER, J., BALLARINDOLFIN, D., BAY, F., DELOUIS, B., FÄH, D., GIARDINI, D., KASTRUP, U., KIND, F., KRADOLFER, U., KÜNZLE, W., RÖTHLISBERGER, S., SCHLER, T., SALICHON, J., SELLAMI, S., SPÜHLER, E., WIEMER, S. 2000a: Earthquakes in Switzerland and surrounding regions during 1999. Eclogae geol. Helv. 93/3, 395–406. DEICHMANN, N., BALLARINDOLFIN, D., KASTRUP, U. 2000b: Seismizität der
Nord- und Zentralschweiz. Nagra Technischer Bericht, NTB 00-05, Nagra, Wettingen.
DEICHMANN, N., BAER, M., BRAUNMILLER, J., BALLARINDOLFIN, D., BAY, F., BERNARDI, F., DELOUIS, B., FÄH, D., GERSTENBERGER, M., GIARDINI, D., HUBER, S., KRADOLFER, U., MARAINI, S., OPRSAL, I., SCHIBLER, R., SCHLER, T., SELLAMI, S., STEIMEN, S., WIEMER, S., WÖSSNER, J., WYSS, A. 2002: Earthquakes in Switzerland and surrounding regions during 2001. Eclogae geol. Helv. 95/2, 249–261.
DEICHMANN, N., BAER, M., BRAUNMILLER, J., CORNOU, C., FÄH, D., GIARDINI, D., GISLER, M., HUBER, S., HUSEN, S., KÄSTLI, P., KRADOLFER, U., MAI, M., MARAINI, S., OPRSAL, I., SCHLER, T., SCHORLEMMER, D., WIEMER, S., WÖSSNER, J., WYSS, A. 2004: Earthquakes in Switzerland and surrounding regions during 2003. Eclogae geol. Helv. 97/3, 447–458.
EVA, E., PASTORE, S., DEICHMANN, N. 1998: Evidence for ongoing extensional deformation in the western Swiss Alps and thrust-faulting in the south-western Alpine foreland. Journal of Geodynamics 26/1, 27–43.
FÄH, D., GIARDINI, D., BAY, F., BERNARDI, F., BRAUNMILLER, J., DEICHMANN, N., FURRER, M., GANTNER, L., GISLER, M., ISENEGGER, D., JIMENEZ, M.-J., KÄSTLI, P., KOGLIN, R., MASCIADRI, V., RUTZ, M., SCHEIDEGGER, C., SCHIBLER, R., SCHORLEMMER, D., SCHWARZ-ZANETTI, G., STEIMEN, S., SELLAMI, S., WIEMER, S., WÖSSNER, J. 2003: Earthquake catalog of Switzerland (ECOS) and the related macroseismic database. Eclogae geol. Helv. 96/2, 219–236.
FRÉCHET, J., THOUVENOT, F., FROGNEUX, M., DEICHMANN, N., CARA, M. 2006: An aftershock study of the ML4.9 Vallorcine (French Alps) earthquake
of 8 September 2005. European Geophysical Union XXIX General Assembly, Geneva, April 2006 (Abstract).
GIARDINI, D., WIEMER, S., FÄH, D., DEICHMANN, N., SELLAMI, S., JENNI, S. and the Hazard Team of the Swiss Seismological Service 2004: Seismic Hazard Assessment 2004. Swiss Seismological Service 81 pp.
HANKS, T. C. & KANAMORI, H. (1979). A moment magnitude scale, J. Geo-phys. Res. 84, B5, 2348–2350.
HUSEN, S., KISSLING, E., DEICHMANN, N., WIEMER, S., GIARDINI, D., BAER, M. 2003: Probabilistic earthquake location in complex three-dimensional velocity models: Application to Switzerland. J. Geophys. Res. 108, B2, 2077–2096.
KASTRUP, U., ZOBACK M.-L., DEICHMANN, N., EVANS, K., GIARDINI, D., MICHAEL, A.J. 2004: Stress field variations in the Swiss Alps and the northern Alpine foreland derived from inversion of fault plane solutions. J. Geophys. Res. 109, B1, doi:10.1029/2003JB002550B01402.
LEE, W. H. K. & LAHR, J. C. 1972: HYPO-71 a computer program for deter-mining hypocenter, magnitude and first motion pattern of local earth-quakes. U.S. Geol. Surv., Open-File Rep.
LOMAX, A., & CURTIS, A. (2001): Fast, probabilistic earthquake location in 3D models using Oct-Tree Importance sampling. Geophysical Research Abstracts 3.
LOMAX, A., VIRIEUXJ., VOLANTP., THIERRY-BERGE, C. (2000). Probabilistic earthquake location in 3D and layered models. In Advances in Seismic Event Location, edited by C.H. Thurber, and N. Rabinowitz, Kluwer Aca-demic Publishers, Dordrecht/Boston/London, pp. 101–134.
MAURER, H., BURKHARD, M., DEICHMANN, N., GREEN, A.G. 1997: Active Tectonism in the Western Swiss Alps. Terra Nova, 9, 91–94.
MÜLLER, B., ZOBACK, M.-L., FUCHS, K., MASTIN, L.G., GREGERSEN, S., PAVONI, N., STEPHANSSON, O., LJUNGGREN, C. 1992: Regional patterns of tectonic stress in Europe. J. Geophys. Res. 89, B13, 11’517–11’526. PAVONI, N. 1977: Erdbeben im Gebiet der Schweiz. Eclogae geol. Helv. 70/2,
351–370.
PAVONI, N. & ROTH, P. 1990: Seismicity and seismotectonics of the Swiss Alps. Results of microearthquake investigations 1983–1988. In: Deep Structure of the Alps. (Ed. by F. Roure, P. Heitzmann and R. Polino). Mem. Soc. geol. France, N. S. 156, 129–134.
PAVONI, N., MAURER, H., ROTH, P., DEICHMANN, N. 1997: Seismicity and seismotectonics of the Swiss Alps. In: Deep structure of the Swiss Alps, results of NRP 20, Birkhäuser, Basel, 241–250.
PLENEFISCH, T. & BONJER, K.-P. 1997: The stress field in the Rhinegraben area inferred from earthquake focal mechanisms and estimation of frictional parameters. Tectonophysics 275, 71–97.
RÜTTENER, E. 1995: Earthquake hazard estimation for Switzerland. Matér. Géol. Suisse, Geophys. Nr. 29, Schweizerische Geophysikalische Kommis-sion, ETH-Zürich, 106 pp.
RÜTTENER, E., EOGOZCUE, J., MAYER-ROSA, D., MUELLER, S. 1996: Bayesian estimation of seismic hazard for two sites in Switzerland. Natural Hazards 14, 165–178.
SÄGESSER & MAYER-ROSA 1978: Erdbebengefährdung in der Schweiz. Schweizerische Bauzeitung 78/7, 3–18.
THOUVENOT, F., FRÉCHET, J., FROGNEUX, M., DEICHMANN, N., CARA, M. 2006: The ML4.9 Vallorcine (French Alps) earthquake (8 September 2005): A
right-lateral strike-slip on the N60E-striking Loriaz Fault. First European Conference on Earthquake Engineering and Seismology, September 2006, (Abstract).
WALDHAUSER, F., KISSLING, E., ANSORGE, J., MUELLER, ST. 1998: Three-dimensional Interface Modeling with two-Three-dimensional Seismic Data: the Alpine Crust-Mantle boundary. Geoph. J. Int. 135, 264–278.
Manuscript received November 28, 2006 Published Online First January 12, 2007