HAL Id: hal-01990604
https://hal.uca.fr/hal-01990604
Submitted on 3 Feb 2021
HAL is a multi-disciplinary open access
archive for the deposit and dissemination of
sci-entific research documents, whether they are
pub-lished or not. The documents may come from
teaching and research institutions in France or
abroad, or from public or private research centers.
L’archive ouverte pluridisciplinaire HAL, est
destinée au dépôt et à la diffusion de documents
scientifiques de niveau recherche, publiés ou non,
émanant des établissements d’enseignement et de
recherche français ou étrangers, des laboratoires
publics ou privés.
Contrasting behavior of gas and aerosol scavenging in
convective rain : a numerical and experimental study in
the African equatorial forest
S. Cautenet, B. Lefeivre
To cite this version:
S. Cautenet, B. Lefeivre. Contrasting behavior of gas and aerosol scavenging in convective rain : a
numerical and experimental study in the African equatorial forest. Journal of Geophysical Research,
American Geophysical Union, 1994. �hal-01990604�
JOURNAL OF GEOPHYSICAL RESEARCH, VOL. 99, NO. D6, PAGES 13,013-13,024, JUNE 20, 1994
Contrasting behavior of gas and aerosol scavenging
in convective rain: A numerical and experimental study
in the African equatorial forest
S. Cautenet
LAMP/Centre National de la Recherche Scientifique/URA 267, Universit6 Blaise Pascal, Clermont, France B. Lefeivre
CRA/Centre National de la Recherche Scientifique/URA 354, Lannemezan, France
Abstract. A two-dimensional convective cloud model has been coupled with a
chemical model consisting
of the explicit prediction of five chemical species' SO2,
SO42-
, NH•-, 03, and H202. The model
takes
the scavenging
processes
into account.
We examine
the relationship
between
the liquid water content (LWC) and the chemical
concentrations
of atmospheric
trace elements
in convective
precipitation.
The model
results
compare
favorably with observations
(ABLE 2B and DECAFE experiments).
The modeled dilution curves were found to be nonlinear, in agreement with the DECAFE data. The model also accounts for the large differences in dilution effects
that exist between
gases
and aerqsols.
More generally,
this study shows
that within the
African equatorial
forest there are (1) a reduction
of aerosol
scavenging
efficiency
with
increasing
rain intensity (or LWCg); (2) a strong
impact of vertical profiles of
atmospheric
trace elements
on ground
rain concentrations;
(3) a difference
in
scavenging
efficiencies
according
to the origin of the elements
(gas or aerosol);
and (4)
a depletion of atmospheric
concentrations
during rainfall.
1. Introduction
Air pollutants are ultimately removed from the atmo- sphere by wet and dry depositions. The wet deposition, that is, absorption into droplets followed by droplet removal during precipitation, is the purpose of this study. The rainout scavenging efficiency depends on many processes. For aero- sols, they are mainly nucleation, Brownian diffusion, and impaction. For gases, they are absorption represented by Henry's Law, ionization, if it occurs, and chemical reactions in aqueous phase. The chemical composition of ground precipitation is the final result of the scavenging of atmo- spheric gases and particles by both cloud droplets (rainout) and rainfall (washout), with differences in collection effi- ciency determined by the phase of the removed species (gas or aerosol) and by the incloud and subcloud chemical,
dynamical,
and microphysical
processes
[Flossman
et al.,
1987; Tremblay, 1987]. Lacaux et al. [1992a] have shown that the chemical composition of rain at ground surface strongly depends on the precipitation type.
The liquid water content is one of the important input parameters of a cloud chemistry [Chameides and Davis, 1982]. Pandis and Seinfeld [1989] have shown that an increase in liquid water content (LWC) results in a decrease
of sulfate concentration in rain, but, nevertheless, to an increase of the removed total sulfate. For this reason, we
particularly focused on the relation between the ionic con- centration of chemical species analyzed in precipitation and
Copyright 1994 by the American Geophys!cal Union.
Paper number 93JD02712.
0148-0227/94/93JD-02712505.00
the ground mean weighted liquid water content LWCg (see
section 4 for complete definition).
Recently, data from the Dynamique et Chimie Atmosphe- rique en For6t Equatoriale (DECAFE) program [Fontan et al., 1992], and a collection of granulometric spectra record- ings of precipitation from June 1988 to June 1989 in the equatorial forest of North Congo (Eny616, 2ø5N; 18ø0E) led to the characterization of the physical (intensity R, LWC, number concentrations, and median volume diameter of raindrops) and chemical (12 chemical species analyzed) features of 67 rain events [Lefeivre, 1993]. A linear relation- ship was found between the species A concentration and
LWCg
in convective
rains
(LWCg
> 0.45 g m -3) during
the
wet season for most chemical species:
[A ]rain
-' a LWCg
- 1 + b
(1)
There are significant differences in the coefficients a and b according to the origin of the compounds, either gas (e.g.,
NH 3) or aerosol
(e.g., Mg2+).
The highly
soluble
species
exhibit the larger correlation coefficients. On the other hand, for the same original phase, the values of a and b differ very weakly, regardless of the chemical species.
For estimating the removal of an atmospheric chemical species A by the cloud droplets (rainout), the following
relationship is often used:
[A]rai
n: e[A]airLWC
-1,
(2)
where [A]ai r is the chemical content of species A in air
m-3), which
may be either
particulate
or gaseous;
[A]rain
is
the concentration of this species in rain, e is the in-cloud scavenging efficiency, and LWC is the liquid water content of rain at any level. This relationship was originally proposed
13,014 CAUTENET AND LEFEIVRE: AEROSOL AND GAS SCAVENGING
for the scavenging of aerosols [Junge, 1963] and was later adapted to atmospheric gases [Brirnblecornbe and Dawson, 1984; Andreae et al., 1988]. Recent measurements clearly
showed a dilution effect for LWC in convective rain events
[Lacaux et al., 1992a], that is, departures from linearity due to dilution, so that it is suspected that • is not a constant. The dilution effect is more important for aerosol scavenging than for gas scavenging.
These experimental data originate from the DECAFE
experiment but could presumably be more general in equa-
torial convective rains. In order to retrieve these features
and to identify the main processes influencing the relation-
ship between the concentration of a chemical species in precipitation, [A], and the ground liquid water content LWCg, we have used a two-dimensional convection cloud model coupled to a chemical sulfur model to examine the
scavenging
of SO2 (gas)
and SO42-
(aerosol).
After a short description of the model in section 2 and of the input data in section 3, we compare the model results
with experimental data from the DECAFE experiment and
from the ABLE 2B experiment [Garstang et al., 1990]. In
section 4, we investigate the physical (LWCg - R) and the chemical (wet deposition and concentration) results using
DECAFE and ABLE 2B data. Finally, in section 5, we focus on the relationship between LWCg and chemical content.
2. The Model
Following Ruthledge et al. [1986] and Taylor [1989], we have used a chemistry model coupled with a convective cloud model. This method allows us to represent the roles of
the main physical processes in the simulation of the complex
scavenging mechanisms in and below the clouds, commonly
denoted by the term "wet deposition."
2.1. Cloud Convection Model
The model is a two-dimensional (x, z), time-dependent,
Eulerian cloud model. The spatial grid resolution is 200 m.
The dimension of the modeled region is 6.6 km in both the
vertical and the horizontal. The basic framework of this
study is described in detail by Liu and Orville [1969] and Orville and Kopp [1977]. Parameterizations are used to
account for water phase changes (vapor, liquid, and ice). Five bulk water categories are considered here: vapor, cloud
water, rain water, ice, and graupel. These hydrometeors
interact through a variety of physical processes (e.g., con- densation, evaporation, autoconversion, coalescence, accre-
tion, collection, freezing, timing, and melting). The basic assumptions in the microphysical processes used are (1) a monodisperse, time invariant cloud droplet population in
which the total number of droplets is fixed; (2) droplet
coalescence (autoconversion) computed using the Kessler
[ 1969] formulation with a threshold; and (3) rain and graupel
distributions following Marshall and Palrner's [1948] distri-
bution.
2.2. Chemistry Model
The present model deals primarily with sulfur chemistry
because this compound is present under both phases, gas
and aerosol, which will illustrate the contrasting behavior of
gas
(SO2)
and aerosol
(SO42-)
in scavenging.
Five chemical
species
are explicitly
carried:
SO2, SO42-,
NH•, 03 and
H202. The chemical species may exist in several forms: as
gases
(SO2, 03 and H20:), aerosols
(NH4+):SO4:-,
or as
dissolved
species
(SO:, SO4:-,
NH4+,
03 and H:O2) within
cloud water, rain water, ice, or graupel. The equations which describe the transformations between these forms are given by Taylor [1989]. All chemistry fields are advected. The principal assumptions are the following:
1. Over the relatively short timescales (<lh) that charac- terize a convective cloud life, sulfur chemistry is dominated by aqueous phase processes, and therefore gas-phase chem-
istry can be neglected. This assumption is widely accepted
[Calvert et al., 1985; Ruthledge et al., 1986].
2. With this condition, aqueous phase photochemical
reactions are assumed to have a small effect on sulfate
production.
Precipitation
scavenging
of (NH4+)2SO•-
exhibits
several
pathways' scavenging by nucleation or Brownian diffusion in
cloud water and scavenging by impaction in rain water. For
precipitation scavenging of gases, the transfer in water
follows effective Henry's law, followed by an oxidation reaction in cloud water or rain water. The following equa- tions are the main equations of the chemistry model:
K• KAi KA2
SO2(g)<
•' SO2.H20
• • HSO3-
+ H + • • SO32-
+ 2H
+,
where
K• is 1.23
M atm
-1, KA1 is 1.23 10
-2 M, and
KA2
is
6.61 10 -8 M [Seinfeld,
1986];
d[S(IV)] d[S(VI)]
... {k0[SO2.H20 ]
dt dt
+ k•[HSO3-I
+ k2[SO32-1}
[O3],
where
k0 is 2.4 10
4 M -• s -1, k• is 3.7 10
5 M-•s -• and
k 2
is 1.5 10
9 M-•s -• [Seinfeld,
1986];
d[S(IV)] d[S(VI)] {k[H +][H202][HSO3-l}
dt dt 1 + K [H +]
where k is 7.45 10
7 M-•s -• and K is 13 M -• [Seinfeld,
1986].
With such a model, we can simulate only isolated clouds,
not larger-scale phenomena. However, this limitation is unimportant here because, in the region under study, no spatially average rainfall or chemistry data are routinely
available: a cloud convection model is a suitable tool to
investigate data from a single station. Spatial integration of equatorial atmospheric chemistry is beyond the scope of the present paper. Moreover, although sulfurous compounds could seem not to be representative of the African chemistry
(less, for example, than nitrogeneous or carbonaceous spe-
cies), they are present under both phases, gas and aerosols,
so that the modeling of the dilution effect is interesting.
3. Model Initialization 3.1. Atmospheric Soundings
Owing to a lack of experimental local atmospheric sound-
ings from DECAFE, we have used as model input a sound-
ing which characterizes the wet season in equatorial Ama- zonia, taken from ABLE 2B data [Schrnit et al., 1990]. The
chosen profile was recorded on May 5, 1987, at 1200 LT in
Belem (1.4øS, 48.5øW). It has been slightly modified so as to
CAUTENET AND LEFEIVRE: AEROSOL AND GAS SCAVENGING 13,015 1 400 600 800 1 ooo lO 20 30 -(c) 4OO • 600 a. 800 1000 2 lO ZO 30 T(C) 4OO 600 800 1000 10 ZO 30 T(C) 400 600 800 1000 4 400 30 T(C) -: 600 800 1000 5 10 20 10 20 30 T(C)
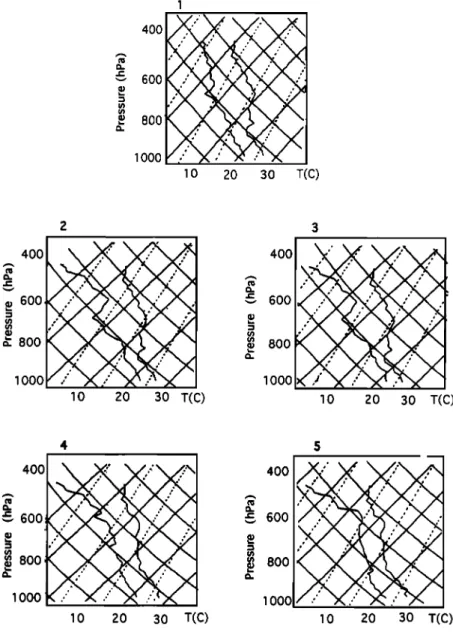
Figure 1. Initial soundings (emagram) for the five runs.
profiles leading to five different cloud development and precipitation regimes which cover the DECAFE experimen- tal mean weighted ground liquid water content LWCg range (see section 4). The initial profiles are shown in Figure 1.
3.2. Chemical Atmospheric Profiles
Since
atmospheric
chemical
profiles
of SO2 and SO4
•-
aerosol were not available at Eny616, the vertical distribu-
tions of these species were taken from ABLE 2B measure-
ments [Andreae et al., 1990a]. We have used for all runs an
initial H20: of 1.5 ppb over the entire domain, correspond- ing to the initial conditions proposed by Lelieveld and
Crutzen [1990] for equatorial latitudes. Two scenarios are
considered:
3.2.1. ABLE 2B mean profiles or profile 1. The initial
SO: and SO¬- profiles,
denoted
as curve
a in Figure
2, are
characteristic of equatorial forest sulfur emissions by soil
and vegetation which appear to be similar in both Amazo- nian and African equatorial forests [Bingeruer et al., 1992]. The profile of 03 (curve a in Figure 3) corresponds to the
average wet season profile in Amazonia [Kirchhoff et al.,
1990]. The results of this first simultions series will be
compared in subsection 4.2.1. to the mean rain sulfate
concentration
(1.6 geq 1-1) in Amazonian
forests
in the wet
season [Andreae et al., 1990b].
3.2.2. ABLE 2B profiles with biomass burning or profile
2. The mean sulfate concentration of convective rains in
North and South
Congo
(8.5 /xeq 1-1 and 6.2 /xeq 1-1
,
respectively) during the rainy season is more than 4 times the
value obtained
during ABLE 2B (1.6 geq l-l). Congo
precipitation also shows increased concentrations and wet
depositions
of NO•-, C20¬- and NH• as compared
to
Amazonia precipitation especially during the dry season
[Lacaux et al., 1991, 1992a, b; Lefeivre, 1993]. These au-
thors showed that such high chemical concentrations in rain
can originate
from the emission
of gaseous
(SO2,
NOy, NH3)
and particulate
(SO•
2-, NO•-, C20•
2-, and NH[) com-
pounds by savanna fires of both southern and northern hemispheres which are systematically advected over the African equatorial forest by Intertropical Convergence Zone mechanisms. This observation is supported also by several
13,016 CAUTENET AND LEFEIVRE: AEROSOL AND GAS SCAVENGING 5000 3000 1000 b .010 .030 SO 2 (ppb) 5000 b •- 3000 • I
1000 •
a
\
i o. .lO .20 SO 4 (ppb)Figure 2. (top) Initial SO 2 and (bottom) (NH4)2SO 4 pro-
files [Andreae et al., 1990]. Curve a shows ABLE 2B mean
profiles (or profile 1); curve b shows dust episode (ABLE 2B) on April 29, 1989 (or profile 2); curve c shows back- ground profiles (SO 2 = 7 ppt; (NH4)2SO 4 = 11 ppt).
experimental studies during DECAFE in 1988 which proved that a synoptic transport of burning residues during the dry season actually increases the concentration of 03, CO [Andreae et al., 1992], hydrocarbons [Rudolph et al., 1992]
and organic acids [Helds et al., 1992] between 1 and 3 km in
altitude in the tropospheric layer.
In order to illustrate the model response to such an enrichment due to advection processes, we have modified
the initial ABLE 2B profiles
of SO2 and SO42-
(curve
b in
Figure 2) using the vertical distribution of sulfur dioxide and
sulfate from the dust episode of April 29, 1989 [Andreae et al., 1990a]. These modified profiles are referred to as profile 2. The influence of 03 enrichment on the aqueous oxidation is also studied using the 03 profile issued from DECAFE 88 experiment (curve b in Figure 3) during the dry season [Cros
et al., 1991]. The results of these simulations are discussed in
Section 4.2.2.
4. Results and Discussion
For each of the primary variables calculated by the model (liquid water content at ground level LWCg, rainfall height H, precipitation rate R, wet deposition, and species concen- tration), two types of results are presented:
1. Global results represent an average over all the grid
points on the ground for rainfall that had a threshold of 0.1 mm h -•.
2. When comparing model results with local measure-
ments, we used results at the center of the ground domain. These data are referred to as "central point" results.
Finally, in order to study the relationship between chem- ical concentration and liquid water content, we used the ground mean weighted liquid water content LWCg. This
value is averaged for each rain event and is calculated as
follows:
LWCg = EHi LWCgi/E(Hi)
where Hi (in millimeters) is the height of rain recorded or modeled at ground level every minute. The use of Hi as a weighting coefficient tends to give more representative val-
ues than the arithmetic means because it takes into account
the respective contributions of the stratiform and the con-
vective parts to the total amount of water, therefore higlight-
ing the experimental rain events. 4.1. Physical Parameters LWCg, R
The measurements of liquid water content were obtained
using a RD69 disdrometer [Campistron et al., 1987], which measures the drop size spectrum of the rain at 1-min intervals. The rain intensity data were recorded with an
automatic precipitation collector [Lacaux and Warburton,
19801.
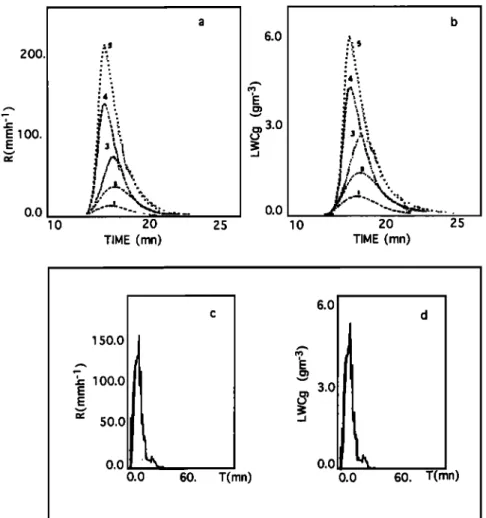
In Figures 4a and 4b, the evolution of LWCg (in grams per cubic meted and R (in millimeters per hour) for the central point are shown for the five soundings. Comparison with a typical experimental convective rain on June 24, 1988 (Fig-
ures 4c and 4d), suggests that the model curves are realistic
for LWCg and R except at the end of the simulation (after 20 min simulation time), where an asymmetry is observed in
experimental data.
Table 1 presents a summary of the main model results, along with a comparison with experimental data. A satisfactory agreement is found between the time-averaged model LWCg at
the central
point
(between
0.57 g m -3 and 4.56 g m -3) and its
experimental
values
(between
0.43 g m -3 and 3.89 g m-3).
For both model and experimental data, a least squares fit
was applied to the raindrop distribution in order to obtain a
6000 E 4000 2000 0 I lO. 50 10C 03 (ppb)
Figure 3. Initial 03 profile. Curve a shows the mean wet season profile in Amazonia [K&chho• et al., 1990], while
curve b shows ozone profile measured near Brazzaville on June 20, 1986, in dry season [Cros et al., 1991].
CAUTENET AND LEFEIVRE: AEROSOL AND GAS SCAVENGING 13,017 200. IE 100. E 0.0 6.0
3.0
0.0 _. 20 TIME (mn) lO 25 lO TIME (mn) 6.0 150.0E
• 3.0
O.Oll I
o.o• • o.oo.o 60. T(rnn) . . T(rnn)
Figure 4. Evolution
of (a) average
intensity
R and (b) average
liquid
water
content
LWCg for five runs
at the central point. Evolution
of experimental
intensity
R (c) and LWCg (d) of the convective
rain
collected
on June
24, 1988,
at Eny616
(North
Congo),
where
Rma
x = 154.3
mm h -1 and
LWCma
x = 5.8
-3
gm .
relationship between LWCg and R corresponding to a power
law of the form:
LWCg
= aR b
(3)
LWCg (in grams per cubic meted and R (in millimeters per hour) are the ground liquid water content and the
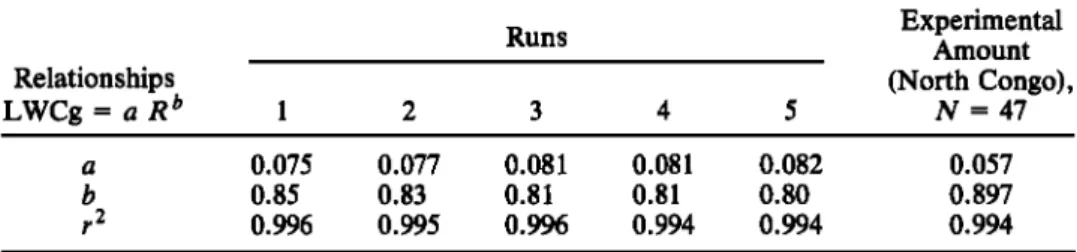
precipitation rate calculated from recorded or modeled val- ues every minute, respectively. The experimental and mod- eled values of LWCg and R are displayed in Table 2 and Figure 5. For the 47 convective events collected at Eny616, the values of coefficient a and of the exponent b are a =
0.057 and b = 0.90. The correlation coefficient is r = 0.997.
Table 1. Summary of the Main Model Results
Runs Average Rainfall 1 2 3 4 5 Experimental Amount (North Congo), N = 47 Global Dt, mn 11.3 14.5 17.3 13.8 15.5
R, mm h -1
8.7
24.1
30.3
85.4
126.0
LWCg, g m -3
0.5
1.1
1.9
3.0
4.1
Central Dt, mn 11.3 14.5 17.3 13.8 15.5 9-46.8 H, mm 1.1 3.4 7.2 8.1 14.6 1.9-35.7•, mm h -•
11.2
32.2
67.4
112.0
169.0
9.4-102.
LWCg, g m -3
0.6
1.3
2.4
3.5
4.8
0.4-3.8
Physical parameters Dt, duration of the ground precipitation; H, height; R and LWCg, mean weighted intensity and liquid water content.
13,018 CAUTENET AND LEFEIVRE: AEROSOL AND GAS SCAVENGING
Table 2. Values of a, b and r Values From North Congo
2 for Different
Runs
and for Experimental
Runs Relationships
LWCg = a R b
1
2
3
4
5
Experimental Amount (North Congo), N = 47 a 0.075 0.077 0.081 0.081 0.082 0.057 b 0.85 0.83 0.81 0.81 0.80 0.897 r 2 0.996 0.995 0.996 0.994 0.994 0.994Values of 5992-min recordings for N = 47 convective rain events (r is the correlation coefficient) are given.
Whereas the model exponent values (b) are slightly lower
than experimental values, the model coefficients (a) are
systematically higher than experimental, thereby compen- sating the lower values of b. As may be seen in Figure 5, the
model results agree with the experimentally determined
curve of R-LWCg. The ground convective cloud model
results compare satisfactorily to precipitation measurements
at Eny616.
4.2. Wet Deposition
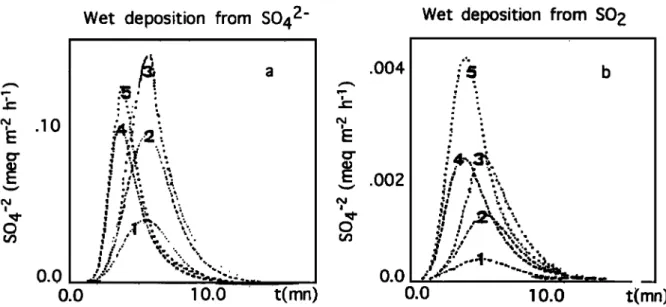
4.2.1. Model Runs with profile 1. The evolution of wet deposition from aerosol or gas scavenging is shown in Figure
6 for all runs. In these figures, we observe that their pattern follows the evolution of liquid water content and intensity (Figures 4a and 4b).
In Table 3, we show the principal time-averaged results,
which are as follows:
1. The sulfate concentration from aerosol [SO4A] is a decreasing function of precipitation rate (run 1: weak pre- cipitation; run 5: heavy precipitation). However, the same behavior is not found for sulfate originating from SO2 (gas), that is, [SO4G], which is almost constant: the dilution effect is more important for concentration of species from aerosol
scavenging than for concentration of species from gas scav- enging.
2. The model time-averaged central concentrations in total
sulfate, that is, originating form both gas and aerosol [SO4 T]
varies
between
0.58 geq 1-1 and 3.20/xeq
1-1 , while ABLE
2B experimental
value was 1.6 /xeq 1-1 for convective
precipitation [Andreae, 1990b.]
3. The model time-averaged central sulfate wet deposi-
tion
[SO4T]
varies
between
3.5/xeq
m
-2 and
7.4/xeq
m-_2•
while the ABLE 2B experimental value was 8.2 /xeq m
[Andreae, 1990B].
4.2.2. Model runs with profile 2. Figure 7 shows the evolution of wet deposition from aerosol and gas. For every run, the concentrations and depositions (Table 4) are larger than for profile 1, shown in Table 4. The (decreasing)
relationship between concentrations and precipitation rate is much less obvious. This may be explained as follows: in the previous case, sulfate concentrations in the cloud area are
low, and removel is achieved mainly below the cloud by
washout: a heavy rain is associated with a low ground
content and reverse. With profile 2, the in-cloud sulfate
concentrations are much greater, and rainout probably pre-
dominates. The scavenging is never complete; however
strong the rain rate may be (within the limits of our numer- ical experiment), sulfate is always available. This may be
seen in Figure 8; with profile 1, the atmospheric sulfate concentrations are severly depleted, whereas they remain high with profile 2. Moreover, rainout removal efficiency is
weaker than washout [Lin Xing and Charneides, 1990].
The central total concentration in surfate, [SO4T] , ranges
between
2.5 and 5.6 geq 1-1 (Table 4). These
values
are
lower than the concentrations measured during the wet
season in both South Congo [Lacaux et al., 1992a] and
North Congo
[Lefeivre,
1993]:
6.2 geq 1-1 and 8.5 geq 1-1 ,
respectively. Two main reasons can partly explain this underprediction by the model:
1. We did not consider an enrichment of tropospheric ozone concentration which is commonly associated with biomass burning emissions [Cros et al., 1988, 1991; Marenco
et al., 1990; Andreas et al., 1992].
2. The initialization
enriched
profiles
of SO2 and SO¬-
issued from measurements in Amazonia are only partly
representative of actual advection of combustion products
over the African equatorial forest because the savanna fires in Africa are of a much greater extent than in Amazonia.
In order to estimate the impact of a simulaneous tropo-
spheric enrichment of 03, we carried out a special run for sounding 4 with the experimental 03 profile (curve b in Figure 3) issued from DECAFE 88 in Congo during the dry
season [Cros et al., 1991]. This simulation (Table 4 and
Figure 9) illustrates the role of tropospheric ozone in gas- sulfate transformation (oxidation processes). Two runs have been performed using the same sulfate profiles (curve b in Figure 2) but with two different 03 profiles (Figure 3); in curve b of Figure 3, the 03 concentration has been multiplied by a factor of about 2 between 1500 and 5000 m. The increase in rain sulfate content from SO2(gas) amounts to 60%. This is much greater than the increase originating from the enrichment in SO2 itself, which is about 14%, with curve a of 03 (Figure 3). However, the concentration in total sulfate is
increased only slightly.
Moreover, the modeled sulfate rain content increases from
1.91
to 2.43 geq 1 -• when
profile
1 is replaced
by profile
2.
This enrichment is of the same order of magnitude as the experimental enrichment observed in convective rains in North Congo between the dry and wet seasons (1.4 to 2.7
#eq 1
-•) for the five characteristic
compounds
(SO4
•- , NOœ,
C204
•-, and NHf).
Since the model results seem realistic and rather consis-
tent with experimental ABLE 2B and DECAFE data, we compare in the following section the relationships between LWCg and sulfate from aerosol or gas with experimental
CAUTENET AND LEFEIVRE: AEROSOL AND GAS SCAVENGING 13,019
1.0 1
o.s
.
0.0
,
O. 6. 12. 18. R(mmh -1 ) 2.0 E O. 25. 4.0 0.0 50 O. 60. 120. R(mmh -] ) R(mmh-1 ) 6.04
_ o. 100. 200 8.0 O. 100. 250. R(mmh -1 ) R(mmh -1 )Figure 5. Correlation between LWCg and R for five runs (crosses) and for experimental data (dashed line) with l-rain interval integration.
regressions
relating
[A] and LWCg in North Congo
precip-
itations.5. Relation Between Liquid Water Content and
Chemical Concentration • • '
If e in Junge's relationship (equation (2)) is assumed to be
constant,
then the relationship
between
LWCg and concen-
tration
is linear, and the slope
is unity:
[A]rain0 LWCg
[A]
rain L WC•I
o
(4)Let the index 0 refer to: a fixed (reference) value. For
LWCg,
we choose
the 0eeakest
value,
that is, 0.57 gm
-3 . We
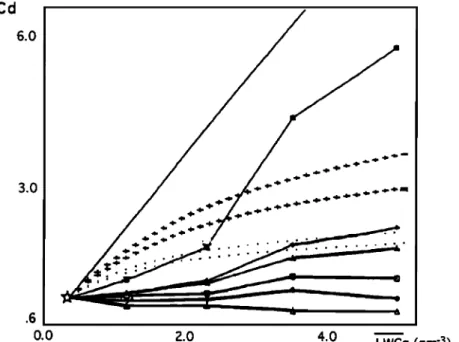
plotted the ratio of experimental concentrations C D = [A]rain0/[A]rain versus experimental LWCg at Eny616 (Figure 10) as well as for the five model runs."The ratio CD is referred to as the dilution coefficient. We notice different
13,020 CAUTENET AND LEFEIVRE: AEROSOL AND GAS SCAVENGING
.10
0.0
Wet deposition
from
S042-
ee ß
Wet deposition
from SO
2
, :.,- :: \\ • :• .I • .. •.. 10.0 .004 .002 0.0
0.0
t(mn)
0.0
Figure
6. Evolution
ofwet deposition
of sulfate
(meq
m -2 h -1) from (a) aerosol
and (b) gas
for five runs
using chemical profile 1.
patterns according to the origin (either aerosol or gas) of the trace elments, but the prominent feature is that none of the curves is linear. The agreement is satisfactory for aerosol, as
the model curves replicate the experimental dilution coeffi-
cient. The slopes of the curves for gas are much lower, and the agreement with model results is less satisfactory. Nev- ertheless, the modeled Cz• values for gas are lower than the modeled Co values for aerosols, which agrees with the experiment. The model curves depend on initial profiles and show an important influence of the vertical distribution and therefore of the origin of the scavenged compounds. To
compare
the scavenging
of SO2 and (NHf4SO¬- as a
function of LWCg, we carried out another run applied to
background
concentrations
in SO• and (NHf4SO¬- (7 and
11 ppt, respectively) uniformly distributed over the whole vertical profile (curve c in Figure 2). In this case, the dilution coefficient is weaker than for profile s 1 or 2. The concentra- tions [SO4G] and [SO4A] in the rain confirm the different behavior of sulfate from gas or aerosol in comparison with the dilution effect (Table 4 and Figure 10). These simulated and experimental results show the following:
1. The factor e cannot be a constant; otherwise, the curves
would be straight lines with a slope unity; linearity is observed only for weak values of LWCg, so that the Junge's relation could be valid for stratiform rains but not for strong
convective rains.
2. In both cases, gas and aerosol, a greater LWCg, that is, a greater rain rate R, following equation (3), results in a
weaker suflate content. Moreover, differences between
scavenging processes are obvious, depending on the phase (either gas or aerosol) of the pollutant; the decay of the amount of scavenged matter is slower for gases than for aerosols. In experimental curves, when LWCg is multiplied by about 10, the concentration for gas is only halved; on the other hand, it is reduced by a factor of 3.5 for aerosols. The dilution effect is therefore more important for aerosols than for gases. The scavenging processes are different.
6. Conclusion
We have presented a convection model coupled with a chemistry model describing sulfate scavenging processes in
Table 3. Ground Concentrations and Wet Deposition for Five Runs and Experimental Values From ABLE 2B
Runs Profile 1 1 2 3 4 5 Experimental Amount, ABLE 2B
Concentration,
laeq
1
-I
[SO4 A] 3.17 2.36 1.63 0.72 0.55 [SO4 G] 0.028 0.028 0.027 0.021 0.022 [SO4 T] 3.20 2.39 1.66 0.74 0.58 1.6 -2Wet Deposition, laeq m
[SO4 A] 3.49 8.05 11.77 5.82 7.15 [SO4 G] 0.031 0.095 0.195 0.170 0.284
[SO4 T] 3.52 8.15 11.96 5.99 7.43 8.2
Runs are initialized by chemical ABLE 2B profiles or profile 1 (curve a in Figures 2 and 3). SO4 A, SOn G, and SO4 T are the aerosol or gas originating sulfate and the total sulfate
CAUTENET AND LEFEIVRE: AEROSOL AND GAS SCAVENGING 13,021
N
.4O
.2O
Wet deposition
from
S042'
0.0
0.0
10.0
t(mn)
Wet deposition
from SO
2
.'
;
$
b
.004
/
'...
ß :: .'; %/ '., • .•..002
: /
..% '..
:.• ;.,
o. :.' .'_'; ,/ I ''- '.. ".. ,, ;.,0.0
.' _,;,-
...
,?,,.;'_..-*.-._
o.o lO.Ot•mn)
Figure 7. Evolution
of wet deposition
of sulfate
(meq
m -2 h-]) from (a) aerosol
and (b) gas
for five runs
using chemical profile 2.
the atmosphere. As a first step, this model has been cali- brated with the help of precipitation data from the DECAFE
experiment in equatorial Africa. This resulted in a relation between the liquid water content LWCg and the rain rate R
consistent with the experimental data. The second step consisted of a comparison beween model and experimental
estimations of ground sulfate content and wet deposition.
The experimental data set came from the DECAFE (Congo- lese forest) and ABLE 2B (Amazonian forest) experiments.
The suflate concentrations in the modeled rains resulting
from scavenging
of experimental
SO2 and SO4
2- vertical
distributions in the Amazonian forest during the wet season
are consistent with experimental measurements. The simu-
lation
of the enrichment
in SO2 and SO4
2- originating
from
advection process provided an explanation of the experi-
mental increase in chemical content of rains observed during
the dry season in the African equatorial forest (Congo) for
these
compounds
characteristic
of bush
fires (SO]-, NO•-,
C2042-,
and NH[).
Finally, we have proposed an explanation for the link
between the ground liquid water content LWCg and the
ground suflate content in rain water. We have retrieved the observed resutls, at least qualitatively. The relation between LWCg and sulfate content is different according to the origin (gas or aerosol) of the scavenged sulfur. in both cases the relationship is nonlinear; the dilution effect with increasing
LWCg is more important for aerosols than for gases. We show experimentally and numerically that the relationship between LWCg and Co is not linear, and therefore the use of
the Junge's relationship is somewhat risky for the cases of
convective rains.
The comparison of simulated and experimental [A]- LWCg relationships allowed us to identify the main pro- cesses responsible for the dilution effect, which are (1) in the
Table 4. Ground Concentrations for Five Runs and Experimental Values From DECAFE Runs Profile 2 1 2 3 4 5 , ,
Concentration,
Ixeq
1-1
[SO4 A] 5.6 5.13 4.26 2.82 [SO4 G)* 0.028 0.029 0.028 0.024 [SO4 T] 5.63 5.16 4.29 2.84 [SO4 A] 2.82 [SO 4 G]T 0.038 [SO4 T] 2.86 2.46 0.029 2.49 , , , Experimental Amount, DECAFE North Congo , 8.5*This run was initialized by chemical ABLE 2B profiles with biomass burning or profile
2 (curve b of Figure 2 and curve a of Figure 3).
?This
run was initialized
by profile
2 for SO2,
SO42-
(curve
b in Figure
2) and DECAFE
13,022 CAUTENET AND LEFEIVRE: AEROSOL AND GAS SCAVENGING
•6000
T
•6000
4000
a)
...
•'E4OOO
)
) I•
4)
5)
-ooo
0 3' ' '
.10
.ZO '
i
½
.10-
.ZO
(NH4)2S04 (ppb)•60001
.• b) Tr 6000
!oo
ooo
0 .020 .040 0 S02 (ppb) (NH4)2S04 (ppb) b) .040 S02 (ppb)Figure
8. SO
2 and
SO4
2- profiles
for five
runs
(dashed
line
for initial;
solid
line
for R maximum):
(a) using
profile 1; (b) using profile 2. Vertical segments represent the cloud vertical extent.
.0035 .002O .0010 ß . ß : : ß :g g g : C % '. 0 z ,t 6 l,t 16 18 : % -. e e '. ß
Figure
9. Evolution
of wet deposition
of sulfate
(meq
m -2 h -1) with curve
a indicating
chemical
profile
1 (Figures 2a and 3a), curve b indicating chemical profile 2 (curve b in Figure 2 and curve a in Figure 3); (c) chemical profile 2 for SO2 and SO4 (curve b in Figure 2) and DECAFE ozone profile (curve b in Figure
CAUTENET AND LEFEIVRE: AEROSOL AND GAS SCAVENGING 13,023 Cd 6.0 3.0 .6 0.0 2.0 4.0 LWCg (gm -3)
Figure 10. Model and experimental relationships between LWCg and dilution coefficient Co according to the origin and to the vertical distribution of the removed species. (Co = [A]raino/[A]rain). The solid diagonal line shows the case where e is constant (Co = LWCg/LWCg0). Solid triangles denote origin from aerosol, while open triangles denote origin from gas, run using background profiles of SOn (11 ppt) and SO2 (7 ppt), respectively. Solid diamonds denote origin from aerosol, while open diamonds denote origin from gas, run using profile 1. Solid squares denote origin from aerosol, while open squares denote origin from gas, run using profile 2. Plus signs denote origin from aerosol, and dotted line denotes origin from gas,
experimental DECAFE data.
aerosol case, the reduction of scavenging efficiency with increasing LWCg and (2) in aerosol or gas cases; the dilution effect during the last part of a rain event due to depletion of the compounds initially present in the atmosphere and the strong influence on the ground rain concentrations of the vertical distribution of atmospheric species and of the verti- cal development of clouds. Exponential profiles (originating
from ground level emissions) favor the dilution effect,
whereas the advection of enriched air aloft leads to a smaller dilution coefficient.
This study allowed us to confirm and to characterize the influence of physical parameters (LWCg and R) of convec- tive precipitating clouds on the rain chemical concentra- tions. If for any reason, it is possible to hypothesize reason- ably on origin (local or advected) and atmospheric phase (gas or aerosol) of the removed species, then the retrieval of the atmospheric concentrations from rainfall and chemical data is possible using a relationship such as the nonlinear one
derived in section 5.
Acknowledgments. The DECAFE experiment is supported by the action Phase Atmosph6rique des Grands Cycles Biog6niques of the Programme Environnement/CNRS. The authors express their grat- itude to E. C. Nickerson for his helpful comments.
References
Andreae, M. O., R. W. Talbot, T. W. Andreae, and R. C. Harris, Formic and acetic acid over the central amazon region, Brazil, A dry season, J. Geophys. Res., 93, 1616-1624, 1988.
Andreae, M. O., H. Berresheim, H. Bingemer, D. J. Jacob, B. L. Lewis, S. M. Li, and R. W. Talbot, The atmospheric sulfur cycle
over the Amazon Basin, 2, Wet season, J. Geophys. Res., 95,
16,813-16,824, 1990a.
Andreae, M. O., R. W. Talbot, H. Berresheim, and K. M. Beecher,
Precipitation chemistry in central Amazonia, J. Geophys. Res.,
95, 16,987-16,999, 1990b.
Andreae, M. O., A. Chapuis, B. Cros, J. Fontan, G. Helas, C. Justice, Y. J. Kaufman, A. Minga, and D. Nganga, Ozone and Aitken nuclei over equatorial Africa: Airborne observation during DECAFE 88, J. Geophys. Res., 97, 6137-6148, 1992.
Bingemer, H. G., M. O. Andreae, T. W. Andreae, P. Artaxo, G. Helas, D. J. Jacob, N. Mihalopoulos, and B.C. Nguyen, Sulfur gases and aerosols in and above the equatorial african rain forest, J. Geophys. Res., 97, 6207-6217, 1992.
Brimblecombe, P., and G. A. Dawson, Wet removal of highly soluble gases, J. Atmos. Chem., 2, 95-107, 1984.
Calvert, J. G., A. Lazrus, G. Kok, B. Heikes, J. Walega, J. Lind, and C. Cantrell, Chemical mechanisms of acid generation in the troposphere, Nature, 317, 27-35, 1985.
Campistron, B., G. Despaux, and J.P. Lacaux, A microcomputer data acquisition system for real-time processing of raindrop size
distribution measured with the RD69 disdrometer, J. Atmos.
Oceanic Technol., 4, 536-540, 1987.
Chameides, W. L., and D. D. Davis, The free radical chemistry of cloud droplets and its impact upon the composition of rain, J. Geophys. Res., 87, 4863-4877, 1982.
Cros, B., R. A. Delmas, D. Nganga, and B. Clairac, Seasonal trends of ozone in equatorial Africa: Experimental evidence of photo- chemical formation, J. Geophys. Res., 93, 8355-8366, 1988. Cros, B., D. Nganga, R. A. Delmas, and J. Fontan, Tropospheric
ozone and biomass burning in intertropical Africa, in Global Biomass Burning, edited by J. Levine, pp. 141-146, MIT Press, Cambridge, Mass., 1991.
Flossman, A. I., H. R. Pruppacher, and J. H. Topallian, A theorical study of the wet removal of atmospheric pollutants, Part II, The uptake and reistribution of (NH4)2SO4 particles and SO2 gas simultaneously scavenged by growing clouds drops, J. Atmos. Sci., 44, 2912-2923, 1987.
13,024 CAUTENET AND LEFEIVRE: AEROSOL AND GAS SCAVENGING
Fontan, J., A. Druilhet, B. Benech, and R. Lira, The DECAFE experiments: Overview and meteorology, J. Geophys. Res., 97,
6123-6136, 1992.
Garstang, M., S. Ulanski, S. Greco, J. Scala, R. Swap, D. Fitzjar- raid, D. Martin, E. Browell, M. Shipman, V. Connors, R. Harris, and R. Talbot, The Amazon boundary-layer experiment (ABLE 2B): A meteorological perspective, Bull. Am. Meteorol. Soc., 71(1), 1990.
Helas, G., H. Bingemet, and M. O. Andreae, Organic acids over equatorial Africa: Results from DECAFE 88, J. Geophys. Res., 97, 6187-6193, 1992.
Junge, C. E., Air Chemistry and Radioactivity, lnt. Geophys. Set., vol. 4, 382 pp., Academic, San Diego, Calif., 1963.
Kessler, E., On the redistribution and continuity of water substance in atmospheric circulations, Meteorol. Monogr., 10(32), 84 pp.,
1969.
Kirchhoff, V. W. J. H., I. M. O. Da Silva, and E. V. Browell, Ozone measurements in Amazonia: Dry season versus wet season, J. Geophys. Res., 95, 16,913-16,926, 1990.
Lacaux, J.P., and J. A. Warburton, The deposition of silver released from Soviet Oblako rockets in precipitation during the hail suppression experiment, Grssversuch IV, 1, Measurements
of background and a preliminary seeding test, J. Appl. Meteorol.,
19, 771-778, 1980.
Lacaux, J.P., R. Delmas, B. Cros, B. Lefeivre, and M. O. Andreae,
Influence of biomass burning emissions on precipitation chemistry
in the equatorial forests of Africa, in Global Biomass Burning, edited by J. Levine, 161-173 pp., MIT Press, Cambridge, Mass.,
1991.
Lacaux, J.P., R. Delmas, G. Kouadio, B. Cros, and M. O. Andreae, Precipitation chemistry in the Mayorob6 forest of Equatorial Africa, J. Geophys. Res., 97, 6195-6206, 1992a.
Lacaux, J.P., J. Loemba-Ndembi, B. Lefeivre, B. Cros, and R. Delmas, Biogenic emissions and biomass burning influences of the chemistry of the fogwater and stratiform precipitations in the african equatorial forest, Atmos. Environ. 26A, 541-551, 1992b. Lefeivre, B., Etude ex6rimentale et par mod61isation des caract6r-
istiques physiques et chimiques des pr6cipitatons collect6es en for•t 6quatoriale Africaine, Thdse de doctorat, Universitd de Paul Sabatier, 308 pp., Toulouse, France, 1993.
Lelieveld, J., and P. Crutzen, Influence of cloud photochemical processes on tropospheric ozone, Nature, 343, 227-233, 1990. Lin Xing, and W. L. Chameides, Model simulation of rainout and
washout from a warm stratiform cloud, J. Atmos. Chem., 10,
1-20, 1990.
Liu, J. Y., and H. D. Orville, Numerical modeling of precipitation and cloud shadow effects on mountain induced cumuli, J. Atmos.
Sci., 26, 1283-1299, 1969.
Marenco, A., J. C. Medale, and S. Prieur, Study of tropospheric ozone in the tropical belt (Africa, America) from STRATOZ and TROPOZ campaigns, Atmos. Environ., 24(11), 2823-2834, 1990. Marshall, J. S., and W. M. Palmer, The distribution of raindrops
with size, J. Meteorol., 5, 165-166, 1948.
Orville, H. D., and F. J. Kopp, Numerical simulation of the life history of a hailstorm, J. Atmos. Sci., 34, 1596-1618, 1977. Pandis, S. N., and J. H. Seinfeld, Sensitivity analysis of a chemical
mechanism for aqueous phase atmospheric chemistry, J. Geo- phys. Res., 94, 1105-1126, 1989.
Rudolph, J., A. Khedim, and B. Bonsang, Light hydrocarbons in the tropospheric boundary layer over tropical Africa, J. Geophys.
Res., 97, 6181-6186, 1992.
Ruthledge, S. A., D. A. Hegg, and P. V. Hobbs, A numerical model for sulfur and nitrogen scavenging in narrow cold-frontal rain- bands, Part I, Model description and discussion of microphysical fields, J. Geophys. Res., 91, 14,385-14,402, 1986.
Schmit, T. J., K. F. Brueske, W. L. Smith, and W. P. Menzel, Visible and infrared spin scan radiometer atmospheric sounder water vapor and wind fields over Amazonia, J. Geophys. Res., 95,
17,031-17,038, 1990.
Seinfeld, J. H., Atmospheric Chemistry and Physics of Air Polution, 738 pp., John Wiley, New York, 1986.
Taylor, G. R., Sulfate production and deposition in midlatitude continental cumulus clouds, Part II, Chemistry model formulation and sensitivity analysis, J. Atmos. Sci., 46, 1991-2007, 1989. Tremblay, A., Cumulus cloud transport, scavenging, and chemistry:
Observations and simulations, Atmos. Environ., 21(11), 2345-
2364, 1987.
S. Cautenet, LAMP, Centre National de la Recherche Scienti- fique, URA 267, Universit6 Blaise Pascal, Clermont, Ferrand,
63000, France.
B. Lefeivre, CRA, Centre National de la Recherche Scientifique, URA 354, Lannemezan, 65300, France.
(Received April 23, 1993; revised August 6, 1993; accepted September 22, 1993.)
![Figure 2) using the vertical distribution of sulfur dioxide and sulfate from the dust episode of April 29, 1989 [Andreae et al., 1990a]](https://thumb-eu.123doks.com/thumbv2/123doknet/14796455.604041/5.889.498.757.828.1056/figure-vertical-distribution-sulfur-dioxide-sulfate-episode-andreae.webp)

![Figure 7. Evolution of wet deposition of sulfate (meq m -2 h-]) from (a) aerosol and (b) gas for five runs](https://thumb-eu.123doks.com/thumbv2/123doknet/14796455.604041/10.889.112.779.87.395/figure-evolution-wet-deposition-sulfate-meq-aerosol-runs.webp)