HAL Id: hal-00300843
https://hal.archives-ouvertes.fr/hal-00300843
Submitted on 6 Jan 2004HAL is a multi-disciplinary open access
archive for the deposit and dissemination of sci-entific research documents, whether they are pub-lished or not. The documents may come from teaching and research institutions in France or abroad, or from public or private research centers.
L’archive ouverte pluridisciplinaire HAL, est destinée au dépôt et à la diffusion de documents scientifiques de niveau recherche, publiés ou non, émanant des établissements d’enseignement et de recherche français ou étrangers, des laboratoires publics ou privés.
Diurnal and annual variations of meteor rates at the
Arctic circle
W. Singer, J. Weiß, U. von Zahn
To cite this version:
W. Singer, J. Weiß, U. von Zahn. Diurnal and annual variations of meteor rates at the Arctic circle. Atmospheric Chemistry and Physics Discussions, European Geosciences Union, 2004, 4 (1), pp.1-20. �hal-00300843�
ACPD
4, 1–20, 2004 Meteor rates W. Singer et al. Title Page Abstract Introduction Conclusions References Tables Figures J I J I Back CloseFull Screen / Esc
Print Version Interactive Discussion
© EGU 2004 Atmos. Chem. Phys. Discuss., 4, 1–20, 2004
www.atmos-chem-phys.org/acpd/4/1/ SRef-ID: 1680-7375/acpd/2004-4-1 © European Geosciences Union 2004
Atmospheric Chemistry and Physics Discussions
Diurnal and annual variations of meteor
rates at the Arctic circle
W. Singer, J. Weiß, and U. von Zahn
Leibniz-Institute of Atmospheric Physics, 18225 K ¨uhlungsborn, Germany
Received: 15 October 2003 – Accepted: 11 November 2003 – Published: 6 January 2004 Correspondence to: W. Singer ([email protected])
ACPD
4, 1–20, 2004 Meteor rates W. Singer et al. Title Page Abstract Introduction Conclusions References Tables Figures J I J I Back CloseFull Screen / Esc
Print Version Interactive Discussion
© EGU 2004
Abstract
Meteors are an important source for (a) the metal atoms of the upper atmosphere metal layers and (b) for condensation nuclei, the existence of which are a prerequisite for the formation of noctilucent cloud particles in the polar mesopause region. For a better understanding of these phenomena, it would be helpful to know accurately the annual
5
and diurnal variations of meteor rates. So far, these rates have been little studied at polar latitudes. Therefore we have used the 33 MHz meteor radar of the ALOMAR observatory at 69◦N to measure the meteor rates at this location for two full annual cycles. This site, being within 3◦ of the Arctic circle, offers in addition an interesting capability: The axis of its antenna field points (almost) towards the North ecliptic pole
10
once each day of the year. In this particular viewing direction, the radar monitors the meteoroid influx from (almost) the entire ecliptic Northern hemisphere.
We report on the observed diurnal variations (averaged over one month) of meteor rates and their significant alterations throughout the year. The ratio of maximum over minimum meteor rates throughout one diurnal cycle is in January and February about
15
5, from April through December 2.3±0.3. If compared with similar measurements at mid-latitudes, our expectation, that the amplitude of the diurnal variation is to decrease towards the North pole, is not really borne out.
Observations with the antenna axis pointing towards the North ecliptic pole showed that the rate of deposition of meteoric dust is substantially larger during the Arctic NLC
20
season than the annual mean deposition rate. The daylight meteor showers of the Arietids, Zeta Perseids, and Beta Taurids supposedly contribute considerably to the June maximum of meteor rates. We note, though, that with the radar antenna pointing as described above, all three meteor radiants are close to the local horizon. This radiant location should cause most of these shower meteors to occur above 100 km
25
altitude. In our observations, the June maximum in meteor rate is produced, however, almost exclusively by meteors below 100 km altitude.
ACPD
4, 1–20, 2004 Meteor rates W. Singer et al. Title Page Abstract Introduction Conclusions References Tables Figures J I J I Back CloseFull Screen / Esc
Print Version Interactive Discussion
© EGU 2004
1. Introduction
A meteoroid is a small particle travelling in interplanetary space. In the case that it enters the Earth’s upper atmosphere its interactions with the air molecules give rise to an extended trail of ionization (detectable by radars) and, if the meteoroid is large and fast enough, to a brief streak of light (the visible meteor). As common in the literature,
5
we will apply the designation ’meteor’ in the following also to the radar-detected trail of ionization. The ablation of meteoroids during their high-speed entry into the Earth’s atmosphere is an important source for (a) the metal atoms of the upper atmosphere metal layers and (b) also for the formation of nanometer-sized condensation nuclei (CN). The existence of these CNs is a prerequisite for the subsequent formation of
10
noctilucent cloud particles in the polar mesopause region. For a better understanding of these phenomena, it is helpful to know accurately the annual and diurnal variations of meteor rates. These rates have been extensively studied at mid and low latitudes, but comparatively little at polar latitudes. Therefore we have integrated a 33 MHz SKiYMET all-sky meteor radar into the instrument cluster of the ALOMAR observatory at 69◦N
15
latitude and have measured the radar meteor rates at this location for two full annual cycles. This site, being within 3◦ of the Arctic circle, offers in addition an interesting capability: The axis of its antenna field points (almost) towards the North ecliptic pole (NEP) once each day of the year. In this particular viewing direction, the radar monitors the meteoroid influx from (almost) the entire ecliptic Northern hemisphere. Hence, the
20
radar is excellently suited to measure the spatial variations of that meteoroid influx, which originates in the ecliptic Northern hemisphere, along the path of the Earth about the Sun. Here we report on the observed diurnal variations (averaged over one month) of meteor rates and their significant alterations throughout the year
ACPD
4, 1–20, 2004 Meteor rates W. Singer et al. Title Page Abstract Introduction Conclusions References Tables Figures J I J I Back CloseFull Screen / Esc
Print Version Interactive Discussion
© EGU 2004
2. The radar instrument: its parameters and sites
This study was performed using a commercially produced SKiYMET all-sky inter-ferometer meteor radar (Hocking et al., 2001). Its basic instrument parameters are:
frequency 32.55 MHz,
peak power 12 kW,
pulse width 13 µs,
pulse rep. frequency 2144 Hz,
transmitting antenna 3-element crossed Yagi antenna,
receiving antenna 5-channel interferometer of 2-element crossed Yagi antennas, sampling resolution 0.94 ms,
height range 78–120 km,
angular resolution 2◦.
The radar antennas apply crossed antenna elements to ensure a near uniform
az-5
imuthal sensitivity to meteor echoes as shown in Fig.1a for the receiver antenna. The system uses a 5-antenna interferometer on reception, resulting in a range accuracy of 2 km and angular accuracy of 1 to 2◦ in meteor location. The dependence of the receiver antenna gain on the elevation is shown in Fig.1b. It is rather uniform for eleva-tion angles greater than, say, 30◦and tends towards zero for echoes close to the local
10
horizon. We note that the system detects only meteor trails oriented perpendicular to the radial direction from the radar to the meteor trail. Still, the gain pattern implies a rather well behaved detection efficiency for meteors from all directions except for those entering close to the vertical.
From November 1999 until August 2001, the radar was operated at our field station
15
Juliusruh, Germany, with geographic coordinates 54.6◦N, 13.4◦E. Thereafter the radar was moved to the ALOMAR observatory, Norway, with geographic coordinates 69.3◦N, 16.0◦E (von Zahn,1997). There the radar is located 2.6◦North of the Arctic circle and is in continuous operation since the end of September 2001 (Singer et al.,2003).
For any site on the Arctic circle, the NEP passes through the zenith once a day.
ACPD
4, 1–20, 2004 Meteor rates W. Singer et al. Title Page Abstract Introduction Conclusions References Tables Figures J I J I Back CloseFull Screen / Esc
Print Version Interactive Discussion
© EGU 2004 We show in Fig. 2 an idealized sketch of the viewing geometry. In this figure, the
actual elevation pattern of Fig.1b is idealized to a mushroom shape. We remind the reader, though, that the actual elevation pattern cut out from detections by the radar those meteors which entering nearly vertically. Otherwise, meteoroids can be observed which enter in (almost) all directions from the ecliptic Northern hemisphere, none can
5
be observed entering from the South ecliptic hemisphere. Such geometry seems well suited to study the variation of meteoroid fluxes along the path of the Earth about the Sun. For this geometry to occur, the local time needs to be 06:00 LT, 24:00 LT, 18:00 LT, and 12:00 LT close to the spring equinox, the summer solstices, the autumn equinox and the winter solstices, respectively (Fig.3). We also note that meteor rates taken in
10
this geometry do not need any correction for the effect of the Earth’s orbital motion in order to make them comparable throughout an entire annual cycle. We recognize that the ALOMAR site is located 2.6◦North of the Arctic circle. This offset is, however, only of the same size or smaller than the diameter of most meteor streams and therefore we consider it unimportant for our following considerations.
15
3. Diurnal variations of meteor rates
We show in Fig.4 monthly means of the meteor rates as observed at the ALOMAR site and as function of Central European Time (CET). The latter is only a few minutes different from the local solar time at the radar site. Total meteor count rates covering the height range 78 to 120 km were calculated from the raw data after removal of multiple
20
detections and counting ambiguous detections in range only once. Only unambiguous detections were allowed for meteors with altitude above 100 km. Furthermore, there was no attempt made to eliminate shower meteors from these statistics. Under these rules, the instrument yields meteor rates in the order of 250±200 meteors per hour.
Absolute maximum and minimum meteor rates are reached near 07:00 LT in June
25
and 15:00 LT in February, respectively, their ratio being about 20 (a day-by-day analysis of February data shows that the absolute minimum of meteor rates is reached during
ACPD
4, 1–20, 2004 Meteor rates W. Singer et al. Title Page Abstract Introduction Conclusions References Tables Figures J I J I Back CloseFull Screen / Esc
Print Version Interactive Discussion
© EGU 2004 the first week of February). The fact that the meteor count rate maximizes in June is of
great significance for the aeronomy of noctilucent clouds. It very likely means that also the total meteoric mass flux maximizes during June. The latter is assumed to be the dominant source for condensation nuclei (CN) in the altitude range 75 to 90 km. The existence of these CNs is a prerequisite for the formation of noctilucent cloud particles
5
in the polar mesopause region (von Zahn and Berger,2003).
The ratio of maximum over minimum meteor rates throughout one diurnal cycle is given in Table1for each month of the year 2002. In January and February this ratio is about 5, from April through December 2.3±0.3. If compared with similar measurements at mid-latitudes (e.g.Nakamura et al.,1991), our expectation, that the amplitude of the
10
diurnal variation is to decrease towards the North pole, is not really borne out.
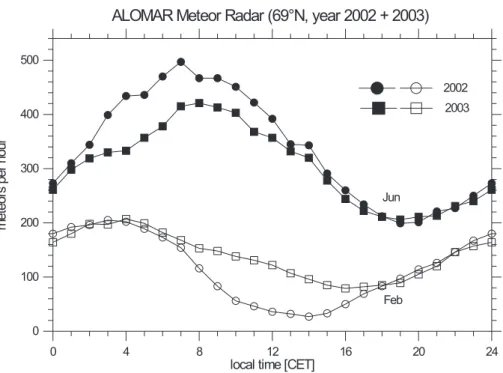
In order to evaluate the reproducibility of the diurnal variations, we show in Fig. 5 monthly mean variations of meteor rates for June and February for both the years 2002 and 2003. According to Fig.4, these are at our observation site the months with maximum and minimum total meteor rates, respectively. Very conspicuous are not only
15
the large differences in meteor rates between the two months, but also the variability of the local times at which the maximum and minimum rates occur. If the diurnal variation would be driven solely by the orbital motion of the Earth about the Sun, the maxima and minima should occur at 06:00 and 18:00 LT, respectively. Actual deviations from this first-approximation values reach up to 5 h or 75◦ of a full diurnal cycle. Clearly,
20
higher order effects than just the orbital motion of the Earth contribute significantly to the shape of the diurnal variation curve.
4. Annual variation of observed meteors arriving from the ecliptic Northern Hemisphere
As explained in Sect.2, at our observation site the NEP passes close to the zenith
25
once a day. The local times that this happens are e.g. 02:25, 00:23, and 22:25 LT for 15 May, 15 June, and 15 July, respectively. We can follow this coincidence throughout
ACPD
4, 1–20, 2004 Meteor rates W. Singer et al. Title Page Abstract Introduction Conclusions References Tables Figures J I J I Back CloseFull Screen / Esc
Print Version Interactive Discussion
© EGU 2004 the year and Fig.6shows the number of meteors observed over a period of one hour,
each centered on the local time of passage of the NEP close to the zenith. Even under this special viewing geometry, a strong annual variation of meteor rate is clearly present and with the maximum rate occurring in June. This is one more proof that the total meteoric flux entering the Earth’s atmosphere from the North ecliptic hemisphere
5
depends strongly on the position of the Earth along its orbit about the Sun, that is on ecliptic longitude. A question is whether our observations shed some new light on the source(s) of this asymmetry.
Meteor radars have long identified a number of prominent meteor showers in sum-mer. The strongest of the May/June period are listed with some of their properties in
10
Table 2 (radiants from Kronk (2003); other parameters from McKinley (1961)). It is remarkable that all four are “daylight” showers in the sense that their radiant transits occur some times between 09:00 and 12:00 LT. However, it is only the Eta Aquarid shower in early May that shows up clearly in our radar data. This enhanced visibility is most likely due to the high entry speed vat 64 km/s of these shower meteoroids which
15
cause their electron line density q to be enhanced over that of slower meteors by about
vat3.4(Bronshten,1983). Of the three June meteor showers, only the radiant of the Ari-etids is clearly recognizable in mass plots of our radar data taken in mid-June (which is about a week past the supposed date of maximum shower activity). The Zeta Perseids and Beta Taurids do not produce anything like a clear radiant in our data set.
20
A general weakness of signatures from these three June showers for our observation conditions can be expected from the low altitude of their radiants. For our “NEP-close-to-zenith” condition, the radiants of the Arietids, Zeta Perseids, and Beta Taurids are only 8◦, 7◦, 7◦and 1◦, respectively, above the local horizon. This should put their meteor trails at rather higher altitudes at which the detection sensitivity of the radar is already
25
strongly reduced. Therefore, we are not really surprised to see so little trace of these showers in our data. Yet, it means that the strong June maximum in meteor rates persists even without a significant contribution of these daylight showers. This finding is somewhat different from that of (Ueda and Maegawa,2001), who attribute much of
ACPD
4, 1–20, 2004 Meteor rates W. Singer et al. Title Page Abstract Introduction Conclusions References Tables Figures J I J I Back CloseFull Screen / Esc
Print Version Interactive Discussion
© EGU 2004 their June maximum in meteor rate, derived from forward-scatter radio observations at
36◦N, to the activity of the daylight showers.
To analyse the situation further, we will now study the altitude and elevation distri-bution of the observed meteors. Figure7show the altitude distribution of all detected meteors during the one hour of “NEP-close-to-zenith” for the days of maximum
activ-5
ity of the three June daylight showers. Dots indicate the observations of 2002, the squares those of 2003. The distribution peaks at 92 km in early June and at 88 km in late June. This may indicate a lessening influence of the fast, early-June Arietids on the gross distributions. The occurrence peak of the Arietids was found byBrowne et al. (1956) also near 92 km in their Jodrell Bank observations. Their occurrence
distribu-10
tion extends, however, to 110 km altitude at undoubtedly higher radiant altitudes than studied by us. The difference of meteor rates observed by the two radars at altitudes above 95 km could well be caused by a rapid decrease of detection efficiency of our SKiYMET radar for meteor trails at and above this altitude. We note, though, that trails of Leonid meteoroids have been clearly detected even above 110 km by our SKiYMET
15
radar (Singer et al., 2000) which is probably helped greatly by the high entry veloc-ity (and thus ionization efficiency) of these meteoroids. Hence, the loss of detection efficiency of our radar above 100 km is not necessarily a sharp cut-off.
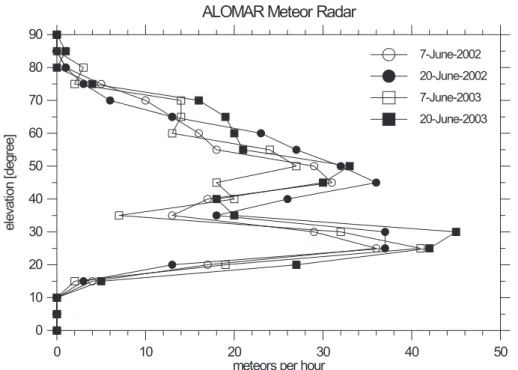
The four elevation distributions under “NEP-close-to-zenith” conditions on 7 and 20 June of the years 2002 and 2003 are shown in Fig.8. All four distributions are clearly
20
double-humped with maxima close to 27◦ and 46◦ elevation. It is tempting to asso-ciate one of the maxima with shower meteors, the other with sporadic meteors. The implications of these distributions need, however, further study.
5. Conclusions
The diurnal variation of meteor rates as observed at a site close to the Arctic circle, is
25
still quite appreciable. The ratio of maximum over minimum meteor rates throughout one diurnal cycle is 2.3±0.3 from April through December and is even higher in the
ACPD
4, 1–20, 2004 Meteor rates W. Singer et al. Title Page Abstract Introduction Conclusions References Tables Figures J I J I Back CloseFull Screen / Esc
Print Version Interactive Discussion
© EGU 2004 remaining months.
The annual variation of meteor rates is described as follows: A strong peak of meteor rate is found for the month of June. This is true while considering all detected meteors (i.e. all LT and all altitudes) and also for those detected under our special “NEP-close-to-zenith” condition. In June and under “NEP-close-“NEP-close-to-zenith” conditions, almost all of
5
the meteors are detected at altitudes below 100 km with their rate maximizing close to 90 km altitude. A large number of the echoes occur at elevation angles at and below 35◦. These altitude and elevation distributions seem to suggest that the meteors ob-served by our radar in June come from sporadic meteoroids arriving from the North ecliptic hemisphere with reasonably large ecliptic inclinations and low to moderate
at-10
mospheric entry velocities.
Acknowledgements. This work has been supported in part by grant BR 2023/1-1 of the Deutsche Forschungsgemeinschaft, Bonn, Germany, and the radar operations at Andenes by grant HPRI-CT-1999-00002 of the European Union. The SKiYMET radar system was designed and manufactured by Genesis Software, Adelaide, Australia, and Mardoc Inc., London, Ontario,
15
Canada.
References
Bronshten, V. A.: Physics of Meteor Phenomena, D. Reidel Publ. Co., Dordrecht, The Nether-lands, 356, 1983. 7
Browne, I. C., Bullough, K., Evans, S., and Kaiser, T. R.: Characteristics of radio echoes from
20
meteor trails. II: The distribution of meteor magnitudes and masses, Proc. Phys. Soc., B69, 83–97, 1956. 8
Hocking, W. K., Fuller, B., and Vandepeer, B.: Real-time determination of meteor-related pa-rameters utilizing modern digital technology, J. Atmos. Solar. Terr. Phys., 63, 155–169, 2001.
4
25
Kronk, G. W.: Comets and Meteor Showers,http://comets.amsmeteors.org/, 2003. 7
ACPD
4, 1–20, 2004 Meteor rates W. Singer et al. Title Page Abstract Introduction Conclusions References Tables Figures J I J I Back CloseFull Screen / Esc
Print Version Interactive Discussion
© EGU 2004 Nakamura, T.,Tsuda, T., Tsutsumi, M., Kita, K., Uehara, T., Kato, S., and Fukao, S.: Meteor
wind observations with the MU radar, Radio Sci., 26, 857–869, 1991. 6
Singer, W., Hoffmann. P., Mitchell, N. J., and Jacobi, C.: Mesospheric and lower thermospheric winds at middle Europe and Northern Scandinavia during the Leonid 1999 meteor storm, Earth, Moon and Planets, 82-83, 565–574, 2000. 8
5
Singer, W., Bremer, J., Hocking, W. K., Weiss, J., Latteck, R., and Zecha, M.: Temperature and wind tides around the summer mesopause at middle and arctic latitudes, Adv. Space Res., 31, 9, 2055–2060, doi: 10.1016/S0273-1177(03)00228-X, 2003. 4
Ueda, M. and Maegawa, K.: Results of forward-scatter radio echo observations in 2000, in Proceedings of the Meteoroids 2001 Conference, edited by Warmbein, B., ESA SP-495,
10
413–418, 2001. 7
von Zahn, U.: Achievements of ALOMAR, in Proc. 13th ESA Symp. on European Rocket and Balloon Programmes and Related Research, edited by Kaldeich-Sch ¨urmann, B., ESA SP-397, 141–159, 1997. 4
von Zahn, U. and Berger, U.: Persistent ice cloud in the mid-summer upper mesosphere at high
15
latitudes: Three-dimensional modeling and cloud interactions with the ambient water vapor, J. Geophys. Res., 108, D8, 8451, doi: 10.1029/2002JD002409, 2003. 6
ACPD
4, 1–20, 2004 Meteor rates W. Singer et al. Title Page Abstract Introduction Conclusions References Tables Figures J I J I Back CloseFull Screen / Esc
Print Version Interactive Discussion
© EGU 2004 Table 1. The ratio of maximum over minimum meteor rates throughout one diurnal cycle for the
year 2002 (the *February value is a mean of 2002 and 2003).
Jan Feb* Mar Apr May Jun
5.6 5.1 2.8 2.3 2.5 2.5
Jul Aug Sep Oct Nov Dec
ACPD
4, 1–20, 2004 Meteor rates W. Singer et al. Title Page Abstract Introduction Conclusions References Tables Figures J I J I Back CloseFull Screen / Esc
Print Version Interactive Discussion
© EGU 2004 Table 2. Summer daylight showers.
Shower Eta Aquarida Arietids Zeta Perseids Beta Taurids
Date of peak 4/5 May 8 June 13 June 29 June
Radiant RA [h, m] 22h 30m 03h 00m 04h 12m 05h 16m
Radiant RA [◦] 337.5 45 63 79
Radiant Dec [◦] −1.3 +24 +26 +21
LT of radiant transit 09:10 10:50 11:45 11:40 Radiant altitude for NEP in zenith [◦] +8 +7 +7 +1 Time when NEP and zenith are closest
together
03:04 LT 00:51 LT 00:30 LT 23:28 LT
Entry velocity [km/s] 64 39 29 31
Equivalent visual ZHR 20–60 60 40 20
Period [y] 8 2.0 2.0 3.3
Perihel distance [AU] 0.57 0.09 0.35 0.34
Eccentricity 0.95 0.94 0.79 0.85
ACPD
4, 1–20, 2004 Meteor rates W. Singer et al. Title Page Abstract Introduction Conclusions References Tables Figures J I J I Back CloseFull Screen / Esc
Print Version Interactive Discussion
© EGU 2004 Fig. 1. Two-element crossed receive antenna of the SKiYMET radar. (a) Horizontal
radia-tion pattern with azimuthal cuts at 10◦, 60◦ and 80◦ zenith angle; (b) Vertical radiation pattern with zenithal cuts at 0◦ and 45◦ azimuth and a 3-dB beam width of 109◦ (courtesy of Genesis Software).
ACPD
4, 1–20, 2004 Meteor rates W. Singer et al. Title Page Abstract Introduction Conclusions References Tables Figures J I J I Back CloseFull Screen / Esc
Print Version Interactive Discussion
© EGU 2004 Fig. 2. Schematic of the viewing geometry of a SKiYMET radar located on the Arctic circle.
The mushroom-like feature at the radar site is to mimic the idealized elevation pattern of the instrument sensitivity. Meteor trails have to be at a right angle to this feature in order to be detectable by the radar.
ACPD
4, 1–20, 2004 Meteor rates W. Singer et al. Title Page Abstract Introduction Conclusions References Tables Figures J I J I Back CloseFull Screen / Esc
Print Version Interactive Discussion
© EGU 2004 Fig. 3. Illustration of the radar capability to look towards the North ecliptic pole once each day
ACPD
4, 1–20, 2004 Meteor rates W. Singer et al. Title Page Abstract Introduction Conclusions References Tables Figures J I J I Back CloseFull Screen / Esc
Print Version Interactive Discussion
© EGU 2004 Fig. 4. Monthly means of the diurnal variations in meteor rates throughout the year 2002.
ACPD
4, 1–20, 2004 Meteor rates W. Singer et al. Title Page Abstract Introduction Conclusions References Tables Figures J I J I Back CloseFull Screen / Esc
Print Version Interactive Discussion
© EGU 2004
0 4 8 12 16 20 24
local time [CET] 0 100 200 300 400 500 m et eor s per hour
ALOMAR Meteor Radar (69°N, year 2002 + 2003)
Feb Jun
2002 2003
Fig. 5. Monthly means of the diurnal variation in meteor rates for February and June of the years 2002 and 2003.
ACPD
4, 1–20, 2004 Meteor rates W. Singer et al. Title Page Abstract Introduction Conclusions References Tables Figures J I J I Back CloseFull Screen / Esc
Print Version Interactive Discussion
© EGU 2004 Fig. 6. Annual variation of the meteor rate with the NEP close to the zenith at the radar site.
Plotted are the number of meteors for a 1 h period, centered on the local time of closest ap-proach of the NEP to the zenith. The meteor rates are shown separately for meteors observed at all altitudes and meteors observed below 99 km.
ACPD
4, 1–20, 2004 Meteor rates W. Singer et al. Title Page Abstract Introduction Conclusions References Tables Figures J I J I Back CloseFull Screen / Esc
Print Version Interactive Discussion
© EGU 2004
0 20 40 60 80 100
meteors per hour 70 90 110 70 90 110 hei ght [k m ] 70 90 110 2002
ALOMAR Meteor Radar
8-June 00:21-01.21 UT
13-June 00:00-01:00 UT
29-June 23:00-24:00 UT
2003
Fig. 7. The altitude distribution of all detected meteors during the one hour of “NEP-close-to-zenith” for the dates of maximum activity of the three June daylight showers (8 June – Arietids, 13 June – Zeta Perseids, 29 June – Beta Taurids). The meteor rates are shown separately for the years 2002 and 2003.
ACPD
4, 1–20, 2004 Meteor rates W. Singer et al. Title Page Abstract Introduction Conclusions References Tables Figures J I J I Back CloseFull Screen / Esc
Print Version Interactive Discussion
© EGU 2004
0 10 20 30 40 50
meteors per hour 0 10 20 30 40 50 60 70 80 90 el ev at io n [degr ee]
ALOMAR Meteor Radar
7-June-2002 20-June-2002 7-June-2003 20-June-2003
Fig. 8. Distribution of meteor count rates versus echo elevation under “NEP-close-to-zenith” conditions on 7 and 20 June of the years 2002 and 2003.