HAL Id: hal-00299221
https://hal.archives-ouvertes.fr/hal-00299221
Submitted on 22 Jul 2005
HAL is a multi-disciplinary open access
archive for the deposit and dissemination of
sci-entific research documents, whether they are
pub-lished or not. The documents may come from
teaching and research institutions in France or
abroad, or from public or private research centers.
L’archive ouverte pluridisciplinaire HAL, est
destinée au dépôt et à la diffusion de documents
scientifiques de niveau recherche, publiés ou non,
émanant des établissements d’enseignement et de
recherche français ou étrangers, des laboratoires
publics ou privés.
Perception of intense precipitation events by public
opinion
A. M. S. Delitala
To cite this version:
A. M. S. Delitala. Perception of intense precipitation events by public opinion. Natural Hazards and
Earth System Science, Copernicus Publications on behalf of the European Geosciences Union, 2005,
5 (4), pp.499-503. �hal-00299221�
SRef-ID: 1684-9981/nhess/2005-5-499 European Geosciences Union
© 2005 Author(s). This work is licensed under a Creative Commons License.
and Earth
System Sciences
Perception of intense precipitation events by public opinion
A. M. S. Delitala
Servizio Agrometeorologico Regionale per la Sardegna, Viale Porto Torres 119, I-07100 Sassari, Italy Received: 29 March 2005 – Revised: 22 June 2005 – Accepted: 22 June 2005 – Published: 22 July 2005 Part of Special Issue “HYDROPTIMET”
Abstract. A survey of four years of local newspapers over
the island of Sardinia was conducted. Articles were com-pared against meteorological observations in order to un-derstand how efficiently intense precipitation events are per-ceived.
The comparison showed that, on a wide and heterogeneous area, public opinion perceives correctly 44% of events and its perception is unbiased. If, however, the focus is placed upon urban areas, the ability to perceive grows to 66%, but an “overperception” of 33% arises. If focus is finally placed upon rural areas, skills worsen, several events are missed and a significant negative bias is detected.
1 Introduction
Any analysis of intense precipitation events should first be-gin by defining what is meant by “intense”. In a scientific contest, that would be done by trying to make the definition as objective as possible1. The average person, however, is usually led to define intensity in a subjective way. He would probably consider a precipitation event to be “intense” if it causes casualties, damages (and economic losses), or if it simply strikes imagination, so to appear somehow extraor-dinary.
The philosophical problem of how perception of intense events actually works has rarely been addressed by the mete-orological community. An interesting example can be found in Downton and Pielke (2001) that analyzes flood-related dis-aster declaration by the President of the United States. One
Correspondence to: A. M. S. Delitala
(delitala@sar.sardegna.it)
1Even in the scientific community there is an open debate on
how to define intense or even extreme events. An example of the debate can be found in: Speranza, A., Delitala, A. M. S., Deidda, R., Corsini, S., Monacelli, G., et al: Estremi nelle scienze ambientali. Sintesi del dibattito tenuto nel convegno Gli eventi estremi: alla ricerca di un paradigma scientifico condiviso, tenutosi ad Alghero (SS) il 24–26 Settembre 2003, in preparation, 2005.
of the key issues highlighted by the authors is that the fre-quency and type of presidential declarations is somehow in-fluenced by perception of disasters by public opinion.
An other interesting work is a very recent one by Palutikof et al. (2004), where the authors analyze direct perception of thermal extremes by public, by means of a survey conducted in the UK. Three key issues are examined in the paper: (a) direct experience of anomaly warm weather and reaction to it; (b) perception of events affecting the whole country; (c) perception of climate change.
On the other hand, a great deal of work has been done in trying to quantify the effects of intense or extreme events upon society, particularly from the economical and political point of view. Two examples are in Pielke and Downton (1999) and Pielke (2000) both dealing with societal damages, their trends and their connections to meteorological events.
Comparing subjective perception by public opinion against meteorological definitions can however be interest-ing, as well.
Recovering and organizing in an “objective” way, such a “subjective” information is obviously not easy. In the present analysis, e.g., it was decided to consider four years of articles published by three local newspapers and compare how many precipitation events, reported in the news as intense, could actually be define in that way by means of pluviometer ob-servations.
It is clear that a journalist’s perception is not necessarily an average person’s perception and random circumstances will cause some significant events not be covered or minor events to be covered. It is true, however, that most of the times peo-ple do not directly experience intense precipitation events, so what they actually know and feel is what has been reported in newspaper or television. Moreover, even when direct ex-perience exists, it is often biased by the point of observation, by what has been reported by others or, after sometimes, by confused memory of the episodes. An analysis based on all local newspapers of a region, then, would probably turn out to have a greater and more homogeneous sample than a sur-vey of direct experiences.
500 A. M. S. Delitala: Perception of intense precipitation events by public opinion
Table 1. Example of a dichotomous contingency table: A counts
how many events were observed and perceived as intense; B counts perceived but not observed; C counts observed but not perceived; Dcounts events neither observed nor perceived as intense.
Observed Intense Not-Intense Intense A B Not-intense C D P ercei v ed
The choice of selecting local and regional news, rather than national or international ones, has two more advantages: in the first place, the typical journalist describes events closer to him/her so perceiving them in a way more similar to how someone directly affected by them would; secondly, since lo-cal news are usually organized to cover as many lolo-cal events worth publishing as possible, they are likely to report almost any precipitation perceived as significant, so the random se-lection of news is reduced.
By reading articles more carefully, it becomes clear that what is actually felt as an “intense precipitation event” often (but not always) is a “strong surface runoff” caused by pre-cipitation. What is missing in most of public opinion, then, is the ability to separate the meteorological phenomenon (the rainfall) and its hydrological effects.
Estimating surface runoff based on the available dataset is not an easy task, especially in the complex Sardinian basins. Moreover, it is not easy to precisely separate perception of meteorological and hydrological effects.
Introducing then the hydrological information would how-ever lead beyond the scope of the present analysis and would not necessarily guarantee an improvement. Therefore it was decided not to separate the meteorological and the hydro-logical information, but to consider precipitation thresholds high enough to be typically associated to damages some-where nearby.
2 Scope of analysis and source of data
The analysis was carried out in the island of Sardinia. The island is 22 000 km2 wide and is in the center of Western Mediterranean. Population is about 1.5 million. Two urban areas exist, Sassari and Cagliari, populated by a few hun-dreds thousands people; the rest of the island is made of sev-eral small towns and wide rural areas.
From a climatic point of view Sardinia receives on average about 630 mm/year. It has a wet winter (October–April), ac-counting for 80% of the yearly precipitation, and a dry sum-mer (May–September), during which time the influence of the Azores Anticyclone regime strongly reduces the penetra-tion of Atlantic disturbances into the region or the formapenetra-tion of local disturbances (Delitala et al., 2000).
Extra-tropical cyclones, either due to primary Atlantic cyclogenesis or to secondary Mediterranean cyclogenesis (Speranza, 2001), cause most of precipitation. Intense events are not uncommon; a great deal of them are associated to convective cells fed by moist low level flows forced over steep orography.
More details on Sardinia climate and on mass fields typ-ically associated to precipitation regimes can be found in Chessa & Delitala (1996) and in Chessa et al. (1999).
The newspaper articles were published between Septem-ber 1999 and August 2003 by all the three newspapers existing at that time in Sardinia: “La Nuova Sardegna”, “L’Unione Sarda” and “Il Quotidiano”. All articles describ-ing events havdescrib-ing taken places within Sardinia, somehow referable to intense precipitation, were considered.
Pluviometer observations come from 49 meteorological stations of SAR and from 8 more belonging to other insti-tutions. This network homogeneously covers the island of Sardinia, although it is clear that some local intense precipi-tation may have been missed.
Overall, since Sardinia can be considered an heteroge-neous region from a geographical point of view, its climate is quite typical of Mediterranean and the data are homogeneous and uniformly distributed over the territory, the present work can be considered a good proxy for an analysis of this type in a Mediterranean context.
3 Analysis technique
An event was considered to have been “perceived” as intense, if it had drawn the attention of at least one newspaper, i.e. if at least one article referring to it had been published. Any event covered by more than one article, even if published in more than one day, was considered as a single one.
A precipitation was “observed” to be intense if its total was higher than 50 mm or if it was part of a spell of five consecu-tive days whose totals added up to more than 100 mm. Days belonging to both sets were taken only once.
In order to compare pluviometer observations against sub-jective perception, contingency tables were used (Wilks, 1995). Scores typically used in forecast verification of di-chotomous phenomena were based upon such tables; “per-ceived values” were used instead of “forecast values”, but names of skill scores were left as in the reference text.
Table 1 is an example of a contingency table. A, B, C and D represent the counts of the four possible pairs of per-ceived/observed events.
The percentage of correct perception is estimated by the “hit rate” (HR), defined as follows
H R = A + D
A + B + C + D. (1)
This score is excellent when all four counts have the same magnitude. A perfect performance has HR=1, i.e. B=C=0.
However, if D A+B+C, HR tends to 1, no matter how the performance was. In such cases, D is trivial and must be
Table 2. The full sample divided by classes of precipitation
inten-sity.
Threshold Number of records Number of days P≥0 mm 77 005 1461 P≥1 mm 14 156 695 P≥10 mm 3539 349
P≥50 mm 80 32
P≥100 mm 11 7
Table 3. Contingency table over the rainy days of the 1999–2003
period. Observed Intense Not-Intense Intense 17 12 Not-intense 14 627 P ercei v ed
eliminated. A new score, called “threat score” (TS), is then defined as follows
T S = A
A + B + C. (2)
By ignoring the “D counts”, the threat score measures then the ability to perceive the rare event alone. As in the former case, the optimum is given by TS=1.
The ability to actually perceive an event when it takes place is given by the “probability of detection” (POD), de-fined by
P OD = A
A + C. (3)
The optimum is POD=1 and it implies that C=0, i.e. that no intense event was missed. A similar score could be defined by using B and D, when the latter is not a trivial case.
The percentage of mistakes made when events are per-ceived as intense is given by the “false alarm rate” (FAR), i.e.
F AR = B
A + B. (4)
It is clear that the optimum is FAR=0.
Finally the “bias” (BI) of perception in defined by
BI = A + B
A + C. (5)
An unbiased performance has BI=1. When BI>0 there is a tendency to overperceive intense; the opposite happens when BI<1.
Table 4. Skill scores over contingency table 3.
Type of score Value Hit rate (HR) 0.96 Threat score (TS) 0.40 Probability of detection (POD) 0.55 False alarm rate (FAD) 0.42 Bias score (BI) 0.94
4 Sample description, contingency tables and scores
As it can be seen in Table 2, the sample is made of 77 005 records of precipitation over Sardinia (distributed in 1461 days); most of the records refer to no rain or to trace of rain. About one fifth of the records (distributed over 695 days) is made of “rainy days”, i.e. days having totals ≥1 mm, while 3539 records (distributed over 349 days) have totals
≥10 mm. 80 records (distributed over 32 days) have precip-itation over 50 mm and, finally, 11 events (on 7 days) are beyond 100 mm/day. “Events observed to be intense”, then, belong to the 99th percentile of the record set and 95th per-centile of the days under investigation.
The wide majority of the sample is made by dry days which are meaningless for the present analysis, so that it was decided to overlook them and only to consider days that were rainy at least over one station.
Table 3 shows the contingency table over the 695 rainy days. Despite the reduction of the sample, days neither ob-served nor perceived to be intense are still overwhelming., i.e., using notation of chapter 2, D A+B+C.
Skill scores based on Table 3 are shown in Table 4. Since “D counts” are overwhelming, HR is very high (0.96), but the result is trivial. If TS is used instead, the score decreases to 0.40. As far as the other scores: POD is 0.55, FAR is 0.42 and BI is 0.94.
When the whole island is considered, the perception is then unbiased. Half of the events for observed intense rain had been perceived actually like intense ones (they have some repercussion in newspapers or public opinion) and the 42
It was then decided to separate perception on urban areas from perception in rural ones, in order to check whether it changes.
A sub-sample was then built, by selecting only days per-ceived or observed to be intense over the whole island (i.e.
A, B and C “counts” of Table 3). On this sub-sample, events were considered to be “intense in cities” if they had been ob-served or perceived in the two urban areas, i.e. only when the cities of Cagliari and Sassari or their suburbs had been affected.
Tables 5 and 6 show contingency tables and scores based on the above sub-sample. HR is still high (0.88) and TS is higher than the former case (0.62); however “D counts” are not overwhelming anymore, so HR=0.88 is a strong result. As far as the other skills, POD is 0.89, FAD is 0.33 and BI
502 A. M. S. Delitala: Perception of intense precipitation events by public opinion
Table 5. Contingency table over the sub-sample made of days either
perceived or observed to be intense: focus upon urban areas.
Observed Intense Not-Intense in cities in cities Intense 8 4 in cities Not-intense 1 30 in cities Percei v ed
Table 6. Skill scores over contingency table 5.
Type of score Value Hit rate (HR) 0.88 Threat score (TS) 0.62 Probability of detection (POD) 0.89 False alarm rate (FAD) 0.33 Bias score (BI) 1.33
is 1.33, meaning that an “overperception” of intense events occurs when cities are affected.
On the same sub-sample as above, perception over rural area was tested, by considering “intense in rural areas” those events not affecting the cities of Cagliari and Sassari and their suburbs. The analysis is somewhat noisier than above, since small towns (which are something in between a city and a real rural area) are included; moreover several events affected or were perceived as intense in urban areas as well, making it difficult to separate the two sets.
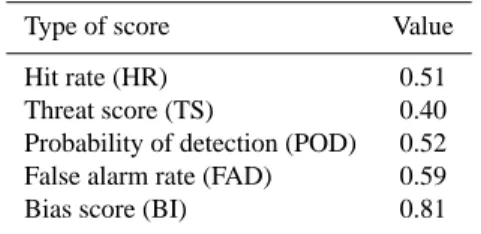
Tables 7 and 8 show contingency tables and scores using the new criterion. HR now decreases to 0.51 while TS is 0.40. POD is 0.64, FAD is 0.59 and a negative bias (BI=0.81) is observed. The values of POD and BI clearly show an “un-derperception”.
Finally, if contingency Tables 3, 4 and 7 are compared, it is clear that 13 out of 14 events observed in the full sample but completely missed by perception (“C counts” in Table 3) actually belong in rural areas (“C counts” in Table 7).
5 Comments and conclusions
Over a wide and heterogeneous area like Sardinia, perception of intense events seems to be fairly skillful: perception is cor-rect 40% of times. A little more than half of intense events are actually perceived (POD=0.55) and only about two fifth of perceived events turn out to be wrong (FAR=0.42). Fi-nally, perception is not biased (BI=0.94).
If urban areas are focused upon, the skill rises (i.e. HS=0.62) and the percentage of events correctly perceived almost reaches 90% (POD=0.89). This is clearly due to the
Table 7. Contingency table over the sub-sample made of days either
perceived or observed to be intense: focus upon rural areas.
Observed Intense Not-Intense in rural areas in rural areas Intense 14 8 in rural areas Not-intense 13 8 in rural areas Perc ei v ed
Table 8. Skill scores over contingency table 7.
Type of score Value Hit rate (HR) 0.51 Threat score (TS) 0.40 Probability of detection (POD) 0.52 False alarm rate (FAD) 0.59 Bias score (BI) 0.81
fact that in more populated area it is more likely that someone is hit by precipitation, eventually suffering damages. Per-ception is also more precise, since the percentage of “false alarms” decreases to one third (FAD=0.33). The higher at-tention paid to intense events causes a positive bias of about 33% (BI=1.33).
In rural areas, on the other way, perception is less skillful. Almost all overlooked events occurred there, so that POD drops to 0.52, and the rate of “false alarms” grows to 0.59. That happens because in rural areas intense events may often not affect people or may be far away from most of population so that perception is distorted. The balance of the two pushes towards “underpeception” and the bias is negative (BI=0.81). Finally, despite the noise of both sources of information, results appear reasonable and encourage towards new stud-ies.
Acknowledgements. The present research was funded under the
In-terreg III-B/MEDOCC project of the European Union.
The author would like to thank Roger Pielke jr for some interest-ing suggestions. The work of Francesca Manconi of SAR was also fundamental for the selection of newspaper articles.
The author would also like to thank Prof. Brett Brandon of the University of Sassari for reviewing the English form and the anonymous referees for their suggestions on how to improve the paper.
Edited by: M.-C. Llasat Reviewed by: three referees
References
Chessa, P. A. and Delitala, A. M. S.: Il Clima della Sardegna, SAR, Sassari (Italy), 1996.
Chessa, P. A., Cesari, D., and Delitala, A. M. S.: Regimes of Pre-cipitation and Temperature in Sardinia (Italy) and the related syn-optic situations, Theoretical and Applied Climatology, 63, 195– 222, 1999.
Delitala, A. M. S., Cesari, D., and Chessa, P. A.: Precipitation regimes over Sardinia (Italy) during the 1946–1993 rainy sea-son and associated large-scale climatic variations, International Journal of Climatology, 20, 519–542, 2000.
Downton, M. and Pielke Jr., R. A.: Discretion Without Account-ability: Climate, Flood Damage and Presidential Politics, Natu-ral Hazards Review, 2(4), 157–166, 2001.
Il Quotidiano, Piccola societ`a cooperativa editrice del Nord-Sardegna, Sassari (Italy), 1999–2003.
La Nuova Sardegna, Editoriale La Nuova Sardegna, Sassari (Italy), 1999–2003.
L’Unione Sarda, Editrice L’Unione Sarda, Cagliari (Italy), 1999– 2003.
Palutikof, J. P., Agnew, M. D., and Hoar, M. R.: Public perception of unusually warm weather in the UK: impacts, responses and adaptation, Climate Research, 26, 43–59, 2004.
Pielke Jr., R. A.: Flood Impacts on Society: Damaging Floods as a Framework for Assessment, in: Floods, edited by: Parker, D., Routledge Press, London (UK), 133–155, 2000.
Pielke Jr., R. A. and Downton, M.: U.S. Trends in Streamflow and Precipitation: Using Societal Impact Data to Address an Appar-ent Paradox, Bulletin of the American Meteorological Society, 80(7), 1435–1436, 1999.
Speranza, A.: The physical mechanism of secondary cyclogenesis, Recent Research Development in Atmospheric Sciences, 1, 57– 68, 2000.
Wilks, D.: Statistical Methods in the Atmospheric Sciences: an In-troduction, Academic Press, San Diego (USA), 1995.