HAL Id: hal-01128368
https://hal.archives-ouvertes.fr/hal-01128368
Submitted on 29 Sep 2015
HAL is a multi-disciplinary open access
archive for the deposit and dissemination of sci-entific research documents, whether they are pub-lished or not. The documents may come from teaching and research institutions in France or abroad, or from public or private research centers.
L’archive ouverte pluridisciplinaire HAL, est destinée au dépôt et à la diffusion de documents scientifiques de niveau recherche, publiés ou non, émanant des établissements d’enseignement et de recherche français ou étrangers, des laboratoires publics ou privés.
Anthropogenic impact on macrobenthic communities
and consequences for shorebirds in Northern France : a
complex response
Céline Rolet, Nicolas Spilmont, Dominique Davoult, Eric Goberville,
Christophe Luczak
To cite this version:
Céline Rolet, Nicolas Spilmont, Dominique Davoult, Eric Goberville, Christophe Luczak. An-thropogenic impact on macrobenthic communities and consequences for shorebirds in North-ern France : a complex response. Biological Conservation, Elsevier, 2015, 184, pp.396-404. �10.1016/j.biocon.2015.02.016�. �hal-01128368�
1 2 3 4 5 6 7 8 9 10 11 12 13 14 15 16 17 18 19 20 21 22 23 24 25 26 27 28 29 30 31 32 33 34 35 36 37 38 39 40 41 42 43 44 45 46 47 48 49 50 51 52 53 54 55 56 57 58 59 60 61
Anthropogenic impact on macrobenthic communities and consequences for shorebirds
1
in Northern France: a complex response
2 3
Céline Rolet 1,2, *, Nicolas Spilmont 1,2,3, Dominique Davoult 4,5, Eric Goberville 1,2, 4
Christophe Luczak 2,6 5
1
Université Lille 1, Station Marine, Laboratoire d‟Océanologie et de Géosciences – UMR 6
8187 LOG, 28 avenue Foch, BP80, F-62930 Wimereux, France 7
2
CNRS, UMR 8187 LOG, Station Marine, 28 avenue Foch, BP80, F-62930 Wimereux, 8
France 9
3
Environmental Futures Research Institute and School of Environment, Griffith University, 10
Gold Coast Campus, QLD 4222, Australia 11
4
Sorbonne Universités, UPMC Univ Paris 6, UMR 7144 AD2M, Station Biologique de 12
Roscoff, Place Georges Teissier, F-29680 Roscoff Cedex, France 13
5
CNRS, UMR 7144 AD2M, Station Biologique de Roscoff, Place Georges Teissier, F-29680 14
Roscoff Cedex, France 15
6
Université d‟Artois, ESPE, Centre de Gravelines, 40 rue V. Hugo - BP 129, F-59820 16
Gravelines, France 17
18
*corresponding author: celine.rolet@univ-lille1.fr 19
Phone number: +33 (0) 321 99 29 42 20
Submitted to Biological Conservation 21 22 Number of references: 80 23 Number of figures: 4 24 Number of tables: 1 25 Number of appendices: 3 26
Number of words in the abstract: 240 27
Number of words in the main text: 4826 28
29
*Manuscript
1 2 3 4 5 6 7 8 9 10 11 12 13 14 15 16 17 18 19 20 21 22 23 24 25 26 27 28 29 30 31 32 33 34 35 36 37 38 39 40 41 42 43 44 45 46 47 48 49 50 51 52 53 54 55 56 57 58 59 60 Abstract 30
Shorebird populations are declining worldwide due to the combined effect of climate change 31
and anthropogenic forcing, the ongoing coastal urbanisation amplifying the alteration of their 32
habitat in both rate and magnitude. By focusing on a highly anthropogenically-influenced 33
region in Northern France, we studied the impact of a seawall construction on wintering 34
shorebird populations through potential alterations in the abundance and availability of their 35
food resources. We concurrently investigated changes in the spatial distribution of muddy-36
sand beach macrobenthic communities between two periods of contrasting anthropogenic 37
impacts and examined year-to-year trends of wintering shorebirds. Our study reveals that the 38
seawall construction led to a major spatial reorganisation of the macrobenthic communities 39
with a drastic reduction of the muddy-sand community. However, no relation between 40
macrobenthic changes and shorebird abundances was detected. Fluctuations in shorebird 41
abundances appeared to be congruent with flyway population trends. This result suggests that 42
the response of shorebirds to human-induced perturbations is much more complex than 43
expected. While an assessment of potential disturbances induced by coastal engineering 44
constructions is needed, the pathways by which alterations could propagate through an 45
ecosystem are not linear and as such difficult to determine. Ecosystems appear as complex 46
adaptive systems in which macroscopic dynamics emerge from non-linear interactions at 47
entangled smaller/larger scales. Our results confirm that an in-depth knowledge of the local, 48
regional and global factors that influence trends of shorebirds and their habitat use is essential 49
for accurate and effective management and conservation strategies. 50
Keywords: shorebirds, macrobenthic communities, anthropogenic impact, coastal
51
conservation, complexity 52
1 2 3 4 5 6 7 8 9 10 11 12 13 14 15 16 17 18 19 20 21 22 23 24 25 26 27 28 29 30 31 32 33 34 35 36 37 38 39 40 41 42 43 44 45 46 47 48 49 50 51 52 53 54 55 56 57 58 59 60 61 1. Introduction 54
The world‟s ocean shores, mainly dominated by sandy beaches (Schlacher et al., 2008), 55
represent an important component in processing large quantities of organic material and 56
recycling nutrients back to coastal waters (McLachlan and Brown, 2006). These zones also 57
provide permanent or transitory habitats for many invertebrates (zooplankton, benthic macro- 58
and meiofauna and insects) and vertebrates (fishes, turtles and shorebirds) for reproduction, 59
nurseries, migration or feeding (Schlacher et al., 2008; Defeo et al., 2009). In beach 60
ecosystems, primary and secondary consumers, mostly represented by benthic organisms 61
(Raffaelli and Hawkins, 1999), are consumed by top-predators such as shorebirds and fishes 62
(Dugan et al., 2003; McLachlan and Brown, 2006). 63
Because of low food resources compared to estuarine and wetlands systems (Spruzen et 64
al., 2008), sandy beaches are generally not considered as important feeding areas for 65
shorebirds. Since coastal wetlands have become scarce (Hubbard and Dugan, 2003), some 66
sandy beaches, especially those with muddy patches, may have become as attractive as 67
estuaries and wetlands systems for foraging shorebirds (Burger et al., 1997; McLusky and 68
Elliott, 2004; Van de Kam et al., 2004; Spruzen et al., 2008). However, previous studies have 69
shown that birds are the most abundant and diverse vertebrate species encountered in these 70
beaches (Burton, 2012). Buffer effect (Gill et al., 2001) and refuge during cold winter periods 71
in north-western Europe (Camphuysen et al., 1996; Marzec and Luczak, 2005) have been 72
suggested as potential factors influencing the use of these a priori low attractive habitats. 73
Beach areas provide a wide range of economical services for human settlements, 74
development and local subsistence (Defeo et al., 2009). As a result, more than 60% of the 75
world‟s population are currently living less than 60 km away from the sea (IPCC, 2007). 76
Urbanisation is thus becoming increasingly important and the growing human pressure on 77
beach ecosystems has significantly reduced both the number and the area of species habitats 78
(Schlacher et al., 2008). Both engineering constructions (e.g. dykes, pipelines, harbours…) 79
and recreational activities (e.g. swimming, camping, vehicles…) could induce drastic changes 80
in the distribution, diversity and abundance of macrobenthic species (Lewis et al., 2003; 81
Bertasi et al., 2007; Schlacher et al., 2008; Schlacher and Thompson, 2007, 2012). This 82
human fingerprint could directly and indirectly influence shorebird species (Goss-Custard and 83
Verboven, 1993) by disturbing their foraging behaviour (e.g. less time to feed; Thomas et al., 84
2003), their breeding success as well as their nesting behaviour (Lord et al., 1997, 2001). 85
Global warming is another source of significant perturbation and climate-induced changes in 86
the physiology, phenology and biogeography of species, leading sometimes to ecosystem 87
reorganisations that have been already documented (Parmesan, 2006; Beaugrand et al., 2009; 88
Luczak et al., 2012). Temperature is a cardinal factor governing changes in both biological 89
and ecological systems from the individual to the community level (Goberville et al., 2014). 90
Sea-level rise and extreme climatic events could alter marine habitats by modifying coastal 91
landscapes and beach morphology (Harris et al., 2011). 92
Along the French coast of the Southern Bight of the North Sea, the “Hemmes de Marck” 93
is the only major muddy-sand beach representing an attractive feeding area for shorebirds 94
(Marzec and Luczak, 2005; Spilmont et al., 2009). However, the Calais harbour extension and 95
a seawall construction in 1984 induced the destruction of two main habitats: a pond/marsh 96
area and the aerial dunes as well as a high modification of the hydro-sedimentary dynamics 97
and processes in this area (Richard et al., 1980; Hequette and Aernouts, 2010). In the present 98
study, we investigated spatio-temporal changes in both muddy-sand beach communities and 99
potential consequences on staging wintering shorebird populations. First, we compared the 100
1 2 3 4 5 6 7 8 9 10 11 12 13 14 15 16 17 18 19 20 21 22 23 24 25 26 27 28 29 30 31 32 33 34 35 36 37 38 39 40 41 42 43 44 45 46 47 48 49 50 51 52 53 54 55 56 57 58 59 60
spatial distribution of the macrobenthic communities between the year 1982 (i.e. two years 101
before the harbour extension) and the year 2010 (i.e. 26 years later). We then evaluated year-102
to-year changes in shorebird abundances from 1980 to 2012 to identify a possible relationship 103
with changes in their food resources (i.e. macrobenthic communities). Finally, we discussed 104
the implementation of management plans for effective shorebird conservation strategies. 105
2. Materials and methods
106
2.1. Study site 107
Highly impacted by anthropogenic activities, the French coast of the Southern Bight of the 108
North Sea has three important harbours: Boulogne-sur-Mer (fishing activities), Calais 109
(passenger travels) and Dunkerque (freight transport), constructions which have caused a 110
decrease in habitat availability for many species (Richard et al., 1980). This part of the coast 111
is mainly constituted by small estuarine areas and dissipative beaches (Rolet et al., 2014). 112
Among these dissipative beaches, “The Hemmes de Marck” beach, located less than 5 113
kilometres east from Calais harbour (Northern France; Fig. 1), is of great importance for 114
wintering and staging shorebirds because of its broad intertidal zone (up to 1500 meters 115
width), its muddy-sand patches and its location on the East Atlantic flyway, a biogeographic 116
entity encompassing the Atlantic coasts of Europe (Greenland included) and West Africa 117
(Marzec and Luczak, 2005; Delany et al., 2009). The tidal regime is semi-diurnal and 118
macrotidal, the tidal range decreasing from 6.4 m in Calais to 5.6 m in Dunkerque (SHOM, 119
1968). Due to sand supply generated by the onshore migration and coastal welding of a 120
nearshore sand bank, this site is the only in significant accretion in the region (Reichmuth and 121
Anthony, 2007; Hequette and Aernouts, 2010). 122
2.2. Sampling strategy 123
Sampling was carried out in autumn 1982 and 2010. To avoid potential biases due to any 124
sampling changes, we used the same sampling strategy in 2010 than in 1982. For both 125
periods, 17 stations (with three replicates per station) were sampled. Samples were collected 126
with a corer (1/40 m2 down to a depth of 0.25 m) and washed through a 1 mm mesh sieve. 127
After sieving, all samples were immediately fixed and preserved in an 8% formaldehyde-128
seawater solution. At each station, one sediment core was sampled for granulometry analysis. 129
2.3. Laboratory work 130
In the laboratory, the sieved samples were sorted and macrobenthic organisms were 131
counted and identified to the species level, except for Oligochaetes, Nematodes and some 132
damaged amphipods (which represent 1% and 2% of the total abundance in both 1982 and 133
2010). Faunal densities were expressed as the number of individuals per m2 (ind.m-2). 134
Biomass was determined as ash free dry weight (g of AFDW.m-2 after 6h drying at 520°C) for 135
each station (ICES, 1986). Granulometry was analysed by dry sieving through a nested series 136
of sieves with mesh sizes decreasing from 5 to 0.05 mm. Sediment grain size was grouped 137
into six categories according to the Larsonneur classification (1977): mud (< 0.05 mm), fine 138
sands (≥ 0.05-0.2 mm), medium sands (≥ 0.2-0.5 mm), coarse sands (≥ 0.5-2 mm), fine 139
gravels (≥ 2-5 mm) and coarse gravels (≥ 5-20 mm). 140
2.4. Statistical analysis and mapping of macrobenthic communities 141
For each sampling year (1982 and 2010), macrobenthic assemblages were identified 142
following the methods recommended by Clarke and Warwick (2001). Average agglomerative 143
clustering and non-metric multidimensional scaling (MDS) analyses were computed on Bray-144
1 2 3 4 5 6 7 8 9 10 11 12 13 14 15 16 17 18 19 20 21 22 23 24 25 26 27 28 29 30 31 32 33 34 35 36 37 38 39 40 41 42 43 44 45 46 47 48 49 50 51 52 53 54 55 56 57 58 59 60 61
Curtis similarity matrices after 4th root transformation of species abundances to moderate the 145
influence of dominant species (Clarke and Warwick, 2001). ANOSIM randomisation test 146
(Clarke and Green, 1988) was performed to test the statistical significance of the groups 147
obtained from the previous classification within each year. Discriminating species, which 148
significantly (p < 0.05) contributed to segregate the different groups, were identified using the 149
similarity percentage routine (SIMPER). A non-parametric (permutational; 999 permutations) 150
multivariate analysis of variance (PERMANOVA; Anderson, 2001) was used to test 151
hypothesis about macrobenthic assemblage differences between the two sampling years (1982 152
and 2010). All analyses were performed with the Plymouth Routines in Multivariate Research 153
(PRIMER®) software version v6 (Clarke and Gorley, 2006). Macrobenthic communities 154
identified by multivariate analyses (cluster and MDS) were then combined with the „Direct 155
Field Observation‟ (DFO) method proposed by Godet et al. (2009) and habitats were 156
determined using the EUNIS classification (Davies et al., 2004; Connor et al., 2004). The 157
different habitats obtained were then mapped in both 1982 and 2010, using aerial photographs 158
(© Ortho Littorale 2000) coupled with a Geographic Information System (ArcGIS 10®). From 159
this mapping and for both years, surfaces of each macrobenthic communities were calculated 160
based on the beach surface during low waters of spring tides. Mann-Whitney-Wilcoxon and 161
Kruskall-Wallis tests (Zar, 2014) were respectively used to test temporal (1982 versus 2010) 162
and spatial (within 1982 and 2010) differences (p < 0.05) in densities, biomasses and species 163
richness for each macrobenthic community. 164
2.5. Long-term changes in shorebird populations 165
Changes in coastal shorebird abundances in the studied area were investigated using data 166
from annual reports of the wintering shorebirds monitoring programme (mid-January counts) 167
conducted from 1980 to 2012 (except in 2006 and 2007) in the context of the European 168
wetland bird survey (Wetlands International; Mahéo, 1980 to 2012). Because rare species 169
may reflect stochastic sampling effects (Poos and Jackson, 2012), decrease the signal-to-noise 170
ratio (Borcard et al., 2011) and cause analytical issues (Legendre and Legendre, 2012), only 171
shorebirds with a presence > 2% over the period 1980-2012 were selected (99% of the total 172
abundance; supplementary material appendix A; in bold). This procedure allowed the 173
selection of 5 species: Red knot Calidris canutus islandica, Sanderling Calidris alba, Dunlin 174
Calidris alpina, Oystercatcher Haematopus ostralegus and Grey plover Pluvialis squatarola 175
(supplementary material appendix A; in bold). Since species abundance data (number of 176
shorebirds counted during the period) exhibited skewed distributions, data were log-177
transformed before performing further analysis (Jolliffe, 2005). 178
To extract major long-term changes in both the abundance and composition of coastal 179
shorebird populations in the “Hemmes de Marck” beach from 1980 to 2012, a standardised 180
principal component analysis (PCA for table with missing data; Bouvier, 1977) was 181
performed on the correlation matrix (30 years × 5 species) and the first two principal 182
components were retained for further examination. This approach allowed in a single analysis 183
(1) the characterisation of the main long-term pattern in species, (2) the examination of 184
synchronicity (the correlation between each species and the principal components) and (3) the 185
detection of potential temporal discontinuity (Legendre and Legendre, 2012). 186
As a complement, individual species trends were tested using a non-parametric Spearman 187
rank correlation (ρ) between observations and time. Significance was evaluated with 1000 188
permutations (Legendre and Legendre, 2012). Analyses were performed with the “trend.test” 189
function of the R package “Pastecs” (Grosjean and Ibanez, 2002). 190
1 2 3 4 5 6 7 8 9 10 11 12 13 14 15 16 17 18 19 20 21 22 23 24 25 26 27 28 29 30 31 32 33 34 35 36 37 38 39 40 41 42 43 44 45 46 47 48 49 50 51 52 53 54 55 56 57 58 59 60
2.6. Shorebirds spatial distribution 191
To identify feeding areas of shorebirds in the tidal flat, the study area was visited 10 times 192
during January following macrobenthos sampling (i.e. 1983 and 2011) at low tide +/- 2h. 193
During each visit, all the feeding birds were mapped. Birds were observed through a 40x 194
(Kowa TS-1 in 1983) and 20-60x zoom (Leica apo-televid in 2011) by a single observer from 195
a vantage point 50-1000 m from the birds, and level with or above it. 196
The synthesis of the feeding areas data were mapped for both 1983 and 2011 winter 197
periods using the mapping software ArcGIS 10® and overlaid on macrobenthic data 198
independently obtained. 199
3. Results
200
3.1. Distribution of macrobenthic communities before the harbour extension (in 201
1982) 202
Three macrobenthic assemblages were distinguished in 1982 by the cluster and MDS 203
analyses (MDS stress 0.13; ANOSIM 0.78; p < 0.001; supplementary material appendix B.1). 204
The first assemblage was the Polychaetes/Bivalves community dominated by muddy-sand 205
(A2.24 according to the EUNIS classification). Located in the upper intertidal part of the 206
entire study site and in the mid shore in the centre of the study area (in yellow; Fig. 2a), this 207
community covered 4.72 km2 of the intertidal area in 1982 (Table 1). It was dominated by the 208
amphipod Corophium arenarium (68%) and the gastropod Peringia ulvae (28%). 209
The second community was located in the mid shore (in blue; Fig. 2a), covered 3.53 km2 210
of the studied beach (Table 1) and corresponded to the Amphipods and Scolelepis spp. in 211
littoral medium-fine sand community (A2.223). The main species were the isopods Eurydice 212
spp. (28%), the amphipods Bathyporeia spp. (19%) and the polychaete Scolelepis squamata 213
(8%). 214
The third assemblage, the Polychaetes/Amphipods dominated fine sand shores community 215
(A2.23), was located in the lower shore of the study site (in green; Fig. 2a) and covered a 216
surface of 8.14 km2 (Table 1). It was dominated by the amphipods Bathyporeia spp. (15%), 217
Haustorius arenarius (17%) and Urothoe brevicornis (9%), and the polychaete Nephtys 218
cirrosa (5%). 219
These three macrobenthic communities had similar densities and biomasses (Table 1). 220
After application of a Kruskall-Wallis test (threshold p < 0.05), we only detected a significant 221
difference between sandy community species richness (A2.23; 9.0 ± 3.2 species; Table 1) and 222
muddy-sand community species richness (A2.24; 4.7 ± 1.9 species; Table 1). 223
The strandline (A2.21), located along the dunes, was determined using the DFO method 224
as no benthic sampling was performed in this area (in orange; Fig.2a). This community 225
covered an area of 0.26 km2 (Table 1). 226
3.2. Distribution of macrobenthic communities 28 years later (in 2010) 227
While the cluster and MDS analyses applied for data sampled in 2010 revealed the same 228
EUNIS communities as those identified in 1982 (i.e. A2.24, A2.223 and A2.23; MDS stress 229
0.12; ANOSIM 0.53; p < 0.001; supplementary material appendix B.2), the multivariate 230
1 2 3 4 5 6 7 8 9 10 11 12 13 14 15 16 17 18 19 20 21 22 23 24 25 26 27 28 29 30 31 32 33 34 35 36 37 38 39 40 41 42 43 44 45 46 47 48 49 50 51 52 53 54 55 56 57 58 59 60 61
analysis performed on macrobenthic assemblages displayed a significant effect of years 231
(PERMANOVA: Pseudo-F = 2.3214; p < 0.05). 232
Indeed, the Polychaetes/Amphipods dominated fine sand community appeared more 233
dispersed in the MDS than 28 years before (supplementary material appendix B.2). Similar 234
patterns were found, but to a lesser extent, for the Amphipods and Scolelepis spp. in littoral 235
medium-fine sand community. While the dominant species in each community were the same, 236
densities, biomasses and the distribution of communities were highly modified. 237
The Polychaetes/Bivalves dominated muddy-sand community (in yellow) showed higher 238
densities in 2010 (Mann-Whitney-Wilcoxon test, p < 0.05; Table 1) and its biomass increased 239
by a factor of 7 between 1982 and 2010, due to high densities of both Peringia ulvae and 240
Corophium arenarium (80% and 14% of the total abundance, respectively). Densities and 241
biomasses were significantly higher in this muddy-sand community than in the two other 242
sandy communities identified in 2010 (Kruskall-Wallis test, p < 0.05). The amphipod 243
Bathyporeia pilosa (42%), the polychaete Pygospio elegans (23%) and the isopods Eurydice 244
spp. (10%) dominated the Amphipods and Scolelepis spp. in littoral medium-fine sand 245
community (in blue). The Polychaetes/Amphipods dominated fine sand shores community (in 246
green) was dominated by the polychaetes Scolelepis squamata and Nephtys cirrosa (29% of 247
the total abundance), the crustaceans Eurydice spp. (15%) and Bathyporeia pelagica (6%). 248
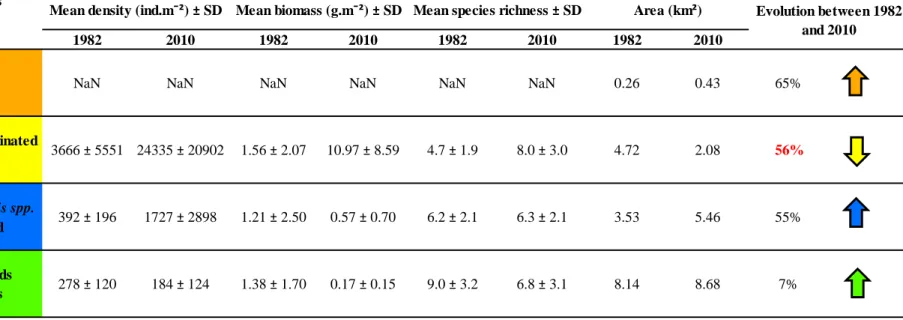
A major spatial reorganisation of benthic communities occurred between 1982 and 2010 249
(Fig. 2): the muddy-sand community dominated by Polychaetes and Bivalves lost 56% of its 250
surface (2.08 km2 in 2010 versus 4.72 km2 in 1982) whereas coverages of other communities 251
increased (65% for the strandline, 55% for the Amphipods and Scolelepis spp. in littoral 252
medium-fine sand community and 7% for the Polychaetes/Amphipods dominated fine sand 253
shores community; Table 1). The muddy-sand community disappeared, firstly from the 254
western part of the studied area, replaced by the Polychaetes/Amphipods dominated fine sand 255
shores community, and secondly from the highest tidal levels replaced by the strandline and 256
the Amphipods and Scolelepis spp. in littoral medium-fine sand community. 257
3.3. Long-term changes in shorebird abundances 258
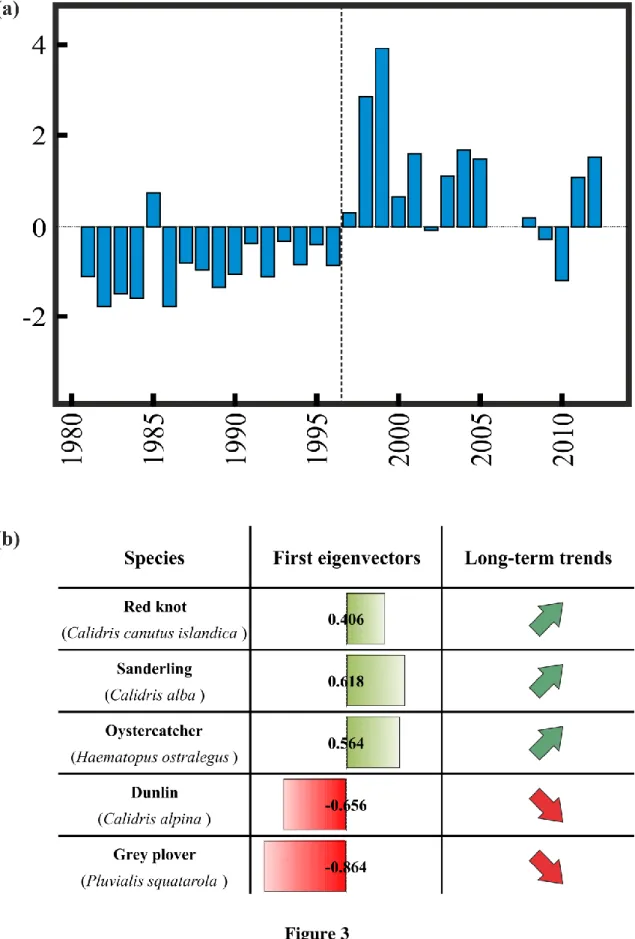
Year-to-year changes in the first principal component (PC1; 41% of the total variability) 259
of the PCA applied on shorebird abundances showed low values (mostly negative) of the 260
component from 1980 to the mid-90‟s, followed by a rapid increase in the trend and relatively 261
high values (mostly positive) from 1996 until 2012 (Fig. 3a). Examination of the first 262
eigenvector indicated that Sanderling (Calidris alba), Oystercatcher (Haematopus ostralegus) 263
and, to a lesser extent, Red knot (Calidris canatus islandica) were positively correlated to the 264
PC1 (Fig. 3b), suggesting an increase in their abundances. In contrast, Grey plover (Pluvialis 265
squatarola) and Dunlin (Calidris alpina) were negatively correlated to this component (Fig. 266
3b), indicating a decline in their abundances over the last 30 years. The second principal 267
component (PC2; 27% of the total variability) appeared more affected by episodic events and 268
no major trend was detected (supplementary material appendix C.1). Long-term changes in 269
the PC2 showed low values of the component from 1980 to the mid-90‟s, followed by an 270
alternation between positive and negative values. Examination of the second eigenvector 271
indicated that Red knot and Dunlin predominantly contributed to changes, revealing a 272
significant reduction in their abundances in 1998-1999 and 2003-2004 (supplementary 273
material appendix C.2). 274
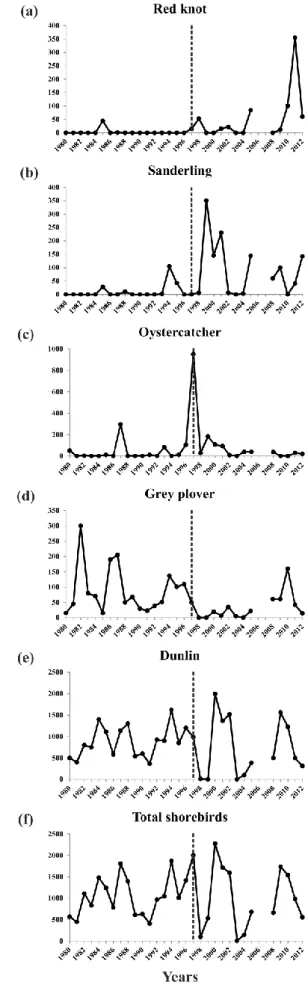
Looking at each species trend for the period 1980-2012, Red knot, Sanderling and 275
Oystercatcher abundances significantly increased (Spearman rank correlation ρof 0.35 (p < 276
1 2 3 4 5 6 7 8 9 10 11 12 13 14 15 16 17 18 19 20 21 22 23 24 25 26 27 28 29 30 31 32 33 34 35 36 37 38 39 40 41 42 43 44 45 46 47 48 49 50 51 52 53 54 55 56 57 58 59 60
0.05), 0.56 (p < 0.01) and 0.42 (p < 0.05), respectively; Fig. 4a-c), while Grey plover 277
significantly decreased (ρ = -0.50, p < 0.005; Fig. 4d). No significant trend was noted for 278
Dunlin (Fig. 4e) and the total shorebird abundances (Fig. 4f). Looking at each species trend 279
before and after 1997 (i.e. change detected by examination of the first principal component; 280
Fig. 3a), Sanderling was the only species with a significant increasing trend (ρ = 0.41, p < 281
0.05) between 1980 and 1996 (Fig. 4b). No significant trend was observed for the 1997-2012 282
period. 283
3.4. Associations between shorebirds and macrobenthic communities 284
For the two years, feeding shorebirds were located in the high and mid shore in the centre 285
of the study area (Fig. 2). They were also found in the high shore of the western part of the 286
beach in 1982 (Fig. 2a). 287
In 1982, 56% of the area used by shorebirds was located in the muddy-sand community 288
dominated by Polychaetes and Bivalves, 31% in the Amphipods and Scolelepis spp. in littoral 289
medium-fine sand community, 11% in the fine sand community dominated by Polychaetes 290
and Amphipods and only 2% in the strandline. 291
In 2010, concurrent with changes in macrobenthic communities (i.e. in densities, 292
biomasses and spatial distribution), our results revealed changes in shorebird feeding zones 293
(Fig. 2b): 48% of the feeding area was located in the muddy-sand community dominated by 294
Polychaetes and Bivalves, 51% in the Amphipods and Scolelepis spp. in littoral medium-fine 295
sand community and 1% in the strandline. No bird was observed feeding or foraging in the 296
fine sand community dominated by Polychaetes and Amphipods. 297
4. Discussion
298
In a preliminary study of the potential impact of the Calais harbour extension, Richard et 299
al. (1980) speculated on a spatial modification of sediment characteristics with a huge 300
reduction in muddy sediments. This predicted reduction occurred rapidly (Luczak and 301
Dewarumez, pers. obs.). However, this anthropogenic forcing does not appear to influence all 302
the regions of the French coast of the Southern Bight of the North Sea. For instance, the 303
Gravelines beach, located 10 kilometres east from the Hemmes de Marck and characterised 304
by the same four macrobenthic communities as those determined in our study site (Rolet et 305
al., 2014), was not consistently impacted over the period 1978-2013 (Dewarumez, 1978 to 306
2013). This statement raised the following questions: Did the harbour extension influence the 307
distribution of macrobenthic communities in the Hemmes de Marck beach? Did this 308
anthropogenic perturbation propagate through the food web to influence top-predators such as 309
wintering shorebirds? 310
The first hypothesis was supported by analyses that the harbour extension led to a drastic 311
reduction in the muddy-sand community and a spatial reorganisation of macrobenthic 312
communities. However, the second hypothesis was partially supported. No direct causal 313
relation between food availability and changes in shorebird abundances was detected. 314
Ecological processes that influence shorebird populations appear more complex than 315
expected. 316
4.1. Changes in the spatial distribution of intertidal macrobenthic communities 317
Substantial changes in the spatial distribution of macrobenthic communities were detected 318
in the “Hemmes de Marck” beach between 1982 and 2010. In 1982, before the Calais harbour 319
1 2 3 4 5 6 7 8 9 10 11 12 13 14 15 16 17 18 19 20 21 22 23 24 25 26 27 28 29 30 31 32 33 34 35 36 37 38 39 40 41 42 43 44 45 46 47 48 49 50 51 52 53 54 55 56 57 58 59 60 61
extension and the seawall construction (in 1984), a muddy-sand community dominated by 320
Polychaetes and Bivalves, occupied the major part of the intertidal area, whereas between 321
1982 and 2010, the Amphipods and Scolelepis spp. in littoral medium-fine sand community 322
nearly doubled its surface. Hequette and Aernouts (2010) recently suggested an influence of 323
the Calais harbour wall on both the shoreline dynamic and the sedimentary environment in the 324
beach east of Calais. While mud constituted 12% of the sediment in this area in 1982, it only 325
represented 0.03% in 2010. These changes in sediment grain size induced a spatial 326
reorganisation and a turn-over in macrobenthic fauna: species living in muddy-sand sediment 327
disappeared from the eastern and western parts of the area (i.e. Corophium arenarium and 328
Pygospio elegans) and were replaced by sand affinity species (i.e. Scolelepis squamata and 329
Nephtys cirrosa) or opportunistic species such as Oligochaeta and Nematoda. This result is in 330
accordance with Ahn and Choi (1998) who observed an increase in coarse sediments and a 331
shift in species dominance in an intertidal sandflat on the west coast of Korea after a seawall 332
construction. At the same time, the surface of the littoral medium-fine sand community 333
dominated by Amphipods and Scolelepis spp. increased by 56% in surface area and its faunal 334
composition appeared more heterogeneous in 2010 than in 1982. This pattern is the 335
consequence of an ecosystem reorganisation which is characteristic of a complex adaptive 336
system (Levin, 1999; Frontier et al., 2008). Our study suggests that the seawall construction 337
caused major changes in hydrological conditions and sedimentary composition that directly 338
impacted the spatial distribution of macrobenthic communities in the “Hemmes de Marck” 339
beach. Such alteration, by propagation through the food web, should be expected to influence 340
higher trophic levels (e.g. fishes, shorebirds; Van de Kam et al., 2004). 341
4.2. Long-term changes in shorebird abundances and interactions with 342
macrobenthic communities 343
While a patent influence of the seawall construction was observed on macrobenthic 344
species, leading to a spatial reorganisation of these communities, no major change in overall 345
shorebird abundances was detected. Total shorebird abundances remained stable 346
(approximately 1000 shorebirds; mean 1045 ± 504), but with higher fluctuations post-1997. 347
During the period 1982-2010, the trends in wintering shorebird abundances matched with 348
those observed at larger scales at the species level (Delany et al., 2009; Wetlands 349
International, 2014). 350
Since the last decade, the study site has hosted increasingly important Knot numbers. 351
Even if no fluctuation with any clear trend was measured on long-term at the global flying 352
population (Wetlands International, 2014), recent increases in Red knot were also observed in 353
the U.K and the Netherlands over the ten seasons prior to 2006-2007 (Thaxter et al., 2010; 354
Hornman et al., 2011; Balmer et al., 2013). Macoma balthica, Cerastoderma edule and 355
Peringia ulvae are the mollusc species that dominate the diet of the Knot across Western 356
Europe (Quaintenne et al., 2010). Peringia ulvae appeared particularly abundant in the 357
muddy-sand community (A2.24) and might therefore represent a safe and predictable stock 358
for this molluscivore shorebird (Quaintenne et al., 2013). 359
Trends observed for Dunlin, Grey plover and Sanderling in the study site were congruent 360
with the pattern observed at the global flyway populations (Wetlands International, 2014). We 361
stress that the rise of Sanderling is locally related to the spatial extension of the “Amphipods 362
and Scolelepis spp. in littoral-medium fine sand community” (+55% between 1982 and 2010). 363
This benthic community hosted a higher number of shorebirds in 2010 (+32%) and provided 364
an important food resource for this shorebird species: e.g. Bathyporeia spp. and Scolelepis 365
squamata (Smit & Wolf, 1981; Vanermen et al., 2009). This pattern is the synergistic result of 366
1 2 3 4 5 6 7 8 9 10 11 12 13 14 15 16 17 18 19 20 21 22 23 24 25 26 27 28 29 30 31 32 33 34 35 36 37 38 39 40 41 42 43 44 45 46 47 48 49 50 51 52 53 54 55 56 57 58 59 60
a cross-scale interaction (Frontier et al., 2008): a local evolution of macrobenthic 367
communities that turns out to be a huge food resource area in the context of an overall 368
increase in the Sanderling flyway population. A closer examination of time series of Grey 369
plover revealed an evolution similar to that observed in U.K.: wintering number increased 370
from the 1980‟s to the mid-90‟s and has since declined. At a larger spatial scale, it remains 371
unclear whether these changes reflect a large-scale redistribution in response to climate 372
change (Maclean et al., 2008) or a population decline (Delany et al., 2009). 373
While a long-term decline in Oystercatcher occurred at the flyway population at large 374
scale (-1.6% p.a. 1983-2007; Wetlands International, 2014), a significant increase in this 375
species occurred during the overall period in the “Hemmes de Marck” beach. This feature 376
may be related to fluctuations among regions (Austin et al., 2000). As part of a refuge zone in 377
Northern France (Marzec and Luczak, 2005), the “Hemmes de Marck” beach holds a 378
substantial number of wintering Eurasian Oystercatcher during severe winter conditions 379
(Camphuysen et al., 1996) as observed in 1996/1997 (Marzec and Luczak, 2005). 380
Biogeographic movements in response to cold weather appear an important climate-related 381
driving force behind interannual changes at this site scale (Maclean et al., 2008) with a 382
longer-time consistent change that could be explained by a buffer effect at a regional scale 383
(Gill et al., 2001; Marzec and Luczak, 2005; Maclean et al., 2008; Dolman, 2012). In this 384
context, mussel cultivation close to the “Hemmes de Marck” beach might be an attractive 385
factor for this species (Goss-Custard, 1996; Caldow et al., 2003; Roycroft et al., 2004). 386
In our study, we did not detect an immediate response of shorebirds to modifications in 387
macrobenthic communities. The distribution and availability of food resources did not appear 388
to be the main driver of shorebird populations during the period 1980-2012 in our study site, 389
i.e. at a local spatial scale. However, our results revealed a major modification in shorebird 390
abundances circa 1996-1997, a change already observed at larger spatial scale for Grey 391
plover, Oystercatcher and Knot. A concomitant abrupt change in the mid-90‟s has already 392
been observed in both terrestrial and marine realms: e.g. short-distance migratory raptors at 393
the European scale (Jaffré et al., 2013), trophic network in the Northeast Atlantic from 394
zooplankton to Balearic Shearwater (Puffinus mauretanicus; Luczak et al., 2011), or a 395
pronounced abrupt change in the North Sea ecosystem from sea to land with respect to larvae 396
and adults swimming crabs and one of their main predator, lesser black-backed Gull (Larus 397
fuscus graelsii; Luczak et al., 2012, 2013; Schwemmer et al., 2013). 398
These patterns of synchronous pulsed short-period modification exhibit a close parallelism 399
with large scale climate-induced temperature events (Reid and Beaugrand, 2012; Goberville 400
et al., 2014). Even if not noticed by the authors, this sudden change appeared in the 401
Community Temperature Index (CTI) calculated on shorebird assemblages wintering in 402
France (Godet et al., 2011; see their Fig. 1a), suggesting not a gradual, but an abrupt shift 403
northwards in wintering areas (Maclean et al., 2008). 404
A major question remains however unanswered: why the cascading effect of 405
anthropogenic perturbation did not impact wintering shorebirds? Food usually appears to be 406
the main factor driving the distribution of shorebirds, and a general relationship between the 407
density of birds in an intertidal area and the amount of food available for a given species 408
exists (Prater, 1981). In the Mont-Saint-Michel bay, of prime importance for wintering 409
shorebirds in France, Eybert et al. (2003) showed that the decrease in four shorebird species 410
(Oystercatcher, Dunlin, Red knot and Bar-tailed godwit (Limosa lapponica)), was related to 411
both a reduction in their preferred preys and an increase in human disturbances (mussel and 412
oyster farming). In the bay of Seine, the reduction by 20% of the mudflat area induced by the 413
1 2 3 4 5 6 7 8 9 10 11 12 13 14 15 16 17 18 19 20 21 22 23 24 25 26 27 28 29 30 31 32 33 34 35 36 37 38 39 40 41 42 43 44 45 46 47 48 49 50 51 52 53 54 55 56 57 58 59 60 61
“Le Havre” harbour extension could have influenced the mortality and body condition of 414
some shorebird species including Dunlins and Oystercatchers (Durell et al., 2005). Here, the 415
temporal stability in wintering bird number before/after disturbance, combined with a slight 416
modification in the spatial occupation by foraging shorebirds, suggested that (i) before 417
perturbation, the carrying capacity of the site was far from being reached, and (ii) the lower 418
food resource threshold has not been attained. In consequence, shorebird abundances in the 419
“Hemmes de Marck” beach did not appear affected by the Calais harbour extension. 420
4.3. Implications for management and conservation 421
Our results revealed that changes in high trophic level species at a local scale are not 422
necessarily a consequence of bottom-up effects propagating through a food web. Despite 423
drastic changes in macrobenthic communities, shorebird abundances in the “Hemmes de 424
Marck” beach appear more related to large-scale species trends (Maclean et al., 2008; Godet 425
et al., 2011). These results highlight the need to assess the extent to which wintering shorebird 426
assemblages could be impacted by the conjunction of local, regional and global influences. 427
If future constructions are planned on coastal environments, some caution would be 428
required to alleviate potential consequences on intertidal areas and its benthic fauna. As we 429
showed, some direct consequences might be anticipated (e.g. changes in macrobenthic 430
communities). However, post-development consequences at the food web level (e.g. on top-431
predators) appear harder or even impossible to predict accurately because of the multiple non-432
linear interactions at entangled smaller/larger spatio-temporal scales (Levin, 1998, 2003; 433
Frontier et al., 2008). 434
Acknowledgments
435
This work was carried out in the framework of the MACROFONE programme funded by the 436
region Nord - Pas-de-Calais and FRB. The authors are grateful to the Groupe Ornithologique 437
et Naturaliste du Nord – Pas-de-Calais (GON) for providing shorebirds data and to J.M. 438
Dewarumez, C. Maillard, J. Prygiel, J. Orange, D. Menu, V. Serreau, T. Luczak and M. Jaffré 439
for their help during benthic sampling. We are also grateful to the handling editor Vincent 440
Devictor and to the two anonymous referees for their helpful comments and suggestions, 441
which improved this paper. 442
1 2 3 4 5 6 7 8 9 10 11 12 13 14 15 16 17 18 19 20 21 22 23 24 25 26 27 28 29 30 31 32 33 34 35 36 37 38 39 40 41 42 43 44 45 46 47 48 49 50 51 52 53 54 55 56 57 58 59 60 References 444
Ahn, I.Y., Choi, J.W., 1998. Macrobenthic communities impacted by anthropogenic activities 445
in an intertidal sand flat on the west coast (Yellow Sea) of Korea. Mar. Pollut. Bull. 36, 808-446
817. http://dx.doi.org/10.1016/s0025-326x(98)00061-7. 447
Anderson, M.J., 2001. A new method for non-parametric multivariate analysis of variance. 448
Austral Ecol. 26, 32-46. http://dx.doi.org/10.1111/j.1442-9993.2001.01070.pp.x. 449
Austin, G.E., Peachell, I., Reyhfisch, M.M., 2000. Regional indexing of waders in Britain. 450
Bird Study 47, 352-371. http://dx.doi.org/10.1080/00063650009461195. 451
Balmer, D.E, Gillings, E., Caffrey, B., Swann, B., Downie, I., Fuller, B., 2013. Birds Atlas 452
2007-11: the breeding and wintering birds of Britain and Ireland. BTO books, Thetford. 453
Beaugrand, G., Luczak, C., Edwards, M., 2009. Rapid biogeographical plankton shifts in the 454
North Atlantic Ocean. Glob. Change Biol. 15, 1790-1803. http://dx.doi.org/10.1111/j.1365-455
2486.2009.01848.x. 456
Bertasi, F., Colangelo, M.A., Abbiati, M., Ceccherelli, V.U., 2007. Effects of an artificial 457
protection structure on the sandy shore macrofaunal community: the special case of Lido di 458
Dante (Northern Adriatic Sea). Hydrobiologia 586, 277–290. 459
http://dx.doi.org/10.1007/s10750-007-0701-y. 460
Borcard, D., Gillet, F., Legendre, P., 2011. Numerical Ecology with R. Springer, New York. 461
Bouvier, A., 1977. Programme ACPM. Analyse des composantes principales avec données 462
manquantes. CNRA. Laboratoire de biométrie. Document 77, 17. 463
Burger, J., Niles, L., Clark, K.E., 1997. Importance of beach, mudflat and marsh habitats to 464
migrant shorebirds on Delaware Bay. Biol. Conserv. 79, 283-292. 465
http://dx.doi.org/10.1016/s0006-3207(96)00077-8. 466
Burton, N.H.K., 2012. Avian habitat use on the non-estuarine intertidal coast, In Birds and 467
habitat: relationships in Changing Landscapes. ed. R.J. Fuller, pp. 334-351. Cambridge Press 468
University, Cambridge. 469
Caldow, R.W.G., Beadman, H.A., S. McGrorty, M.J.K., Goss-Custard, J.D., Mould, K., 470
Wilson, A., 2003. Effects of intertidal mussel cultivation on bird assemblages. Mar. Ecol. 471
Prog. Ser. 259, 173-183. http://dx.doi.org/10.3354/meps259173. 472
Camphuysen, C.J., Ens, B.J., Heg, D., Hulscher, J.B., Meer, J.v.d., Smit, C.J., 1996. 473
Oystercatcher Haematopus ostralegus winter mortality in The Netherlands: the effect of 474
severe weather and food supply. Ardea 84, 469-492. 475
Clarke, K.R., Green, R.H., 1988. Statistical design and analysis for a 'biological effects' study. 476
Mar. Ecol. Prog. Ser. 46, 213-226. 477
Clarke, K.R., Warwick R.M., 2001. Change in marine communities: an approach to statistical 478
analysis and interpretation, 2nd edition. PRIMER-E, Plymouth. 479
Clarke, K.R, Gorley, R.N., 2006. PRIMER v6: User Manual/Tutorial. PRIMER-E, Plymouth. 480
Connor, D.W., Allen, J.H., Golding, N., Howell, K.L., Lieberknecht, L.M., Northen, K.O., 481
Reker, J.B., 2004. Marine Habitat Classification for Britain and Ireland. Version 04.05, 482
JNCC, Peterborough. 483
Davies, C.E., Moss, D., Hill, M.O., 2004. EUNIS habitat classification revised 2004. 484
1 2 3 4 5 6 7 8 9 10 11 12 13 14 15 16 17 18 19 20 21 22 23 24 25 26 27 28 29 30 31 32 33 34 35 36 37 38 39 40 41 42 43 44 45 46 47 48 49 50 51 52 53 54 55 56 57 58 59 60 61
Defeo, O., McLachlan, A., Schoeman, D.S., Schlacher, T.A., Dugan, J., Jones, A., Lastra, M., 485
Scapini, F., 2009. Threats to sandy beach ecosystems: A review. Estuar. Coast. Shelf Sci. 81, 486
1-12. http://dx.doi.org/10.1016/j.ecss.2008.09.022. 487
Delany, S., Scott, D., Dodman, T., Stroud, D.A., 2009. An atlas of Waders Populations in 488
Africa and Western Eurasia. Wetlands International, Wageningen. 489
Dewarumez, J.M., 1978 - 2013. Chapitre VII: le domaine benthique intertidal. In surveillance 490
écologique et halieutique – site de Gravelines. (35 annual reports). IFREMER, Station Marine 491
de Wimereux et Institut Pasteur de Lille. 492
Dolman, P., 2012. Mechanisms and processes underlying landscape structure effects on bird 493
populations, In Birds and habitat: relationships in changing landscapes. ed. R.J. Fuller, pp. 93-494
124. Cambridge Press University, Cambridge. 495
Dugan, J.E., Hubbard, D.M., McCrary, M.D., Pierson, M.O., 2003. The response of 496
macrofauna communities and shorebirds to macrophyte wrack subsidies on exposed sandy 497
beaches of southern California. Estuar. Coast. Shelf Sci. 58, 25-40. 498
http://dx.doi.org/10.1016/s0272-7714(03)00045-3. 499
Durell, S.E.A., Stillman, R.A., Triplet, P., Aulert, C., Ono, D., Bouchet, A., Duhamel, S., 500
Mayot, S., Goss-Custard, J.D., 2005. Modelling the efficacy of proposed mitigation areas for 501
shorebirds: a case study on the Seine estuary, France. Biol. Conserv. 123, 67-77. 502
http://dx.doi.org/10.1016/j.biocon.2004.10.009. 503
Eybert, M.-C., Geslin, T., Questiau, S., Feunteun, E., 2003. Shorebird community variations 504
indicative of a general perturbation in the Mont-Saint-Michel bay (France). Comptes Rendus 505
Biologies 326, Supplement 1, 140-147. 506
Frontier, S., Pichod-Viale, D., Leprêtre, A., Davoult, D., Luczak, C., 2008. Ecosystèmes; 507
Structure, Fonctionnement, Evolution. Dunod, Paris. 508
Gill, J.A., Norris, K., Potts, P.M., Gunnarsson, T.G., Atkinson, P.W., Sutherland, W.J., 2001. 509
The buffer effect and large-scale population regulation in migratory birds. Nature 412, 436-510
438. http://dx.doi.org/10.1038/35086568. 511
Goberville, E., Beaugrand, G., Edwards, M., 2014. Synchronous response of marine plankton 512
ecosystems to climate in the Northeast Atlantic and the North Sea. J. Marine Syst. 129, 189-513
202. http://dx.doi.org/10.1016/j.jmarsys.2013.05.008. 514
Godet, L., Fournier, J., Toupoint, N., Olivier, F., 2009. Mapping and monitoring intertidal 515
benthic habitats: a review of techniques and a proposal for a new visual methodology for the 516
European coasts. Prog. Phys. Geog. 33, 378-402. 517
http://dx.doi.org/10.1177/0309133309342650. 518
Godet, L., Jaffré, M., Devictor, V., 2011. Waders in winter: long-term changes of migratory 519
bird assemblages facing climate change. Biol. Lett. 7, 714-717. 520
http://dx.doi.org/10.1098/rslb.2011.0152. 521
Goss-Custard, J.D., Verboven, N., 1993. Disturbance and feeding shorebirds on the Exe 522
estuary. Wader Study Group Bull. 68, 59-66. 523
Goss-Custard, J.D., 1996. The Oystercatcher: From individuals to populations. Oxford 524
University Press, Oxford. 525
Grosjean, P., Ibanez, F., 2002. PASTECS. R package for Analysis of Space-Time Ecological 526
Series. User‟s manual. 527
1 2 3 4 5 6 7 8 9 10 11 12 13 14 15 16 17 18 19 20 21 22 23 24 25 26 27 28 29 30 31 32 33 34 35 36 37 38 39 40 41 42 43 44 45 46 47 48 49 50 51 52 53 54 55 56 57 58 59 60
Harris, L., Nel, R., Smale, M., Schoeman, D., 2011. Swashed away? Storm impacts on sandy 528
beach macrofaunal communities. Estuar. Coast. Shelf Sci. 94, 210-221. 529
http://dx.doi.org/10.1016/j.ecss.2011.06.013. 530
Hequette, A., Aernouts, D., 2010. The influence of nearshore sand bank dynamics on 531
shoreline evolution in a macrotidal coastal environment, Calais, northern France. Cont. Shelf 532
Res. 30, 1349-1361. http://dx.doi.org/10.1016/j.csr.2010.04.017. 533
Hornman, M., Hustings, F., Koffijberg, K., Van Winden, E., Sovon, G.Z., Soldaat, L., 2011. 534
Watervogels in Nederland in 2008/2009, SOVON-monitoring rapport 2011/03, Waterdienst-535
rapport BM 10.24.Vogelonderzoek Nederland, Nijmegen. 536
Hubbard, D.M., Dugan, J.E., 2003. Shorebird use of an exposed sandy beach in southern 537
California. Estuar. Coast. Shelf Sci. 58, 41-54. http://dx.doi.org/10.1016/s0272-538
7714(03)00048-9. 539
ICES, 1986. Fifth report on the benthos ecology working group. ICES, Ostende, 12-15 may, 540
CM, L. 33p. 541
Intergovernmental Panel on Climate Change, I.P.C.C., 2007. Climate change 2007: The 542
Physical Science Basis. Cambridge University Press, Cambridge. 543
Jaffré, M., Beaugrand, G., Goberville, E., Jiguet, F., Kjellén, N., Troost, G., Dubois, P.J., 544
Leprêtre, A., Luczak, C., 2013. Phenological Shifts in Raptor Migration and Climate. PLoS 545
One 8, e79112. http://dx.doi.org/10.1371/journal.pone.0079112. 546
Jolliffe, I., 2005. Principal component analysis. Wiley Online Library. 547
Larsonneur, C., 1977. La cartographie des dépôts meubles sur le plateau continental français. 548
J. de Res. Oceanogr. 2, 33-39. 549
Legendre, P., Legendre, L., 2012. Numerical Ecology, Third English Edition, Amsterdam. 550
Levin, S.A., 1998. Ecosystem and the biosphere as complex adaptive systems. Ecosystems 1, 551
431-436. http://dx.doi.org/10.1007/s100219900037. 552
Levin, S.A., 1999. Fragile dominion. Perseus publishing, Cambridge. 553
Levin, S.A., 2003. Complex adaptive systems: exploring the known, the unknown and the 554
unknowable. B. Am. Math. Soc. 40, 3-19. http://dx.doi.org/10.1090/S0273-0979-02-00965-5. 555
Lewis, L.J., Davenport, J., Kelly, T.C., 2003. A study of the impact of a pipeline construction 556
on estuarine benthic invertebrate communities: Part 2. Recolonization by benthic invertebrates 557
after 1 year and response of estuarine birds. Estuar. Coast. Shelf Sci. 57, 201-208. 558
http://dx.doi.org/10.1016/s0272-7714(02)00345-1. 559
Lord, A., Waas, J.R., Innes, J., 1997. Effects of human activity on the behaviour of northern 560
New Zealand dotterel Charadrius obscurus aquilonius chicks. Biol. Conserv. 82, 15-20. 561
http://dx.doi.org/10.1016/s0006-3207(97)00013-x. 562
Lord, A., Waas, J.R., Innes, J., Whittingham, M.J., 2001. Effects of human approaches to 563
nests of northern New Zealand dotterels. Biol. Conserv. 98, 233-240. 564
http://dx.doi.org/10.1016/s0006-3207(00)00158-0. 565
Luczak, C., Beaugrand, G., Jaffré, M., Lenoir, S., 2011. Climate change impact on Balearic 566
Shearwater through a trophic cascade. Biol. Lett. 7, 702-705. 567
http://dx.doi.org/10.1098/rsbl.2011.0225. 568
1 2 3 4 5 6 7 8 9 10 11 12 13 14 15 16 17 18 19 20 21 22 23 24 25 26 27 28 29 30 31 32 33 34 35 36 37 38 39 40 41 42 43 44 45 46 47 48 49 50 51 52 53 54 55 56 57 58 59 60 61
Luczak, C., Beaugrand, G., Lindley, J.A., Dewarumez, J.M., Dubois, P.J., Kirby, R.R., 2012. 569
North Sea ecosystem change from swimming crabs to seagulls. Biol. Lett. 8, 821-824. 570
http://dx.doi.org/10.1098/rsbl.2012.0474. 571
Luczak, C., Beaugrand, G., Lindley, J.A., Dewarumez, J.M., Dubois, P.J., Kirby, R.R., 2013. 572
Population dynamics in lesser black-backed gulls in the Netherlands support a North Sea 573
regime shift. Biol. Lett. 9, 20130127. http://dx.doi.org/1098/rsbl.2013.0127. 574
Maclean, I.M.D., Austin, G.E., Rehfisch, M.M., Blew, J., Crowe, O., Delany, S., Devos, K., 575
Deceunink, B., Gunther, K., Laursen, K., Van Roomen, M., Wahl, J., 2008. Climate change 576
causes rapid changes in the distribution and site abundance of birds in winter. Glob. Change 577
Biol. 14, 2489-2500. http://dx.doi.org/10.1111/j.1365-2486.2008.01666.x. 578
Marzec, L., Luczak, C., 2005. Statut des limicoles hivernant sur le littoral Nord - Pas-de-579
Calais (1988-2003). Aves 42, 57-67. 580
McLachlan, A., Brown, A.C., 2006. The Ecology of Sandy Shores. Academic Press, 581
Burlington, Massachusetts. 582
McLusky, D.S., Elliott, M., 2004. The Estuarine Ecosystem. Ecology, Threats and 583
Management. Oxford University Press, Oxford. 584
Parmesan, C., 2006. Ecological and evolutionary responses to recent climate change. Annu. 585
Rev. Ecol. Evol. Syst. 37, 637-669. 586
http://dx.doi.org/10.1146/annurev.ecolsys.37.091305.110100. 587
Poos, M.S., Jackson, D.A., 2012. Addressing the removal of rare species in multivariate 588
bioassessments: The impact of methodological choices. Ecol. Indic. 18, 82-90. 589
http://dx.doi.org/10.1016/j.ecolind.2011.10.008. 590
Prater, A.J., 1981. Estuary birds of Britain and Ireland. T&AD Poyser, Calton. 591
Quaintenne, G., Van Gils, J.A., Bocher, P., Dekinga, A., Piersma, T., 2010. Diet selection in a 592
molluscivore shorebird across Western Europe: does it show short- or long-term intake rate-593
maximization? J. Anim. Ecol. 79, 53-62. http://dx.doi.org/10.1111/j.1365-2656.2009.01608.x. 594
Quaintenne, G., Bocher, P., Ponsero, A., Caillot, E., Feunteun, E., 2013. Contrasting benthos 595
communities and prey selection by Red Knot Calidris canutus in three nearby bays of the 596
Channel coast. Ardea 101, 81-87. http://dx.doi.org/10.5253/078.101.0203. 597
Raffaelli, D., Hawkins, S., 1999. Intertidal Ecology. Kluwer Academic, 598
Dordrecht/Boston/London. 599
Reid, P.C., Beaugrand, G., 2012. Global synchrony of an accelerating rise in sea surface 600
temperature. J. Mar. Biol. Assoc. UK. 92, 1435-1450. 601
http://dx.doi.org/10.1017/S0025315412000549. 602
Richard, A., Souplet, A., Dewarumez, J.M., Chamley, H. Colbeaux, J.P., 1980. Etude 603
préalable à l‟extension portuaire de Calais (bionomie – sédimentologie). Université des 604
Sciences et Technologies de Lille, contract 1980-015 report, 35p. 605
Reichmüth, B., Anthony, E.J., 2007. Tidal influence on the intertidal bar morphology of two 606
contrasting macrotidal beaches. Geomorphology 90, 101-114. 607
http://dx.doi.org/10.1016/j.geomorph.2007.01.015. 608
Rolet, C., Spilmont, N., Dewarumez, J.M., Luczak, C., 2014. Map of the benthic communities 609
of the sandy shores of the Eastern English Channel and the Southern Bight of the North Sea 610
1 2 3 4 5 6 7 8 9 10 11 12 13 14 15 16 17 18 19 20 21 22 23 24 25 26 27 28 29 30 31 32 33 34 35 36 37 38 39 40 41 42 43 44 45 46 47 48 49 50 51 52 53 54 55 56 57 58 59 60
(France). Laboratoire d‟Océanologie et de Géosciences UMR CNRS LOG 8187 report, 611
Wimereux. 30p + two maps. 612
Roycroft, D., Kelly, T.C., Lewis, L.J., 2004. Birds, seals and the suspension culture of 613
mussels in Bantry Bay, a non-seaduck area in Southwest Ireland. Estuar. Coast. Shelf Sci. 61, 614
703-712. http://dx.doi.org/10.1016/j.ecss.2004.07.012. 615
Schlacher, T.A., Thompson, L., 2007. Exposure of Fauna to Off-Road Vehicle (ORV) Traffic 616
on Sandy Beaches. Coast. Manage. 35, 567-583. 617
http://dx.doi.org/10.1080/08920750701593402. 618
Schlacher, T.A., Schoeman, D.S., Dugan, J., Lastra, M., Jones, A., Scapini, F., McLachlan, 619
A., 2008. Sandy beach ecosystems: key features, sampling issues, management challenges 620
and climate change impacts. Mar. Ecol. 29, 70-90. http://dx.doi.org/10.1111/j.1439-621
0485.2007.00204.x. 622
Schlacher, T.A., Thompson, L., 2012. Beach recreation impacts benthic invertebrates on 623
ocean-exposed sandy shores. Biol. Conserv. 147, 123-132. 624
http://dx.doi.org/10.1016/j.biocon.2011.12.022. 625
Schwemmer, H., Schwemmer, P., Ehrich, S., Garthe, S., 2013. Lesser black-backed gulls 626
(Larus fuscus) consuming swimming crabs: An important link in the food web of the southern 627
North Sea. Estuar. Coast. Shelf Sci. 119, 71-78. http://dx.doi.org/10.1016/j.ecss.2012.12.021. 628
SHOM, 1968. Les courants de marée dans la mer de la Manche et sur les côtes françaises de 629
l‟Atlantique. No. 550, p. 176, Paris. 630
Smit, C. J., Wolf, W. J., 1981. Birds of the Wadden Sea. Balkema, Rotterdam. 631
Spilmont, N., Denis, L., Artigas, L.F., Caloin, F., Courcot, L., Créach, A., Desroy, N., 632
Gevaert, F., Hacquebart, P., Hubas, C., Janquin, M.A., Lemoine, Y., Luczak, C., Migné, A., 633
Rauch, M., Davoult, D., 2009. Impact of the Phaeocystis globosa spring bloom on the 634
intertidal benthic compartment in the eastern English Channel: A synthesis. Mar. Pollut. Bull. 635
58, 55-63. http://dx.doi.org/10.1016/j.marpolbul.2008.09.007. 636
Spruzen, F.L., Richardson, A.M.M., Woehler, E.J., 2008. Influence of environmental and prey 637
variables on low tide shorebird habitat use within the Robbins Passage wetlands, Northwest 638
Tasmania. Estuar. Coast. Shelf Sci. 78, 122-134. http://dx.doi.org/10.1016/j.ecss.2007.11.012. 639
Thaxter, C.B., Sansom, A., Thewlis, R.M., Calbrade, N.A., Ross-Smith, V.H., Bailey, S., 640
Mellan, H.J., Austin, G.E., 2010. Wetland Bird Survey Alerts 2006/2007: Changes in 641
numbers of wintering waterbirds in the Constituent Countries of the United Kingdom, Special 642
Protection Areas (SPAs) and Sites of Special Scientific Interest (SSSIs). BTO Research 643
Report 556. BTO, Thetford. 644
Thomas, K., Kvitek, R.G., Bretz, C., 2003. Effects of human activity on the foraging behavior 645
of sanderlings Calidris alba. Biol. Conserv. 109, 67-71. http://dx.doi.org/10.1016/s0006-646
3207(02)00137-4. 647
Vanermen, N., Stienen, E.W.M., Meulenaer, B.D., Ginderdeuren, K.V., Degraer, S., 2009. 648
Low dietary importance of polychaetes in opportunistic feeding Sanderlings Calidris alba on 649
Belgian beaches. Ardea 97, 81-87. http://dx.doi.org/10.5253/078.097.0110. 650
Van de Kam, J., Ens. B.J., Piersma, T., Zwarts, L., 2004. Shorebirds. An illustrated 651
behavioural ecology. KNNV Publishers, Utrecht. 652
1 2 3 4 5 6 7 8 9 10 11 12 13 14 15 16 17 18 19 20 21 22 23 24 25 26 27 28 29 30 31 32 33 34 35 36 37 38 39 40 41 42 43 44 45 46 47 48 49 50 51 52 53 54 55 56 57 58 59 60 61
Wetlands International, 2014. Waterbird population estimates. Retrieved from 653
wpe.wetlands.org on Tuesday 25 March 2014 654
Zar, H.J., 2014. Biostatistical analysis, Fifth edition, Edinburgh. 655
Figures
Anthropogenic impact on macrobenthic communities and consequences for shorebirds in Northern France: a complex response
Figures Legends:
Figure 1. Location of the study site.
Figure 2. Spatial distribution of macrobenthic communities in the “Hemmes de Marck” beach
according to the EUNIS classification (colored) and the main area of staging and wintering shorebirds (hatched): (a) in 1982 (i.e. two years before the Calais harbour extension) and (b) in 2010 (i.e. 26 years later). The hatched red area corresponds to the area of harbour extension and seawall construction, absent in 1982. The red line represents the seawall, built in 1984.
Figure 3.Long-term changes in coastal shorebird abundances in the “Hemmes de Marck” beach (1982 to 2012). (a) First principal component (PC1) calculated from a standardised Principal Component Analysis (PCA) performed on coastal shorebird abundances (41% of the total variability). The vertical dashed line separates periods before and after 1997. (b) First normalised eigenvectors. The width of the histogram represents the value of the eigenvector (positively in green and negatively in red). Arrows indicate the trend of each species in relation to the PC1.
Figure 4. Shorebird abundances in the “Hemmes de Marck” beach from 1980 to 2012 for: (a)
Red knot, (b) Sanderling, (c) Oystercatcher, (d) Grey plover, (e) Dunlin and (f) the sum of all shorebird species. The vertical dashed line separates periods before and after 1997.
Figure 1 Rolet et al.
Figure 2 Rolet et al.
Figure 3 Rolet et al.
Figure 4 Rolet et al.
Table
Anthropogenic impact on macrobenthic communities and consequences for shorebirds in Northern France: a complex response
Table legend:
Table 1. Mean density (ind.m-2), mean biomass (g.m-2), mean species richness and associated standard deviations (SD), and areas (in km2) for each macrobenthic community based on the EUNIS classification in 1982 and 2010. Changes in the area between the two periods are expressed in percentage (%).
Table 1 Rolet et al. Macrobenthic communities (EUNIS classification) 1982 2010 1982 2010 1982 2010 1982 2010 0.57 ± 0.70 6.2 ± 2.1 4.72 2.08
NaN NaN NaN 0.26 0.43 65%
3.53 5.46
7% 56%
55%
A2.23 Polychaetes/Amphipods
dominated fine sand shores 6.8 ± 3.1
10.97 ± 8.59 4.7 ± 1.9 278 ± 120 184 ± 124 1.38 ± 1.70 0.17 ± 0.15 9.0 ± 3.2 6.3 ± 2.1 8.0 ± 3.0 8.14 8.68 A2.21 Strandline
A2.223 Amphipods and Scolelepis spp. in littoral medium-fine sand
NaN NaN NaN
3666 ± 5551 24335 ± 20902 1.56 ± 2.07
392 ± 196 1727 ± 2898 1.21 ± 2.50 A2.24 Polychaetes/Bivalves dominated
muddy sand shores
Evolution between 1982 and 2010 Mean density (ind.m¯²) ± SD Mean biomass (g.m¯²) ± SD Mean species richness ± SD Area (km²)