HAL Id: hal-00299531
https://hal.archives-ouvertes.fr/hal-00299531
Submitted on 17 Jun 2008
HAL is a multi-disciplinary open access
archive for the deposit and dissemination of
sci-entific research documents, whether they are
pub-lished or not. The documents may come from
teaching and research institutions in France or
abroad, or from public or private research centers.
L’archive ouverte pluridisciplinaire HAL, est
destinée au dépôt et à la diffusion de documents
scientifiques de niveau recherche, publiés ou non,
émanant des établissements d’enseignement et de
recherche français ou étrangers, des laboratoires
publics ou privés.
ASTER satellite data, the SRTM DTM and two
different flow models: case study on Iztaccíhuatl
(Central Mexico)
D. Schneider, H. Delgado Granados, C. Huggel, A. Kääb
To cite this version:
D. Schneider, H. Delgado Granados, C. Huggel, A. Kääb. Assessing lahars from ice-capped volcanoes
using ASTER satellite data, the SRTM DTM and two different flow models: case study on Iztaccíhuatl
(Central Mexico). Natural Hazards and Earth System Science, Copernicus Publications on behalf of
the European Geosciences Union, 2008, 8 (3), pp.559-571. �hal-00299531�
www.nat-hazards-earth-syst-sci.net/8/559/2008/ © Author(s) 2008. This work is distributed under the Creative Commons Attribution 3.0 License.
and Earth
System Sciences
Assessing lahars from ice-capped volcanoes using ASTER satellite
data, the SRTM DTM and two different flow models: case study on
Iztacc´ıhuatl (Central Mexico)
D. Schneider1, H. Delgado Granados2, C. Huggel1, and A. K¨a¨ab3
1Glaciology, Geomorphodynamics and Geochronology, Department of Geography, University of Zurich, Switzerland 2Instituto de Geof´ısica, Universidad Nacional Aut´onoma de M´exico (UNAM), Mexico City, Mexico
3Department of Geosciences, University of Oslo, Norway
Received: 14 December 2007 – Revised: 19 May 2008 – Accepted: 19 May 2008 – Published: 17 June 2008
Abstract. Lahars frequently affect the slopes of ice-capped
volcanoes. They can be triggered by volcano-ice interac-tions during erupinterac-tions but also by processes such as intense precipitation or by outbursts of glacial water bodies not di-rectly related to eruptive activity. We use remote sensing, GIS and lahar models in combination with ground observa-tions for an initial lahar hazard assessment on Iztacc´ıhuatl volcano (5230 m a.s.l.), considering also possible future de-velopments of the glaciers on the volcano. Observations of the glacial extent are important for estimations of future hazard scenarios, especially in a rapidly changing tropical glacial environment. In this study, analysis of the glaciers on Iztacc´ıhuatl shows a dramatic retreat during the last 150 years: the glaciated area in 2007 corresponds to only 4% of the one in 1850 AD and the glaciers are expected to survive no later than the year 2020. Most of the glacial retreat is considered to be related to climate change but in-situ obser-vations suggest also that geo- and hydrothermal heat flow at the summit-crater area can not be ruled out, as emphasized by fumarolic activity documented in a former study. However, development of crater lakes and englacial water reservoirs are supposed to be a more realistic scenario for lahar genera-tion than sudden ice melting by rigorous volcano-ice interac-tion. Model calculations show that possible outburst floods have to be larger than ∼5×10⁵m3or to achieve an H/L ra-tio (Height/runout Length) of 0.2 and lower in order to reach the populated lower flanks. This threshold volume equals 2.4% melted ice of Iztacc´ıhuatl’s total ice volume in 2007, assuming 40% water and 60% volumetric debris content of a potential lahar. The model sensitivity analysis reveals impor-tant effects of the generic type of the Digital Terrain Model
Correspondence to: D. Schneider
(demian.schneider@geo.uzh.ch)
(DTM) used on the results. As a consequence, the predicted affected areas can vary significantly. For such hazard zona-tion, we therefore suggest the use of different types of DTMs and flow models, followed by a careful comparison and in-terpretation of the results.
1 Introduction
Lahars are mixtures of water and volcanic debris of varying size and solids fraction, which frequently affect the steep, unconsolidated slopes of volcanoes. Lahars represent one of the most far-reaching threats in volcanic terrains. They may occur not only prior to or during eruptions, but also years later, and can be triggered by torrential storms, lake outbursts and earthquakes (Verstappen, 1992; Pierson, 1998; Vallance, 2000). Stream flows are muddy water streams with a sediment concentration below 20% in volume. Lahars however, can be further separated according to their sedi-ment concentration: into hyperconcentrated flows between 20 and 50–60% in volume, and into debris flows if the volu-metric sediment concentration is higher than 50–60% (Pier-son and Scott, 1985; Pier(Pier-son, 1986; Smith and Lowe, 1991; Coussot and Meunier, 1996; Vallance, 2000; Lavigne and Thouret, 2002). The lahars simulated in this study repre-sent debris flow types with sediment concentrations similar to the observed ice-melt-triggered lahars on Popocat´epetl in 1997 and 2001 (Julio Miranda and Delgado Granados, 2003; Capra et al., 2004; Julio Miranda et al., 2005).
Satellite remote sensing has been widely used in volcanic studies (Kerle and Oppenheimer, 2002; Pieri and Abrams, 2004) while GIS tools and computer based models became increasingly important during the past years, for example, for calculating the runout paths of potential lahars (Iverson et
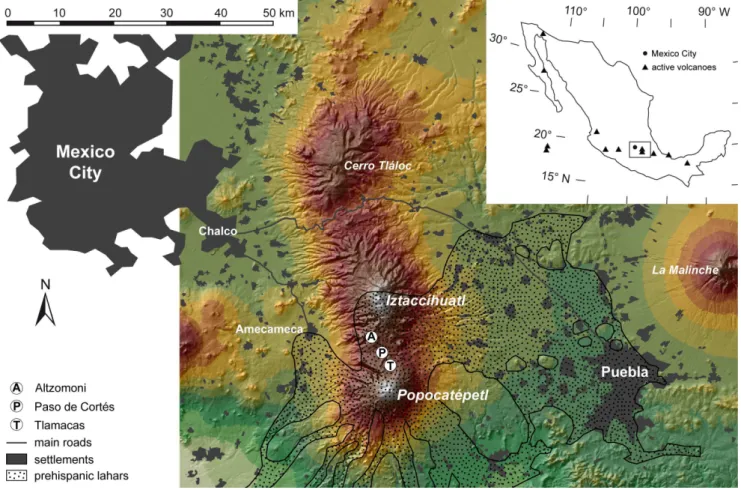
Fig. 1. Upper right: Location of the most active volcanoes and the study area within Mexico. The coloured shaded relief showing Mexico
City, the study area and Puebla is derived from SRTM3 elevation model. The dotted area shown as ‘prehispanic lahars’ represent the approximate extent of areas flooded by repeated lahar events from Popocat´epetl, Iztacc´ıhuatl and La Malinche after Siebe et al. (1996).
al., 1998; Julio Miranda and Delgado Granados, 2003; Sheri-dan et al., 2005; Walder et al., 2005; Hubbard et al., 2006; Davila et al., 2007; Huggel et al., 2008). By applying such tools to Iztacc´ıhuatl volcano in Mexico, we show how an ini-tial hazard evaluation can be carried out relatively fast and at low cost.
1.1 Iztacc´ıhuatl volcano: setting and background
Iztacc´ıhuatl (5230 m a.s.l.) is a major Quaternary volcanic complex within the Trans-Mexican Volcanic Belt (TMVB) consisting of various craters, with the principal volcanic vents aligned along a N-NW to S-SE axis (Figs. 1 and 2). The volcanic activity has been variously characterized as essentially extinct (Siebe and Mac´ıas, 2006), dormant (Nixon, 1989) or active (Delgado Granados et al., 2005). Ac-cording to Nixon (1989), the last activity with dacite flows took place at the northern flank at approximately 80 000 years BP. A major structural failure producing a giant debris avalanche to the E-SE side occurred several thousand years ago, just south of La Panza at the site of Las Rodillas (Siebe et al., 1995). Delgado Granados et al. (2005) reported diffuse
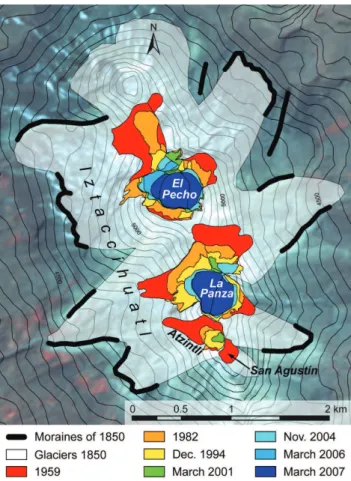
gas emissions at La Panza of Iztacc´ıhuatl. Based on this and the fact that lava flows from Iztacc´ıhuatl overlie volcanic de-posits from Popocat´epetl which are younger than 5000 years (Siebe et al., 1995), these authors considered Iztacc´ıhuatl to be an active volcano, following the definition that volcanoes with eruptive activity within the last 10 000 years are active. After Pico de Orizaba (also known as Citlalt´epetl, 5675 m a.s.l.) and Popocat´epetl (5452 m a.s.l.), Iztacc´ıhuatl is the third highest peak in Mexico and, like the other two volcanoes, is still covered by ice (Delgado Granados, 2007). The presence of glaciers in Mexico is noteworthy because at this latitudinal range there are no other glaciers worldwide. In reference to the silhouette of the volcanic edifice (similar to the shape of a woman lying on her back) the two main glacier systems are called El Pecho (the chest) at the summit and La Panza (the belly) 1 km to S-SE (Fig. 2 and Fig. 4). All the glaciers on Iztacc´ıhuatl have shown extensive retreat during the past 150 years.
Hazard evaluation for ice-volcano interactions is crucial at Mexico’s active ice-covered volcanoes. Since 1994, when the recent eruptive activity of Popocat´epetl volcano began,
lahars related to ice melting developed in 1997 and 2001. Both events reached the nearby village of Santiago Xalitz-intla, which is located 14 km away from the summit (Julio Miranda and Delgado Granados, 2003; Capra et al., 2004; Julio Miranda et al., 2005; Andr´es et al., 2007).
In prehistoric time, the area around Popocat´epetl and Iztacc´ıhuatl volcanoes was extensively inundated by la-hars which destroyed various human settlements (Fig. 1; Siebe et al., 1996). The material (essentially ash and pumice from Popocat´epetl) was released from the flanks of Popocat´epetl, Iztacc´ıhuatl and La Malinche volcano, and flooded over 2600 km2 (GIS calculation from the map in Siebe et al., 1996). If we assume an average thickness of the deposits of 2–5 m and a volumetric sediment content of 60%, the total lahar volume including water is about 9–22 km3 dur-ing numerous events over many years. These lahars are as-sumed to have been mainly related to heavy precipitation, but also to volcano-ice interactions (see Sect. 1.3).
1.2 Predisposition for lahars on Iztacc´ıhuatl
For the generation of lahars, the following three conditions are important: (1) availability of potentially erodible soil and debris (including thickness of source deposits and their phys-ical characteristics), (2) critphys-ical slope and channel gradient, (3) availability and amount of water.
Loose rock material is abundant at most of the summit areas of Iztacc´ıhuatl, consisting mainly of eroded dacites that are accumulated in large rock talus and moraines (Nixon, 1989). Pyroclastic material is observed on sev-eral parts of the volcano. At the lower and southernmost part (<4000 m a.s.l.), tephras from Popocat´epetl volcano de-posited over the last 5000 years can be found. Above 4300 m a.s.l., old and loose tephras from ancient eruptive activity from Iztacc´ıhuatl are abundant. Vegetation is lack-ing, so that the ground is not stabilized by plant mat-ter. Permafrost can be found at northern expositions above 4900 m a.s.l. (Palacios et al., 2007).
A digital terrain model (DTM) derived from the shuttle radar topography mission (SRTM) data of February 2000, reveals inclinations of >35–45◦(70–100%) around the
sum-mit area. Although the angle of repose of loose tephra has not been evaluated, we assume conditions close to the stabil-ity limits. Given that criteria (1) and (2) are fulfilled at the summit area of Iztacc´ıhuatl, the availability of water has to be the deciding factor for lahar formation. On Iztacc´ıhuatl volcano it can be released by precipitation or melting of the available ice and snow deposits.
1.3 Rain-triggered and glacier-related lahars
Frequency of lahars and precipitation intensity are of-ten strongly correlated (Lavigne and Thouret, 2002; Van Westen and Daag, 2005). On the slopes of Iztacc´ıhuatl and Popocat´epetl, small lahars occur commonly during the rainy
Fig. 2. The silhouette of Iztacc´ıhuatl resembling a lying woman
as believed by indigenous Mexican people, seen from the west: La Cabeza (head), El Pecho (chest), La Panza (belly), Las Rodillas (knees) and Los Pies (feet). El Pecho and La Panza are still glacier clad. Picture taken on 21 November 2004 by D. Schneider.
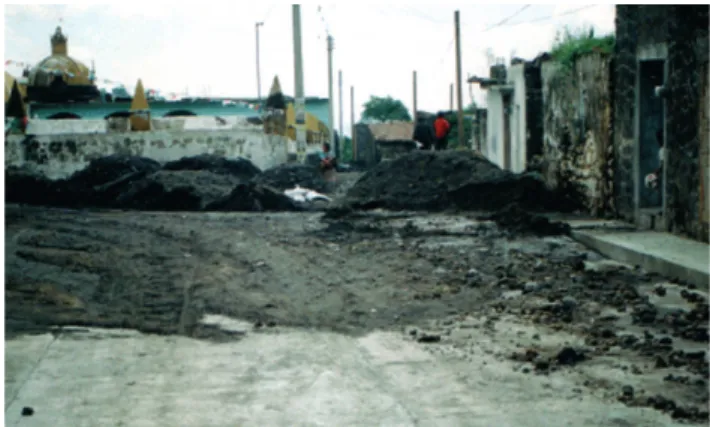
Fig. 3. View of the streets of Santiago Xalitzintla showing the
de-posit of a rain-triggered lahar generated on Iztacc´ıhuatl’s southeast-ern flanks with deposits erupted from Popocat´epetl. Picture taken on 20 June 1994 by H. Delgado Granados.
season. For instance, a rain-triggered lahar occurred on 20 June 1994 (six months prior to the initiation of the current eruptive activity at Popocat´epetl volcano). After a heavy rainfall, a relatively small lahar reached, entered, and de-posited volcanic ash and debris on the streets of the vil-lage Santiago Xalitzintla, situated at the confluence of out-lets from Iztacc´ıhuatl and Popocat´epetl (Fig. 3). The mate-rial was mainly tephra from past eruptions of Popocat´epetl but deposited on the southeastern flanks of Iztacc´ıhuatl and then remobilized by the heavy precipitation event.
The highest climate station around Iztacc´ıhuatl which de-livered data for many years was at about 4000 m a.s.l. on the western slope, but the data were not available for this study. In 1970 the ‘Instituto de Geograf´ıa de la UNAM’ published a climate map at a scale of 1:500 000, showing that September is the rainiest month. It is notable that at elevations above 5000 m a.s.l. precipitation can be >1000 mm/year with an
Fig. 4. Glacier outlines for eight different dates. Contour line
inter-val is 50 m and the background image is the ASTER VNIR scene of March 2001.
average of 950 mm/year (Guerra-Acevedo, 2006).
Scenarios for water release from ice and snow leading to a potential lahar generation on Iztacc´ıhuatl can be:
1. An eruptive activity interaction at Iztacc´ıhuatl volcano. 2. An eruptive activity interaction from Popocat´epetl
vol-cano.
3. A non-eruptive volcanic and/or a climatically related in-teraction.
Scenario 1 may have the highest impact but the probabil-ity of occurrence is low as Iztacc´ıhuatl is considered to be active but dormant. Deposition of ash from Popocat´epetl onto the glaciers of Iztacc´ıhuatl as proposed in scenario 2 is a possibility that could occur at any future eruptive event at Popocat´epetl if the wind direction is heading northwards as it occurred in the past (Siebe et al., 1996). This could lead to intensified melting of the glaciers and possibly trig-gering of lahars. The third scenario includes local melting of snow, ice and permafrost connected to geothermal volcanic influence (Abramov et al., 2008 in press) or seasonal melt-ing. This can lead to subglacial, supraglacial or proglacial water reservoirs and moraine dammed lakes which are prone
to outbursts. Such observations have repeatedly been made in volcanic (Russell and Knudsen, 2002) and non-volcanic glacial environments (Haeberli, 1983).
The importance of ice, firn, snow and permafrost in lahar formation at Iztacc´ıhuatl has not yet been investigated and there are no records of such events. In order to provide a related initial hazard assessment we modelled hypothetical flows originating from the glaciated areas. By establishing scenarios using different volumetric lahar magnitudes and DTMs of 30–90 m resolution, we can approximately define the areas around the entire Iztacc´ıhuatl edifice that could be affected in case of sufficient water release from Iztacc´ıhuatl’s glaciers.
2 Data and methods
We used the following data and methods to analyze the glacier dynamics for evaluation of present and future ice con-ditions for lahar generation at Iztacc´ıhuatl. The satellite im-agery used was acquired by the Advanced Spaceborne Ther-mal Emission and Reflection Radiometer (ASTER) onboard the NASA Terra satellite. ASTER scenes consist of 3 visi-ble and near infrared channels (VNIR; bands 1/2/3N; 0.52– 0.86 µm), a back-looking channel (band 3B; 0.76–0.86 µm), 6 short wave infrared channels (SWIR; bands 4–9; 1.6– 2.43 µm), and 5 thermal infrared channels (TIR; bands 10– 14; 8.13-11.65 µm) (Toutin, 2002). In false colour compos-ite images (channels 3N/2/1; 9/4/3N and 10/9/4, correspond-ing to red/green/blue) of an ASTER scene from 17 March 2001, the large Little Ice Age (LIA) moraines are easily visi-ble (White, 2002). Together with the LIA moraines shown in the 1:50 000 geologic map by Nixon (1989) and the 1:50 000 topographic map published by INEGI (1995), the moraines were mapped and the last glacial maximum extent was re-constructed (Fig. 4). The exact year of the LIA maximum for Mexican glaciers is not known but is assumed to be around 1850/1860 AD as is the case for comparable tropical glaciers in the Andes (Ram´ırez et al., 2001; Ceballos et al., 2006).
The oldest detailed map of the glaciers on Iztacc´ıhuatl was made by Lorenzo (1959). However, there remains an uncertainty concerning the exact year of data collection. Lorenzo (1959) used aerial photographs taken in 1945 as a guide but the field work was probably carried out in 1958. Therefore, the glacier extent derived from Lorenzo (1959) is assumed to represent the situation at around 1959. Addition-ally, there exists a 1:20 000 scale orthophoto map, published by INEGI (1983). The photographs used were taken in 1982 and one of the authors (H. Delgado) manually mapped the glacier extent for the same year. The best available data for glacier mapping consisted of aerial photographs, taken on 27 December 1994. They were orthorectified by the authors of this contribution and the glaciers were mapped with a GIS. Discrimination of snow and ice was simplified by analogue stereo interpretation.
The ASTER data with its medium spatial resolution (VNIR 15 m, SWIR 30 m, TIR 90 m; Toutin, 2002), is of-ten not useful for repeated mapping of the changes in glacier extent at a high temporal resolution. However, within pe-riods of several years, these low-cost images are adequate if the changes in glacial extent are significantly larger than the pixel size (15 m in this case). In our study, the time span between the aerial images from December 1994 to the ASTER-scene of March 2001, and the corresponding glacier retreat turned out to be sufficient to quantify changes. To get a distinct classification of the glaciers, band ratio images were calculated by dividing the VNIR channel 3N through the SWIR channel 4. This method takes advantage of the strong decrease of reflectance of snow and ice between the near-infrared channel 3N and the shortwave-infrared chan-nel 4 as compared to other materials (Paul et al., 2002). The resulting ratio images depict ice and snow in bright contrast to the dark grey values for debris and rocks.
In late November 2004, two field visits were carried out. On 23 November 2004, the glaciers were mapped with the aerial photograph of 1994 as a reference. Due to inacces-sibility and inviinacces-sibility from the top, the glacier tongues at the steepest parts in the NW and E of El Pecho could not be mapped exactly. At these areas, the glacier extent mapped from the ASTER image of 2001 was taken as a maximum extent for 2004. However, the glacier tongues very likely re-treated during the intervening 3.5 years, so that the glaciated area given for 2004 represents an upper limit for the real area in 2004.
Finally, the time series has been extended by two more re-cent ASTER-scenes from 15 March 2006 and 2 March 2007. Surprisingly, significant changes on El Pecho glacier could be detected even in the 1 year period between these two most recent images.
The DTM used in this study was taken from the Shuttle Radar Topography Mission (SRTM), acquired in February 2000 at approximately 30 m and 90 m resolution (Rabus et al., 2003). Here, the SRTM version with 3 arcsec spatial res-olution, that is approximately 90 m, was used (SRTM3). In order to have a second DTM with a potentially better spa-tial resolution and to analyse the influence of the DTM accu-racy on the modelled flows, DTMs with a grid size of 30 m and 60 m respectively were processed from the March 2001 Terra/ASTER channels 3N (nadir looking) and 3B (looking 27.6◦back from nadir; K¨a¨ab, 2005; K¨a¨ab et al., 2005). The spatial resolutions of 90 m, 60 m and 30 m for terrain eleva-tion data is considered to be adequate for an initial, large-scale hazard assessment of the entire Iztacc´ıhuatl edifice.
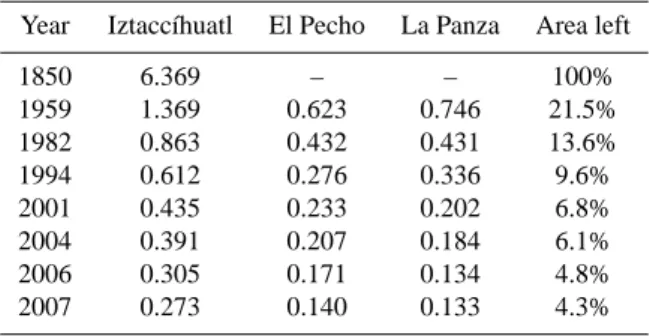
Table 1. Glacier areas in km2and percentaged in relation to the 1850 extent. The area listed as ‘Iztacc´ıhuatl’ is the sum of the indi-vidual ‘El Pecho’ and ‘La Panza’ glacier systems.
Year Iztacc´ıhuatl El Pecho La Panza Area left
1850 6.369 – – 100% 1959 1.369 0.623 0.746 21.5% 1982 0.863 0.432 0.431 13.6% 1994 0.612 0.276 0.336 9.6% 2001 0.435 0.233 0.202 6.8% 2004 0.391 0.207 0.184 6.1% 2006 0.305 0.171 0.134 4.8% 2007 0.273 0.140 0.133 4.3%
3 Past and future development of the glaciers on Iz-tacc´ıhuatl
3.1 Glaciated area
Comparison of the collected data reveals strong changes in glacier extent during the past decades on Iztacc´ıhuatl. Fig-ures 4 and 5 show the glacier retreat, and in Table 1 the corresponding absolute and relative values are given. As a simplification, the different glaciers were grouped into two systems: El Pecho and La Panza. The areas of the smaller glaciers Atzintli and San Agust´ın (now disappeared) south of La Panza are counted into the La Panza system. If one takes the 1850 extent (6 369 000 m2) as a reference, only 4.3% (273 000 m2)of the glaciated area remained in March
2007. During the more recent 48-year period between 1959 (1 369 000 m2)and 2007 (273 000 m2), around 80% of the glaciers disappeared. This is in accordance with the general worldwide trend of glacier shrinkage (Zemp et al., 2007) but the retreat rate is extraordinarily high compared to the global average. Kaser and Osmaston (2002) made similar observa-tions specifically on tropical and subtropical glaciers around the world. The observations emphasize the higher sensitivity of glaciers in lower latitudes to global atmospheric warming. A regional influence on climate at Iztacc´ıhuatl by the signifi-cant emissions of the megacity of Mexico City (at a distance of only ∼40 km to the NW) might also play a role.
3.2 Glacier altitude and thickness
Along with the glacier area shrinkage, the former con-vex glacier shape on El Pecho has changed now to a thin ice body with a concave surface. Photographs from the mid-20th century show the crater of El Pecho sum-mit covered by a massive convex ice cap. The altitude at the highest part of the glacier was formerly indicated as 5286 m a.s.l. (Lorenzo, 1959), but the current official altitude is 5,230 m a.s.l. (INEGI, 1995). If one excludes a change of the surveying height basis, this difference in elevation can be indicative of the decrease in glacier thickness. Within the last
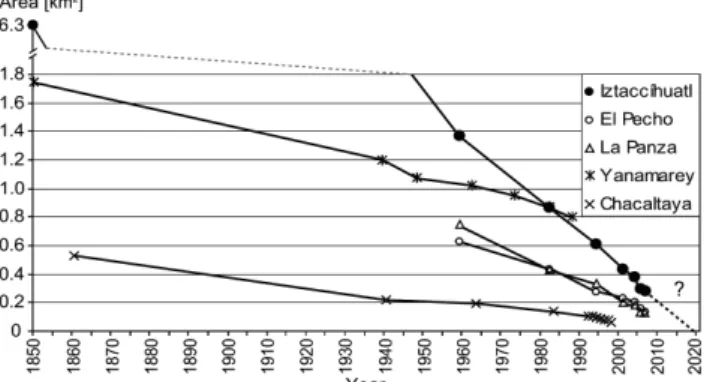
Fig. 5. Decreasing glacier extent at Iztacc´ıhuatl (Mexico, 19◦N) compared to the glaciers Yanamarey (Peruvian Cordillera Blanca, 16◦S; data from Kaser and Osmaston, 2002) and Chacaltaya (Bo-livia, 9◦40′S; data from Ram´ırez et al., 2001) through time (years AD). On Iztacc´ıhuatl volcano, the two glaciated parts ‘El Pe-cho’ and ‘La Panza’ are shown separately and summarized as ‘Iz-tacc´ıhuatl’. These two parts were connected in 1850 AD and hence there is no separate data for ‘El Pecho’ and ‘La Panza’ for that date. Note the break in the y-axis and the possible future development of the glaciated area (dotted line).
decades, the height of the original peak, which was in the centre of the glacier, decreased greatly. In 2004, the crater rims on the south and north of the El Pecho glacier emerged from the melting ice and finally became the new peaks of Iz-tacc´ıhuatl (A and B in Fig. 6). Handheld GPS measurements in November 2004 yielded a height of 5210 m a.s.l. (vertical accuracy in the order of tens of meters) for both crater rims and 5195 m a.s.l. for the centre of the glacier, where the main peak of the volcano was formerly located. The maximum height of this point on the SRTM3 DTM is 5211 m a.s.l. for the date of the acquisition in February 2000, with an abso-lute vertical accuracy of ±16 m (Smith and Sandwell, 2003). The ASTER DTMs reveal maximum values of 5196 and 5176 m a.s.l. in March 2001 for the 30 m and 60 m DTM grids, respectively, with a vertical accuracy in mountainous terrain generally being at ±30 m (Eckert et al., 2005; K¨a¨ab et al., 2005). Considering that the summit area of El Pecho is represented as an almost flat region, a fact that often im-proves the height accuracy, and all the above independent measurements, we arbitrarily choose 5200 m a.s.l. ±15 m as an approximate reference for the altitude of the centre of the El Pecho glacier between the years 2000 and 2004. The al-titude in 2007 could be several meters lower due to further thinning of the ice on El Pecho.
Analysing the contour lines on Lorenzo’s glacier map of 1959, we derive a height of 5270 m a.s.l. for the peak in the centre of the glacier. Compared to the value of ∼5200 m a.s.l. around the year 2004, the difference is 70 m within a ∼45 year period, corresponding to more than 1.5 m vertical de-crease of ice per year. The loss of ice thickness on La Panza, situated 200 m lower in elevation, is also remarkable. Dur-ing the same period, there is a vertical decrease of 30 m or
0.7 m per year. This value is confirmed by photographs of a large rock buried in the ice, which was barely visible in early photographs. Today it extends ∼25 m above the ice surface. 3.3 Climatic influence
In order to estimate the climatic influence on their retreat, Iztacc´ıhuatl’s glaciers should be compared to similar Mexi-can glaciers. Unfortunately, this is difficult because there are only two other ice-clad volcanoes and both are not adequate for comparison:
– The glaciers of Iztacc´ıhuatl’s southern neighbour
Popocat´epetl (5452 m a.s.l.) have been strongly affected by the eruptive activity since 1994, in particular in 1997 and 2001 (Julio Miranda and Delgado Granados, 2003; Julio Miranda et al., 2005).
– The glaciers of Pico de Orizaba are much larger, reach
up to 5675 m a.s.l. and therefore still benefit from an intact accumulation area (White, 2002; Delgado Grana-dos, 2007).
Hence, we show in Fig. 5 the retreat of two tropical glaciers on the southern hemisphere with similar climatic conditions, comparable size and altitude range: Yanamarey glacier is situated in the Peruvian Cordillera Blanca at 9◦40′S at an altitude between 4750 and 5000 m a.s.l. (Kaser and Os-maston, 2002) while Chacaltaya glacier is at 16◦S between 5140 and 5360 m a.s.l. in Bolivia (Ram´ırez et al., 2001). The area of Iztacc´ıhuatl’s individual glacier systems El Pecho and La Panza lies in between the two other glaciers shown, while the total glaciated area on Iztacc´ıhuatl is similar to the area of Yanamarey glacier during the past few decades. Although the glaciated area of the latter was a fourth of the one on Iztacc´ıhuatl in 1850 AD, during recent times Iztacc´ıhuatl’s glaciers became smaller than Yanamarey. Chacaltaya glacier also shows a slower retreat than Iztacc´ıhuatl’s glaciers. How-ever, caution is needed for this comparison, because many basic factors such as high altitude precipitation and solar ra-diation due to cloud cover, etc. are not the same in these dif-ferent regions.
3.4 Volcanic influence
The fact that the higher El Pecho glacier has a vertical melt-ing rate approximately twice as fast as the lower La Panza glacier (1.5 m/yr. and 0.7 m/yr. respectively; see Sect. 3.2) leads to the hypothesis that – beyond climatic effects – at least a part of the very fast vertical downwasting of the glacier on El Pecho could be induced by geo- or hydrother-mal volcanic heat flow.
In the southern part of El Pecho glacier a notable feature was observed. On aerial images from 1977 a small dark point appears on the glacier of El Pecho. On the airphotos from 1994 there is a large pit at the same location, which was also observed during fieldwork in 2001. In 2004 the pit
had developed into a crevasse-like opening of about 50 m in length (Fig. 6). The feature is situated in the middle of the glacier in a concave area where shear and extensional stresses in the ice are expected to be minor. This atypical location for crevasse development suggests that the form could be related to a locally confined heat source, e.g. a fumarole beneath the glacier, where geothermal heat flux is considerably higher (Welch et al., 2007). No vapour or sulfur smell was observed at this location but the influence of volcanic heat flow on glacier retreat at El Pecho is supposed to contribute to the ablation. The glacier may serve here as a giant calorimeter, as has been reported for example at Mt. Wrangell, Alaska, by Benson and Motyka (1978) and Benson et al. (2007).
Close to La Panza, Delgado Granados et al. (2005) in-stalled a volatile trap in 1999 and measured Na+, K+, Ca+, Mg+, SiO
2, SO2−4 , as well as F−, which suggest a magmatic
source of the vapours. A strong sulfur odour could also be detected at two points around La Panza during field trips in November 2004. Delgado Granados et al. (2005) further re-port earthquakes that have been measured by seismic stations of the National Seismological Service (NSS) at Altzomoni and Tlamacas (A and T in Fig. 1). The origin of these seis-mic events was identified to lie beneath Iztacc´ıhuatl volcano (J. Pacheco, former head of the NSS; personal communica-tion). Delgado Granados et al. (2005) reported temperature measurements between 0–10◦C at the ground and 0.1 m be-low the surface at La Panza region, and glacier-ice temper-atures ranging from −2.0◦C and up to 0.5◦C at depths be-tween −6 m and 0 m beneath the glacier’s surface. The mea-surements indicate an increased volcanic heat flow and tem-perate glacier bed conditions. The existence of liquid water in englacial water reservoirs has already been reported by
´
Alvarez and Delgado (2002) who carried out GPR (ground penetrating radar) profile measurements through La Panza glacier.
3.5 Current and future hazard scenarios
Observations of ablation and accumulation area over the past years indicated that the equilibrium line altitude (ELA) rose above the top of El Pecho, transforming the entire glaciers into an ablation area. The ELA only sinks for a short time period below the summit, and throughout the year ablation dominates on all the parts of the glaciers. If we linearly ex-trapolate the down-wasting trend of the ice, the glaciers will survive no longer than 2020 (Fig. 5). In a long term view this may reduce the risk of any volcano-ice interaction and subse-quent lahar formation. Seasonal snow cover, permafrost, and some relict ice fields may however be preserved beyond this date. Firn and snow can be even more important for lahar for-mation than ice in case of interaction with eruptive volcanic activity (Pierson et al., 1990).
An eruption of Iztacc´ıhuatl volcano is currently unlikely. More probable is the development of hazards directly or in-directly related to glacier shrinkage, such as formation of
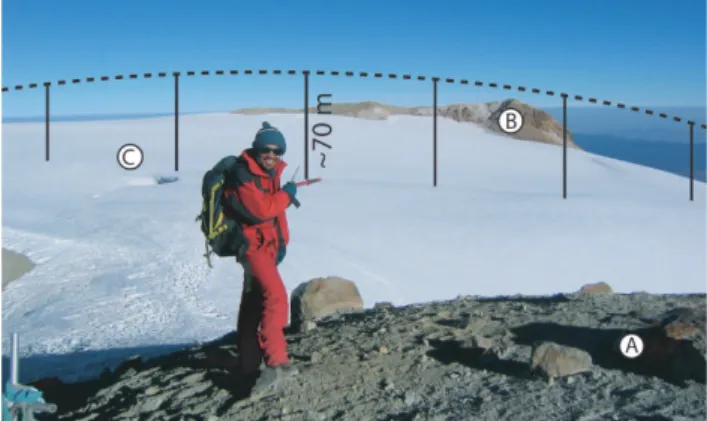
Fig. 6. El Pecho Glacier from south to north with the southern crater
crest line (A) and the former ice clad northern crest line (B). A large crevasse is situated in the middle of the crater glacier (C). Note the current concave glacier shape in contrast to the former convex reconstructed surface of 1959, indicated by the dashed black line. The height difference at the centre of the glacier is around 70 m. Picture taken on 22 November 2004 by D. Schneider.
a crater lake during or following glacier recession, release of sediment from basal moraines, slope destabilization by glacial retreat and permafrost thawing. For more detailed assessment of these factors, further data, including detailed GPR profiles of the El Pecho area and precipitation data of the summit region, should be collected.
4 Lahar modelling
4.1 Lahar model description
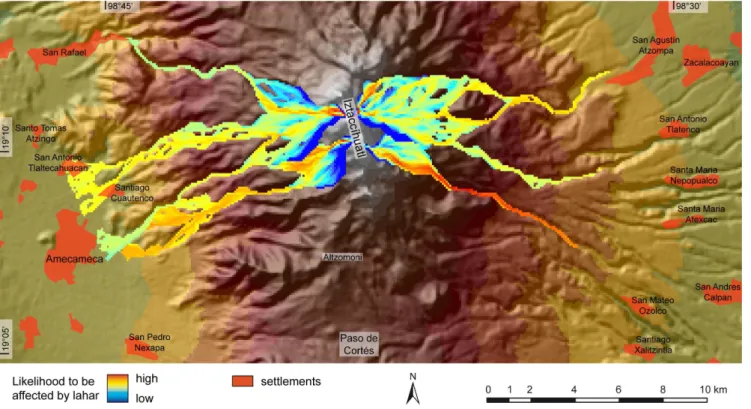
Two different flow models were used to simulate the potential lahar flow paths. The first one is the modified single-flow-direction (MSF) model by Huggel et al. (2003), which is fur-ther developed from the D8 flow direction method (Marks et al., 1984). Model input parameters are the starting cell lo-cation, a DTM and an empirical value for the H/L ratio (see below). The flow direction is calculated from each cell to one of its eight neighbours (D8), either adjacent or diagonal, in the direction of the steepest descent. In order to prevent stream width being represented by only one pixel, Huggel et al. (2003) implemented a function that enables flow di-version from the steepest flow direction. The more the flow diverts from the steepest descent direction, the higher the cor-responding flow resistance. The resistance values are trans-formed into a semi-quantitative likelihood for each cell being affected by the lahar (Fig. 7). The modelled flow stops when it reaches a specified average slope value. This slope value is defined as the ratio between the vertical drop H at the flow initiation area and the horizontal distance L along the curv-ing flow path to the lowest deposit (H/L; Fig. 8; Huggel et al., 2003). Actually, depending on the sediment concentra-tion, lahars can be highly mobile and show rather
attenuat-Fig. 7. MSF model (Huggel et al., 2003) with an H/L of 0.19 (see attenuat-Fig. 8) on the colour shaded SRTM3 DTM. Lahars were only modelled
from the glaciers on El Pecho and La Panza to the east and west side so that the flows only represent lahars related to the glaciers.
Fig. 8. Schematic view of a volcano and the difference between the
H/L ratio used in the MSF model and the H’/L’ required for LA-HARZ. The division into a higher part where lahars erode material and a lower section where deposition dominates is needed to define the high-energy cone used in LAHARZ.
ing flow characteristics than abrupt stopping as granular de-bris flows. In the MSF model this is usually accounted for by choosing a minimum H/L value corresponding to a maxi-mum flow reach.
The second model applied in this study was LAHARZ by Iverson et al. (1998). They examined 27 lahar paths on nine volcanoes and derived two semi-empirical equations predict-ing the inundated valley cross-sectional areas and the plani-metric areas as a function of the lahar volume. The model assumes the simplification that there is only erosion above the limit of a ‘high-energy cone’ and only deposition be-low it (notwithstanding, erosion and deposition usually oc-cur in conjunction). Similarly to MSF, the high-energy cone has to be defined by an H’/L’ ratio which differs from the
H/L used for MSF. The H’/L’ ratio is the height and length from the highest point down to the limit of the high-energy cone where deposition starts, but not as far as to the lowest deposit (Fig. 8). As soon as the flow exceeds the limit of the high-energy cone, the model starts to calculate 3 valley cross-sections (at angles of 45◦, 90◦ and 135◦ to the flow direction) which are filled corresponding to the first semi-empirical equation (Iverson et al., 1998). All inundated cells are marked as potentially affected by a lahar and added up until an area defined by the second semi-empirical equation is reached and the flow stops. The input parameters are po-tential lahar volumes, an appropriate H’/L’ ratio for the bor-der of the high energy cone, and a DTM. The ratio of sedi-ment to water content of the simulated lahars corresponds to an average of those 27 examined lahars, from which the most diluted ones were excluded (Iverson et al., 1998). Hence, LAHARZ simulates typical debris flow-type lahars and the water content can not be varied.
4.2 Results of the MSF model
The MSF model was first run using the SRTM3 DTM from the glaciers on El Pecho and La Panza to the west and east side. H/L ratios for the lahar modelling between 0.2 and 0.15 were used, corresponding to published case studies (Siebe et al., 1996; Vallance et al., 2001; Capra et al., 2004). The volumes of debris flows correlate with the H/L
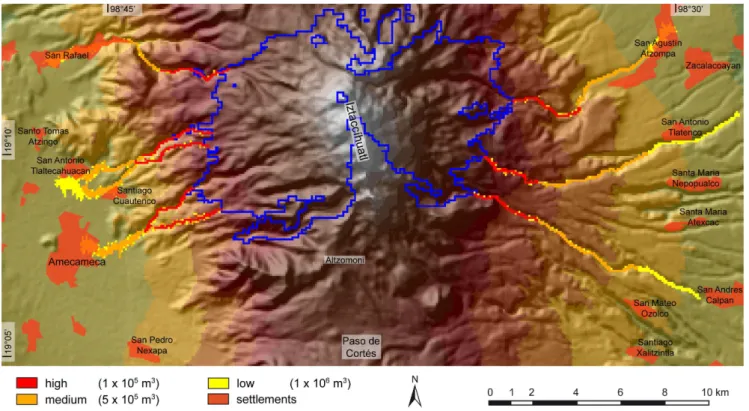
ra-Fig. 9. LAHARZ (Iverson et al., 1998) model on the colour shaded SRTM3 DTM. The dark blue line around the summit is the high-energy
cone with an H’/L’ of 0.28 (see Fig. 8). The lahars were modelled for the same drainage paths as with the MSF model. Red, orange and yellow represent different lahar volumes with corresponding degree of hazard (high, medium, low). LAHARZ does not model erosion in the upper part above the high-energy cone.
tio as demonstrated for lahars at Popocat´epetl volcano by Huggel et al. (2008). That means that the greater the vol-ume of a debris flow, the smaller is the corresponding H/L ratio (Legros, 2002). After the relation given by Huggel et al. (2008), the chosen values approximately represent vol-umes between 1×10⁵m3and 1×10⁷m3.
Above 3700 m a.s.l., the results show a strong flow diver-gence, with high probabilities that the main drainage paths would be affected, and only low probabilities that broader lateral extents would be inundated. Below 3700 m a.s.l., the flows are channelized in deep ravines heading towards pop-ulated areas. On the west side the lahars reach some set-tlements at an H/L of 0.2 (namely San Rafael, San Antonio Tlaltecahuac´an and Santiago Cuautenco), whereas the city of Amecameca would be affected with an H/L lower than 0.19. On the east side only San Agust´ın Atzompa would be hit par-tially if the H/L value falls below 0.17 (Fig. 7).
4.3 Results of the LAHARZ model
For the LAHARZ model the H’/L’ ratio, which defines the border of the high-energy cone, had to be determined (Fig. 8). To this end, we analysed the lahars at Popocat´epetl which occurred during its eruptions in 1997 and 2001. In both cases, the village of Santiago Xalitzintla SE of
Iz-tacc´ıhuatl (Fig. 9) was hit by the lahars with volumes of about 4×10⁵m3(Capra et al., 2004; Julio Miranda et al., 2005). We calculated several high-energy cones to ascertain that the modelled LAHARZ flow of 4×10⁵m3just reached the vil-lage of Santiago Xalitzintla as it happened in 1997 and 2001. Within these simulations we obtained a best-fit-value of 0.28 for the H’/L’ at Popocat´epetl. Assuming similar conditions at Iztacc´ıhuatl, we used the same H’/L’ value for the LA-HARZ model runs on Iztacc´ıhuatl. For comparison, Iverson et al. (1998) used an H’/L’ of 0.23 at Mount Rainier in the US, and Davila et al. (2007) used a much lower value of 0.04 for Colima volcano in Mexico. The latter value is proba-bly more appropriate for hyperconcentrated flows than for debris-flow-like lahars. With such a value the high-energy cone would lie completely in the alluvial plane and hence, it seems far too low for Iztacc´ıhuatl volcano.
We assume an average ice thickness of 30 m (GPR data from Delgado Granados et al., 2005) over the whole glaciated area. Consequently, the total ice volume in 2007 was roughly 8.2×10⁶m3. On the basis of ice availability, as well as the volume of the 1997 Popocat´epetl lahar (4×10⁵m3; Julio Mi-randa et al., 2005), we defined hypothetical lahar volumes at Iztacc´ıhuatl as 1×10⁵m3, 5×10⁵m3and 1×10⁶m3. These volumes correspond to flows generated from melting of 0.5, 2.4 and 4.9% of the total ice volume on Iztacc´ıhuatl,
assum-ing a 40% water content in volume (boundary between debris flows and hyperconcentrated flows; Pierson and Scott, 1985; Pierson, 1986; Vallance, 2000; Lavigne and Thouret, 2002). The mass of ice lost is typically larger than the amount of water contributing to a possible lahar because not all melt-water is incorporated into the flows (Thouret, 1990; Julio Miranda et al., 2005). These volumes are plausible for the possible scenarios without any additional water from rainfall (as described in 1.3.) and lie within the range of modelled la-har volumes at Concepci´on Volcano in Nicaragua (Vallance et al., 2001) and at Colima in Mexico (Davila et al., 2007). Larger or more diluted lahars, which also may reach farther, are assumed to develop only as a combination of glacier-volcano interaction processes and rainfall events with shal-low landsliding and additional sediment entrainment. This case seems to have a low probability. For that reason and the fact, that the sediment content can not be varied in LAHARZ (see Sect. 4.1), we do not present model results for lahars larger than 106m3.
On the west side, the LAHARZ-flows reach San Rafael, San Antonio Tlaltecahuacan and Santiago Cuautenco with volumes less than 5×10⁵m3while Amecameca would only be reached with more than 5×10⁵m3. In the eastern part, the same effect as with the MSF model is observed. The ma-terial stays in the deep and narrow channels but as a conse-quence, the flows travel farther. Lahar volumes greater than 5×10⁵m3 reach San Agust´ın Atzompa in the NE. The af-fected town is situated at the mouth of a valley that drains from Iztacc´ıhuatl, similarly to Santiago Xalitzintla, which is situated completely in an erosion trench. However, most of the towns in the east are situated safely on the terraces in between the canyons, such that the ravines build a reason-able protection from lahars up to hypothetical volumes of 1×10⁷m3.
4.4 Influence of the DTM on lahar models
Huggel et al. (2008) have shown that the quality and reso-lution of the DTM can have an important effect on the flow paths and runout distances of simulated lahars. For the MSF model, the changes of the runout distance between the runs on the SRTM-DTM and the ASTER-DTM are minor. How-ever, small differences in the model terrain morphology can determine if a flow will find a way over a moraine or a nar-row crest line. If on one DTM the flow takes a different path than on the other DTM, the subsequent flow inundates a formerly unaffected valley providing completely different results. In this study, significant differences resulted from flows modelled on the ASTER DTMs with 30 m and 60 m resolution. They were of an unsatisfying quality, mainly due to large data gaps which had to be interpolated. The modelled lahars flowing through these interpolated areas are mostly of limited practical value. Comparison of individ-ual parts of the ASTER-DTMs to the topographic maps and to the SRTM3 DTM helped however to locate a number of
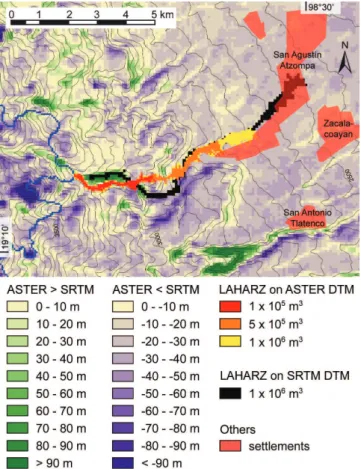
Fig. 10. Height difference of ASTER and SRTM DTM (ASTER
– SRTM). Green cells indicate areas where the ASTER DTM is higher than the SRTM DTM and the blue cells vice versa. Contour lines are derived from the SRTM DTM at an interval of 50 m. The black lahar was modelled on the SRTM DTM while the blue line (high energy cone with an H’/L’ of 0.28) and the colored lahars were calculated on the ASTER DTM. Problems with the ASTER DTM mainly occur in narrow ravines which lead to incorrect deflection of the modelled lahar.
crucial points where the natural sidewalls of the downstream valleys are low or narrow, and larger lahars effectively could break through.
Concerning flow channel deviation, the LAHARZ model generally has fewer problems than the MSF because only the lower parts below the high-energy cone are simulated. There, the ravines are wider and better represented by the SRTM3 and ASTER DTMs than the areas in the summit region. However, analysis of the calculated lahars on the SRTM3 and ASTER DTMs revealed significant variations in the flow path at a problematic zone on the east side of Iztacc´ıhuatl (Fig. 10). To assess the quality of each DTM, contour lines were derived and compared to the topographic map and the ASTER VNIR image. It was found that the ASTER DTM is defective in this area (mainly due to stereo image matching problems), forcing the modelled lahar on a wrong flow path. This is visible in the subtraction DTM of the ASTER- and SRTM-data (Fig. 10). Two erroneous areas with exaggerated
heights up to 100 m (green) fall directly within the flow path, deflecting the lahar stream. Despite the abbreviation of the path, the lahar modelled on the ASTER DTM is still stop-ping earlier. This effect was observed for each modelled flow and we interpret grid cell size to be an important influence on runout distance calculated by the LAHARZ model. The flows inundate a wider path on the ASTER DTM (60 m) than on the SRTM3 DTM (90 m) and hence on the ASTER DTM, less material is transported downwards. This leads to signif-icantly shorter distal hazard zone boundaries. A lahar mod-elled on the SRTM3 DTM at the northeastern slope and with a volume of 1×10⁶m3affects the central part of San Agust´ın Atzompa while the same volume on the ASTER DTM stops 2.5 km upstream and represents no hazard for the settlement (Fig. 9 and 10; this effect was also observed by Huggel et al., 2008). Stevens et al. (2002) found similar effects con-cerning the flow length on different DTMs but not to that ex-tent. Their terrain data were derived from topographic maps and an airborne SAR (TOPSAR by NASA) with 20 m and 10 m horizontal resolution respectively. In contrast to this, the hazard zonation of Davila et al. (2007) at Colima vol-cano in Mexico reveals higher lateral spreading and a 1.5 km shorter runout distance for the coarser DTM. Therefore we deduce that the behaviour of the LAHARZ model is highly dependent not only on the spatial resolution, but also on the acquisition method of the DTM.
5 Conclusions
The glacial recession on Iztacc´ıhuatl has been pronounced over the past decades and is likely to lead to total deglaciation within few decades, probably before ∼2020 AD. This trend is in accordance with observed worldwide glacier retreat in tropical regions that is attributed to atmospheric warming. In the case of Iztacc´ıhuatl glacier retreat may also be affected by an increase in the volcanic heat flow. The crevasse-like opening on El Pecho glacier may be the chimney of an ac-tive geo- or hydrothermal vent and should be investigated further, as should the diffuse degassing fields on La Panza. Gas emission measurements, GPR profiles (which have only been performed for one glacier on La Panza by Delgado Granados et al., 2005), and ground temperature measure-ments could provide a better understanding of the volcanic activity of Iztacc´ıhuatl, which has been under dispute dur-ing the last decades. The volcano is not necessarily ready to become active again but there appear to be some changes in the volcano’s hydrothermal system taking place. This could promote the development of subglacial water reservoirs and their possible outbursts may provide a sufficient amount of water for lahar formation. Within a 15 km radius of the sum-mit, a population of approximately 210 000 lives that could be affected by lahars, depending on the lahar volume.
Glacier-related hazards at Iztacc´ıhuatl are expected to de-cline over the next decade due to the rapid loss in glacier
area and volume, or even total glacier disappearance. How-ever, seasonal snow will still pose a hazard in the case of interaction with the volcano, and several new hazards are not related to volcanic activity: (1) the development of a crater lake at El Pecho due to climate related glacier retreat, which may be prone for outbursts and (2) destabilization of the over-steepened upper flanks due to glacial recession and permafrost thawing, which both could favour the initiation of lahars or landslides. The large amounts of unconsolidated debris which have been revealed by the retreat of the glaciers could be mobilized by heavy precipitation during the rainy season. Accurate precipitation data from the summit of Iz-tacc´ıhuatl do not currently exist, but a meteorological station will be installed soon by one of the authors. However, rain-triggered lahars are more common on lower slopes (Scott et al., 2001). The hazard potential of this individual trigger mechanism should be investigated in a separate study, espe-cially concerning a future eruption of Popocat´epetl with fol-lowing ash deposition on the slopes of Iztacc´ıhuatl that could be remobilized by heavy precipitation.
Concerning the safety of the surrounding villages, there is an important morphological difference between the west-ern and eastwest-ern flank. Deep incised valleys serve as natural stream channels, and therefore the location of villages rela-tive to the channel is crucial. On the west side, the ravines directly lead to the populated alluvial plane, while on the east side most of the villages are built on the higher, and hence safer, terraces between the ravines. More detailed studies are necessary to evaluate the need for mitigation measures such as deflection dams, retention basins or a warning sys-tem that would increase the safety of the settlements around Iztacc´ıhuatl.
The SRTM3 DTM represents the main drainage channels in a way that is sufficient for a large scale hazard assess-ment. In the present case, it provides more realistic results than the ASTER DTMs. However, the coarse resolution of the SRTM3 DTM allows less lateral deposition of material, a fact leading to exaggerated runout distances of the LAHARZ flows. As a consequence, for lahar hazard assessment, we emphasize the necessity of using different flow models in conjunction with mid- and high-resolution DTM data from various sources. Flow modelling on high-resolution DTMs would be helpful for detailed mapping of the hazard zone boundaries on the basis of the presented initial hazard as-sessment, but each simulation should be critically compared to results based on calculations on other DTMs.
Acknowledgements. Funding from CONACyT (grant 45433 to Hugo Delgado Granados) is acknowledged and we are indebted to Wilfried Haeberli for general support of this study. Essential assistance in Mexico was offered by Patricia Julio-Miranda, Isaac A. Farraz and Eduardo Rubio-Herrera. We are grateful for the constructive and careful reviews by Sarah Fagents and David Palacios.
Edited by: J. Marti
Reviewed by: S. Fagents and D. Palacios
References
Abramov, A., Gruber, S., and Gilichinsky, D.: Mountain per-mafrost on active volcanoes: field data and statistical mapping, Klyuchevskaya Volcano Group, Kamchatka, Russia, Permafr. P. P., 19, 1–17, 2008 in press.
´
Alvarez, R. and Delgado, H.: Characterization of a tropical ice body on Iztacc´ıhuatl volcano, Mexico, Proceedings of the Ninth Inter-national Conference on Ground Penetrating Radar, 4758, 438– 442, 2002.
Andr´es, N., Zamorano, J. J., Sanjos´e, J. J., Atkinson, A., and Pala-cios, D.: Glacier retreat during the recent eruptive period of Popocat´epetl volcano, Mexico, Ann. Glaciol., 45, 73–82, 2007. Benson, C. S. and Motyka, R. J.: Glacier – volcano interactions
on Mt. Wrangell, Alaska, Annual Report, Geophysical Institute, University of Alaska, Fairbanks, 25 pp., 1978.
Benson, C., Motyka, R., McNutt, S., L¨uthi, M., and Truffer, M.: Glacier-volcano interactions in the North Crater of Mt. Wrangell, Alaska, Ann. Glaciol., 45, 48–57, 2007.
Capra, L., Poblete, M. A., and Alvarado, R.: The 1997 and 2001 lahars of Popocat´epetl volcano (Central Mexico): textural and sedimentological constraints on their origin and hazards, J. Vol-canol. Geoth. Res., 131, 351–369, 2004.
Ceballos, J. L., Eusc´ategui, C., Ram´ırez, J., Ca˜non, M., Huggel, C., Haeberli, W., and Machguth, H.: Fast shrinkage of tropical glaciers in Colombia, Ann. Glaciol., 43, 1, 194–201, 2006. Coussot, P. and Meunier, M.: Recognition, classification and
me-chanical description of debris flows, Earth-Sci. Rev., 40, 209– 227, 1996.
Davila, N., Capra, L., Gavilanes-Ruiz, J. C., Varley, N., Norini, G., and Vazquez, A. G.: Recent lahars at Volcan de Colima (Mex-ico): Drainage variation and spectral classification, J. Volcanol. Geoth. Res., 165, 3–4, 127–141, 2007.
Delgado Granados, H.: Climate change vs. volcanic activity: Forcing Mexican glaciers to extinguish and related hazards. Proceedings of the First International Conference on the Im-pact of Climate Change on High-Mountain Systems, Instituto de Hidrolog´ıa, Meteorolog´ıa y Estudios Ambientales, Bogot´a, Colombia, 153–168, 2007.
Delgado Granados, H., Julio Miranda, P., ´Alvarez, R., Cabral-Cano, E., C´ardenas Gonzalez, L., Correa Mora, F., Luna Alonso, M., and Huggel, C.: Study of Ayoloco Glacier at Iztacc´ıhuatl vol-cano (Mexico): hazards related to volcanic activity – ice cover interactions, Z. Geomorphol., 140, 181–193, 2005.
Eckert, S., Kellenberger, T., and Itten, K.: Accuracy Assessment of automatically derived digital elevation models from ASTER data in mountainous terrain, Int. J. Remote Sens., 26, 9, 1943–1957, 2005.
Guerra-Acevedo, B.: Estudios de balance hidrol´ogico en la ladera oriental del volc´an Iztacc´ıhuatl, Master thesis, Universidad Aut´onoma de Chihuahua, Mexico, 154 pp., 2006.
Haeberli, W.: Frequency and characteristics of glacier floods in the Swiss Alps, Ann. Glaciol., 4, 85–90, 1983.
Haeberli, W., Frauenfelder, R., Hoelzle, M., and Maisch, M.: On rates and acceleration trends of global glacier mass changes, Ge-ogr. Ann. A, 81A, 4, 585–591, 1999.
Hubbard, B. E., Sheridan, M. F., Carrasco-Nunez, G., Diaz-Castellon, R., and Rodriguez, S. R.: Comparative lahar hazard mapping at Volcan Citlaltepetl, Mexico using SRTM, ASTER and DTED-1 digital topographic data, J. Volcanol. Geoth. Res., 160, 1–2, 99–124, 2006.
Huggel, C., K¨a¨ab, A., Haeberli, W., and Krummenacher, B.: Regional-scale GIS-models for assessment of hazards from glacier lake outbursts: evaluation and application in the Swiss Alps, Nat. Hazards Earth Syst. Sci., 3, 647–662, 2003,
http://www.nat-hazards-earth-syst-sci.net/3/647/2003/.
Huggel, C., Schneider, D., Julio Miranda, P., Delgado Granados, H., and K¨a¨ab, A.: Evaluation of ASTER and SRTM DEM data for lahar modeling: a case study on lahars from Popocat´epetl Volcano, Mexico, J. Volcanol. Geoth. Res., 170, 99–110, 2008. Instituto de Geograf´ıa de la UNAM: Carta de climas, Veracruz,
1:500 000, map no. 14Q-VI, 1970.
Instituto Nacional de Estad´ıstica Geograf´ıa e Inform´atica INEGI: Orthophoto map, 1:20 000, map no. E14B42-A, 1983.
Instituto Nacional de Estad´ıstica Geograf´ıa e Inform´atica INEGI: Topographic map, Huejotzingo, 1:50 000, map no. E14B42, 1995.
Iverson, R. M., Schilling, S. P., and Vallance, J. W.: Objective de-lineation of lahar-inundation hazard zones, GSA Bulletin, 110, 8, 972–984, 1998.
Julio Miranda, P. and Delgado Granados, H.: Fast hazard evalua-tion employing digital photogrammetry: Popocat´epetl glaciers, Mexico, Geof´ısica Internacional, 42, 2, 275–283, 2003. Julio Miranda, P., Gonzalez-Huesca, A. E., Delgado Granados, H.,
and K¨a¨ab, A.: Glacier melting and lahar formation during Jan-uary 22, 2001 eruption, Popocat´epetl volcano (Mexico), Z. Geo-morphol., 140, 93–102, 2005.
K¨a¨ab, A.: Combination of SRTM3 and repeat ASTER data for de-riving alpine glacier flow velocities in the Bhutan Himalaya, Re-mote Sens. Environ., 94, 463–474, 2005.
K¨a¨ab, A., Huggel, C., Fischer, L., Guex, S., Paul, F., Roer, I., Salz-mann, N., Schlaefli, S., Schmutz, K., Schneider, D., Strozzi, T., and Weidmann, W.: Remote sensing of glacier- and permafrost-related hazards in high mountains: an overview, Nat. Hazards Earth Syst. Sci., 5, 527–554, 2005
Kaser, G. and Osmaston, H.: Tropical Glaciers, International Hy-drology Series, Press Syndicate of the University of Cambridge, Cambridge, 207 pp., 2002.
Kerle, N. and Oppenheimer, C.: Satellite remote sensing as a tool in lahar disaster management, Disasters, 26, 2, 140–160, 2002. Lavigne, F. and Thouret, J.-C.: Sediment transportation and
depo-sition by rain-triggered lahars at Merapi Volcano, Central Java, Indonesia, Geomorphology, 49, 45–69, 2002.
Legros, F.: The mobility of long-runout landslides, Eng. Geol., 63, 301–331, 2002.
Lorenzo, J. L.: Los Glaciares de M´exico, Monograf´ıas del Insti-tuto de Geof´ısica, Universidad Nacional Aut´onoma de M´exico, M´exico D. F., 114 pp., 1959.
Marks, D., Dozier, J., and Frew, J.: Automated basin delineation from digital elevation data, Geo Processing, 2, 299–311, 1984. Nixon, G. T.: The geology of Iztacc´ıhuatl Volcano and adjacent
areas of the Sierra Nevada and Valley of Mexico, The Geological Society of America, Special Paper 219, 58 pp., 1989.
Palacios, D., Zamorano, J. J., and Andr´es, N.: Permafrost distri-bution in tropical stratovolcanoes: Popocat´epetl and Iztacc´ıhuatl
volcanoes (Mexico), Geophys. Res. Abstr., 9, 05615, 2007. Paul, F., K¨a¨ab, A., Maisch, M., Kellenberger, T., and Haeberli,
W.: The new remote-sensing-derived Swiss glacier inventory: I. Methods, Ann. Glaciol., 34, 1, 355–361, 2002.
Pieri, D. and Abrams, M.: ASTER watches the world’s volcanoes: a new paradigm for volcanological observations from orbit, J. Volcanol. Geoth. Res., 135, 13–28, 2004.
Pierson, T. C.: Flow behaviour of channelized debris flows, Mount St. Helens, Washington, in: Hillslope Processes, edited by: Abrahams, A. D., Allen and Unwin, Winchester, 269–296, 1986. Pierson, T. C.: An empirical method for estimating travel times for
wet volcanic mass flows, B. Volcanol., 60, 2, 98–109, 1998. Pierson, T. C. and Scott, K. M.: Downstream dilution of a lahar:
transition from debris flow to hyperconcentrated streamflow, Wa-ter Resour. Res., 21, 10, 1511–1524, 1985.
Pierson, T. C., Janda, R. J., Thouret, J.-C., and Borrero, C. A.: Per-turbation and melting of snow and ice by the 13 November 1985 eruption of Nevado del Ruiz, Colombia, and consequent mobi-lization, flow and deposition of lahars, J. Volcanol. Geoth. Res., 41, 17–66, 1990.
Rabus, B., Eineder, M., Roth, A., and Bamler, R.: The shuttle radar topography mission – a new class of digital elevation models ac-quired by spaceborne radar, ISPRS Journal of Photogrammetry and Remote Sensing, 57, 241–262, 2003.
Ram´ırez, E., Francou, B., Ribstein, P., Descloitres, M., Gu´erin, R., Mendoza, J., Gallaire, R., Pouyaud, B., and Jordan, E.: Small glaciers disappearing in the tropical Andes: a case-study in Bo-livia: Glaciar Chacaltaya (16◦S), J. Glaciol., 47, 157, 187–194, 2001.
Russell, A. J. and Knudsen, ´O.: The effects of glacier-outburst flood flow dynamics on ice-contact deposits: November 1996 j¨okulhlaup, Skeidar´arsandur, Iceland, Spec. Publ. Int. Ass. Sedi-ment., 32, 67–83, 2002.
Scott, K. M., Mac´ıas, J. L., Naranjo, J. A., Rodr´ıguez, S., and McGeehin, J. P.: Catastrophic debris flows transformed from landslides in volcanic terrains: mobility, hazard assessment, and mitigation strategies, U.S. Geological Survey, Professional Paper 1630, 59 pp., 2001.
Sheridan, M. F., Stinton, A. J., Patra, A., Pitman, E. B., Bauer, A., and Nichita, C. C.: Evaluating Titan2D mass-flow model using the 1963 Little Tahoma Peak avalanches, Mount Rainier, Wash-ington, J. Volcanol. Geoth. Res., 139, 1–2, 89–102, 2005. Siebe, C., Abrams, M. and Mac´ıas, J. L.: Derrumbes gigantes,
de-positos de avalancha de escombros y edad del actual cono del volcan Popocat´epetl, in: Volcan Popocat´epetl – Estudios Real-izados durante la crisis de 1994/95, edited by: Comite cientifico asesor CENAPRED-UNAM, 195–220, 1995.
Siebe, C., Abrams, M., Mac´ıas, J. L., and Obenholzner, J.: Repeated volcanic disasters in Prehispanic time at Popocat´epetl, central Mexico: Past key to the future?, Geology, 24, 5, 399–402, 1996. Siebe, C. and Mac´ıas, J. L.: Volcanic hazards in the Mexico City metropolitan area from eruptions at Popocat´epetl, Nevado de Toluca, and Jocotitl´an stratovolcanoes and monogenetic scoria cones in the Sierra Chichinautzin Volcanic Field, in: Neogene-Quaternary continental margin volcanism: a perspective from M´exico, edited by: Siebe, C., Mac´ıas, J. L., and Aguirre-D´ıaz, G. J., The Geological Society of America, Boulder, Colorado, Special Paper 402, 253–329, 2006.
Smith, B. and Sandwell, D.: Accuracy and resolution of shuttle radar topography mission data, Geophys. Res. Lett., 30, 9, 1467– 1470, 2003.
Smith, G. and Lowe, A.: Lahars: volcano–hydrologic events and deposition in the debris-flow – hyperconcentrated flow contin-uum, in: Sedimentation in Volcanic Settings, edited by: Fisher, R. V. and Smith, G., SEPM Special Publication, 45, 59–70, 1991. Stevens, N. F., Manville, V., and Heron, D. W.: The sensitivity of a volcanic flow model to digital elevation model accuracy: ex-periments with digitised map contours and interferometric SAR at Ruapehu and Taranaki volcanoes, New Zealand, J. Volcanol. Geoth. Res., 119, 89–105, 2002.
Thouret, J.-C.: Effects of the November 13, 1985 eruption on the snow pack and ice cap of Nevado del Ruiz volcano, Colombia, in: Nevado del Ruiz Volcano, Colombia, edited by: Williams, S. N., J. Volcanol. Geoth. Res., 41, 177–201, 1990.
Toutin, T.: Three-dimensional topographic mapping with ASTER stereo data in rugged topography, IEEE-TGARS, 40, 10, 2241– 2247, 2002.
Vallance, J. W.: Lahars, in: Encyclopedia of Volcanoes, edited by: Sugurdsson, H., Academic Press, 601–616, 2000.
Vallance, J. W., Schilling, S. P., Devoli, G., and Howell, M. M.: La-har Hazards at Concepci´on Volcano, Nicaragua, U.S. Geological Survey, 1–13 pp., 2001.
Van Westen, C. J. and Daag, A. S.: Analysing the relation between rainfall characteristics and lahar at Mount Pinatubo, Philippines, Earth Surf. Proc. Land., 30, 1663–1674, 2005.
Verstappen, H. T.: Volcanic hazards in Colombia and Indonesia: la-hars and related phenomena, in: Geohazards – Natural and man-made, edited by: McCall, G. J. H., Laming, D. J. C., and Scott, S. C., Chapman and Hall, 33–42, 1992.
Walder, J. S., LaHusen, R. G., Vallance, J. W., and Schilling, S. P.: Crater glaciers on active volcanoes: hydrological anoma-lies, EOS, Transactions, American Geophysical Union, 86, 50, 521/528, 2005.
Welch, B. C., Dwyer, K., Helgen, M., Waythomas, C. F., and Ja-cobel, R. W.: Geophysical survey of the intra-caldera icefield of Mt. Veniaminof, Alaska, Ann. Glaciol., 45, 58–65, 2007. White, S. E.: Glaciers of M´exico, in: Satellite image atlas of
glaciers of the world, edited by: Williams, R. S., Ferrigno, J. G., US Geological Survey, Professional Paper 1386-J-3, 383–405, 2002.
Zemp, M., Haeberli, W., Bajracharya, S., Chinn, T. J., Fountain, A. G., Hagen, J. O., Huggel, C., K¨a¨ab, A., Kaltenborn, B. P., Karki, M., Kaser, G., Kotlyakov, V. M., Lambrechts, C., Li, Z., Molnia, B. F., Mool, P., Nellemann, C., Novikov, V., Osipova, G. B., Rivera, A., Shrestha, B., Svoboda, F., Tsvetkov, D. G., and Yao, T.: Glaciers and ice caps, in: Global outlook for ice and snow, edited by: UNEP, 115-152, 2007.