HAL Id: hal-00299277
https://hal.archives-ouvertes.fr/hal-00299277
Submitted on 28 Sep 2005
HAL is a multi-disciplinary open access
archive for the deposit and dissemination of
sci-entific research documents, whether they are
pub-lished or not. The documents may come from
teaching and research institutions in France or
abroad, or from public or private research centers.
L’archive ouverte pluridisciplinaire HAL, est
destinée au dépôt et à la diffusion de documents
scientifiques de niveau recherche, publiés ou non,
émanant des établissements d’enseignement et de
recherche français ou étrangers, des laboratoires
publics ou privés.
A possible preseismic anomaly in the ground wave of a
radio broadcasting (216 kHz) during July-August 1998
(Italy)
P. F. Biagi, L. Castellana, T. Maggipinto, R. Piccolo, A. Minafra, A. Ermini,
S. Martellucci, C. Bellecci, G. Perna, V. Capozzi, et al.
To cite this version:
P. F. Biagi, L. Castellana, T. Maggipinto, R. Piccolo, A. Minafra, et al.. A possible preseismic anomaly
in the ground wave of a radio broadcasting (216 kHz) during July-August 1998 (Italy). Natural
Hazards and Earth System Science, Copernicus Publications on behalf of the European Geosciences
Union, 2005, 5 (5), pp.727-732. �hal-00299277�
SRef-ID: 1684-9981/nhess/2005-5-727 European Geosciences Union
© 2005 Author(s). This work is licensed under a Creative Commons License.
and Earth
System Sciences
A possible preseismic anomaly in the ground wave of a radio
broadcasting (216 kHz) during July–August 1998 (Italy)
P. F. Biagi1,2, L. Castellana1, T. Maggipinto1, R. Piccolo1, A. Minafra1, A. Ermini3, S. Martellucci3, C. Bellecci3, G. Perna4, V. Capozzi4, O. A. Molchanov5, and M. Hayakawa6
1Department of Physics, University of Bari, Via Amendola, 173, 70126 Bari, Italy
2Inter-Department Centre for the Evaluation and Mitigation of the Volcanic and Seismic Risk, Univ. of Bari, 70126 Bari, Italy 3Department of Engineering of Enterprise, University of Roma Tor Vergata, Via di Tor Vergata, 00133 Rome, Italy
4Department of Biomedical Sciences, University of Foggia, Via L. Pinto, 71100 Foggia, Italy
5United Institute of the Earth’s Physics, Russian Academy of Science, Bolshaya Gruzinskaya 10, 123995 Moscow, Russia 6Department of Electronic Engineering, The University of Electro-Communications, 1-5-1 Chofugaoka, Chofu City, Tokyo
182-8585, Japan
Received: 19 May 2005 – Revised: 14 September 2005 – Accepted: 14 September 2005 – Published: 28 September 2005 Part of Special Issue “Seismic hazard evaluation, precursory phenomena and seismo electromagnetics”
Abstract. On February 1996, a receiver able to measure the
electric field strength of LF radio broadcastings, with a sam-pling frequency of ten minutes, was put into operation in a site (AS) located in central Italy. One of the broadcasting stations selected is MCO (f =216 kHz), located in southeast France, 518 km far from the receiver. The MCO data col-lected since February 1996 up to September 2004 were ex-amined and, at first, the night time data and the day time data (in winter and summer) were separated. Then, the wavelet analysis on the night and day time data was applied. The main result of the analysis was the appearance of a very clear anomaly during summer (July–August) 1998, at day time and at night time. The anomaly is a strong exaltation of the signal components with period in the 25–40 days range. Theoretical calculations of electric field strength were made and the only way to justify this anomaly seems to be the occurrence of an increase of the ground wave propagation mode of the radio signal. Such an increase could have been produced by an increase of the ground conductivity and by modifications of some parameter of the troposphere, mainly the refractive in-dex. On 15 August 1998 a seismic sequence started with 17 earthquakes (M=2.2–4.6) on the Reatini mountains, a seis-mogenic zone located 30 km far from the AS receiver along the path MCO-AS. In this paper, the possibility that the pre-vious radio anomaly can be a precursor of this seismic se-quence is proposed.
Correspondence to: P. F. Biagi
1 Introduction
For many years, research into the interaction between seis-mic activity and disturbances in radiobroadcasts has been carried out. Recently, pre-seismic disturbances in the Omega and Loran radio waves, that lie in the VLF (3–30 kHz) frequency band, have been presented (Gokhberg et al., 1989; Hayakawa and Sato, 1994; Morgounov et al., 1994; Hayakawa et al., 1996; Molchanov and Hayakawa, 1998). These radio signals are used for worldwide navigation sup-port and propagate in an earth-ionosphere wave-guide mode along great circle propagation paths. The analysis is based on the amplitude and the phase variations of the radio signals propagating from different transmitting stations. The anoma-lous variations detected several days before strong earth-quakes have been explained by disturbances in the lower ionosphere produced during the preparatory phase of strong earthquakes.
Since 1996, the electric field strength of LF (150–300 kHz) broadcasting stations is sampled by receivers located in cen-tral Italy. Some decreasing of the electric field strength of the radio signals was revealed and it has been explained by defo-cusing in the troposphere caused by the preparation of mod-erate (M=3.0–3.5) earthquakes located nearby the receivers (Bella et al., 1998; Biagi et al., 2001a, b). Then, a signifi-cant increase (6–8 dB) in the electric field of a radio signal (f =270 kHz) was observed and it was proposed as a pre-cursor of a strong seismic sequence (M=5.1–6.0) occurred over 400 km far from a receiver but in the middle of the
728 P. F. Biagi et al.: Preseismic anomaly in a ground wave (2416 kHz) radio signal
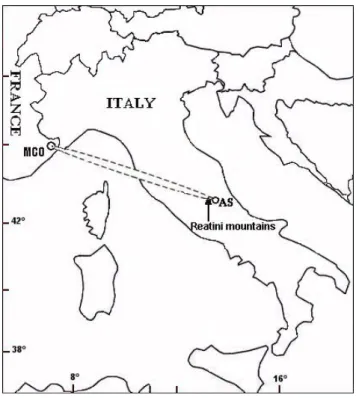
Fig. 1. Map showing the location of the receiver AS and of the MCO transmitter. The first Fresnel zone is indicated by a dotted line. The location of the Reatini mountains seismogenetic area is shown too.
transmitter-receiver path (Biagi and Hayakawa, 2002; Biagi et al., 2003). The increase was explained by the occurrence of some disturbances in the ionosphere during the prepara-tory phase of the seismic sequence.
Here, we present the result of a detailed analysis applied on the electric field strength data of a radio signal recorded by a receiver from February 1996 up to September 2004. The broadcasting station, named MCO, is located in southeast France and it transmits a LF (f =216 kHz) radio signal with a radiated power of 1400 kW. The receiver, named AS, is into operation at the mouth of a natural cave located in central Italy on the southern slope of the Gran Sasso chain, 518 km far from the transmitter. The receiver samples the electric field strength (instrumental zero equal to 0.2 mV/m) each ten minutes and it is detailed in Bella et al. (1998). Figure 1 shows the location of the transmitter and of the receiver.
2 Theoretical computations and data analysis
The LF signals are characterised by the ground-wave and the sky-wave propagation modes. The ground-wave, for dis-tances lesser than 500–1000 km, provides a stable signal that can be a significant one. On the contrary, the sky-wave is greatly variable between day and night and, at day time, between winter and summer. At first, by considering the MCO radio signal we calculated the theoretical electric field strength of the ground-wave propagating over a curved earth with a troposphere whose refractive index varies according
Table 1. Experimental (Exp) and theoretical (Theo) values of the electric field strength (mV/m) for the MCO (216 kHz) radio signal at AS receiver.
ELECTRIC FIELD SKY WAVE
STRENGTH
(Exp. values) (Theo. values)
Day time
winter summer winter summer
0.79 0.52 0.50 0.02
Night time
3.65 3.10
GROUND WAVE ( Theo. value) 0.54
to an exponential way with the height (Rotheram, 1981a, b). Then, for the same signal we calculated the theoretical elec-tric field strength of the sky-wave at night time and at day time during winter and summer, using the wave hop approach (Knight, 1973; CCIR, 1990a). According to the wave hop propagation theory, the sky-wave signal received by an an-tenna can be considered as a ray starting from the transmitter and reflected one or more times (hops) by the lower iono-sphere and by the ground. The distance MCO-AS is con-sistent with only one hop, where the reflection point of the lower ionosphere is located in the middle of the radio path. All the previous theoretical values are reported in Table 1.
Then we analysed the MCO electric field strength data (ten minutes sampling time). At first, we separated the day time data and the night time ones. In order to obtain at first data sets always related to the day time and to night time, regard-less the seasons, and then each set with the same number of data per day, we selected the range from 09:00 a.m. to 02:00 p.m. (local solar time) for the day time and the range from 09:00 p.m. to 12:00 p.m. (local solar time) for the night time. This last choice is resulted, in addition to the previous conditions, from the fact that the MCO broadcasting station interrupts the transmissions for 3–4 h after midnight. Then, in the day time data we separated the data collected in winter (21 December–21 March) from the data collected in sum-mer (21 June–21 September). Figure 2 shows the night time, day time, winter day time and summer day time trends of the MCO electric field strength from February 1996 up to September 2004. We calculated the mean value of each data set and these values, represented by horizontal dashed lines in the Fig. 2, are reported in Table 1.
Then, since the statistical characteristics of the signal un-der analysis change in time, the wavelet transform on the night time data and on the day time data at winter and at sum-mer, was applied (Torrence and Compo, 1998). In this way it has been possible to highlight the spectral components of the signal by using variable-width time windows, by considering that the frequency content of these windows is in inverse re-lation to the time widths. This allows the localization of the
0 , 3 1 , 0 1 , 7 s u m 9 6 s u m 9 7 s u m 9 8 s u m 9 9 s u m 0 0 s u m 0 1 s u m 0 2 s u m 0 3 s u m 0 4 1 9 9 6 1 9 9 7 1 9 9 8 1 9 9 9 2 0 0 0 2 0 0 1 2 0 0 2 2 0 0 3 2 0 0 4 s u m m e r d a y t i m e 1 9 9 6 1 9 9 7 1 9 9 8 1 9 9 9 2 0 0 0 2 0 0 1 2 0 0 2 2 0 0 3 2 0 0 4 d a y t i m e 0 , 3 1 , 0 1 , 7 2 , 4 3 , 1 e le c tr ic f ie ld s tr e n g th ( m V /m ) w i n t e r d a y t i m e n i g h t t i m e M C O 0 , 3 1 , 0 1 , 7 2 , 4 3 , 1 0 9 1 8 2 7 w i n9 6 / 9 7 w i n 9 7 / 9 8 w i n 9 8 / 9 9 w i n 9 9 / 0 0 w i n 0 0 / 0 1 w i n 0 1 / 0 2 w i n 0 2 / 0 3 w i n 0 3 / 0 4
Fig. 2. From the top reading downwards, the MCO electric field strength at night time (09:00–12:00 p.m., local solar time), at day time (09:00 a.m.–02:00 p.m., local solar time), at winter day time and at summer day time, from February 1996 to September 2004. The dashed horizontal lines represent the mean values (Table 1) of the relative data set.
signal in both time and frequency simultaneously. A picture, the spectrogram, showing both the amplitude of the signal versus the wavelet scale and the dependence between am-plitude and time can be drawn. (Daubechies, 1992; Strang and Nguyen, 1996). In our analysis we have considered the “Morlet function” as wavelet function (Torrence and Compo, 1998), and we have plotted in the Fig. 3 the wavelet power spectrum normalized with respect to the power of the white noise. The main result is the appearance of a very clear anomaly during summer (July–August) 1998, at day time and at night time. The anomaly is a strong exaltation of the signal components with period in the 25–40 days range.
3 Discussion
By considering the results reported in Table 1 and by tak-ing into account that our receiver has an instrumental zero equal to 0.20 mV/m, the following statements can be made: 1) the sky-wave at night and at winter day time has values which can be recorded by the AS receiver; on the contrary at summer day time it cannot be recorded by the receiver; 2) the ground-wave is recorded by the AS receiver; 3) at night time and at winter day time the ground-wave is superimposed to the sky-wave; at summer day time practically it represents the recorded signal. The radio anomaly we revealed is related to an increase of the electric field strength during summer; so, taking into account that the anomaly appears not only at night time but also at day time, from the previous state-ments the sky-wave cannot be involved. On the contrary, these statements suggest the possibility that the anomaly is related to an increase of the ground-wave propagation mode. The anomaly revealed by the wavelet analysis can be inves-tigated clearly on the day time data. Looking at the trend at
Time
Period (day)
Jan 96 Jan 97 Jan 98 Jan 99 Jan 00 Jan 01 Jan 02 Jan 03 Jan 04 16 32 64 50 100 150 200 250 (a) Time Period (day)
Jan 96 Jan 97 Jan 98 Jan 99 Jan 00 Jan 01 Jan 02 Jan 03 Jan 04 16 32 64 100 200 300 400 500 600 (b) Time Period (day)
SUM 96 SUM 97 SUM 98 SUM 99 SUM 00 SUM 01 SUM 02 SUM 03 SUM 04 16
32
64
200 400 600 800 1000 1200 1400 1600
(c)
Fig. 3. Normalized wavelet power spectrum from February 1996 to September 2004 of the MCO electric field strength in the range 16–64 days at: (a) night time, (b) day time, (c) summer day time. The left axis is the Fourier period (in day), the bottom axis is time. For each panel wavelet power level (arbitrary scale) is represented with a colour scale from dark blue to dark red.
the bottom of the Fig. 3, it is evident that the quoted anomaly is related to the appearance of the large signals during the middle summer 1998. These anomalous signals are charac-terised mainly by values of 0.8 mV/m, with some spikes up to 1 mV/m. The theoretical electric field strength of the MCO ground wave at the AS receiver is 0.54 mV/m (Table 1). The experimental mean value (summer day time) from 1996 to 2004 is in good agreement with the theory (Table 1). If the ground-wave electric field strength would undergo a 50% increase or so on, the anomalous signals responsible of the anomaly under study could be justified. Several parameters as the scale height of the troposphere, its refractive index, the relative permittivity and the conductivity of the ground, con-trol the ground-wave propagation of a radio signal. The most influent ones are the ground conductivity and the refractive index of the troposphere. If the value of one or both the pre-vious parameters increases in some zone or at all along the radio path then, as a result, the electric field strength of the ground-wave increases. The conductivity of the ground is strongly affected by the water content. In many cases a small increase in the percentage of water steps up the conductiv-ity enormously (Telford et al., 2002). The refractive index of the troposphere varies primarily with height, as previously mentioned. An important parameter to take into account is the value of the refractive index at the surface of the ground (CCIR, 1990b). Such a value is affected by the chemical
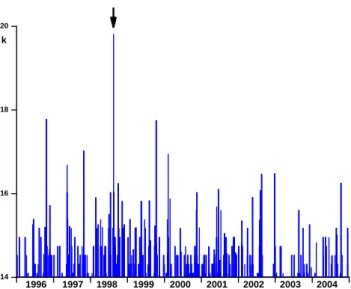
730 P. F. Biagi et al.: Preseismic anomaly in a ground wave (2416 kHz) radio signal 1 4 1 6 1 8 2 0 1 9 9 6 1 9 9 7 1 9 9 8 1 9 9 9 2 0 0 0 2 0 0 1 2 0 0 2 2 0 0 3 2 0 0 4 k
Fig. 4. Temporal trend of the k (energy (erg)=10k) values of the
earthquakes occurred in the Reatini mountains seismogenetic area. The arrow represents the occurrence of the 15 August 1998 seismic sequence.
composition of the air and it changes when variations, also small ones, in this composition happen.
In order to justify the radio anomaly described in the pre-vious session, at first, we checked the meteorological con-ditions and the rainfall in the area of the radio path. The data of the meteorological stations located along radio path in Italy and in France were checked and we did not discover any anomalous situation during July–August 1998.
On the contrary, from the Seismic Bulletins of the INGV (National Institute of Geophysics and Volcanology) it results that on 15 August 1998, i.e. practically at the end of the ra-dio anomaly, a seismic sequence started with 17 earthquakes (M=2.2–4.6), in a zone located 30 km far from the AS re-ceiver exactly along the MCO-AS path. The seismic se-quence lasted for about one week and it was the most large seismic activity occurred in Italy from July to September 1998. The sequence is set in the seismic activity of the Rea-tini mountains seismogenetic area. This area, located in the central Apennines (Fig. 1), is approximately a rectangle, with a diagonal 40 km long in the northeast direction.
The possibility that the previous radio anomaly was a pre-cursor of this seismic sequence can be considered and we have investigated this possibility.
At first we calculated the first Fresnel zone of the MCO radio signal related to the AS receiver. This zone is the area delimited by the dashed ellipse reported in the Fig. 1. The Fresnel zones are considered the sensitive zones to the seismo-atmospheric effects and, as it concerns earthquakes with magnitude up to 5.0, the first zone is generally con-sidered (Hayakawa et al., 1996; Molchanov and Hayakawa, 1998; Molchanov et al., 1998; Rozhnoi et al., 2004). Re-cently, it was proposed to reach up to the fifth Fresnel zone, but it could be possible for earthquakes like 2004 Sumatra one with M=9.0 (Horie et al., 2005). We checked the
loca-tion of the epicentres of the August 1998 seismic sequence and we found that they are located inside the first Fresnel zone (Fig. 1).
Then, we extracted, from the Seismic Bulletins of the INGV, the earthquakes occurred in the Reatini mountains seismogenetic area from 1996 to 2004. For each earthquake, we calculated the k value (energy (erg)=10k) from the mag-nitude M, using the relationship (Kanamori and Anderson, 1975):
k =11.8 + 1.5M . (1)
The trend of the k values in the period 1996–2004 is reported in Fig. 4. In the days in which more than one earthquake occurred, the energies were added and the total k value was derived. From Fig. 4, a clear spike stands up on the occasion of the 15 August 1998 seismic sequence.
Finally, we extracted, from the Seismic Bulletins of the INGV, the earthquakes occurred in the first Fresnel zone of Fig. 1 from 1996 to 2004. It must be noted that the seis-mic activity of the French part of this zone is included in the previous Bulletins. The trend of the k values in the period 1996–2004 continues to reveal the previous spike on 15 Au-gust 1998.
All these statements considered, the connection between the radio anomaly under study and the August 1998 seismic sequence in the Reatini mountains is reasonable and the fol-lowing interpretation of the radio anomaly as a precursor can be proposed: a) during the preparatory phase of these earth-quakes, an increase of the underground waters in the surface layers of a zone around the epicentres happened, producing a consequent increase of the local surface ground conductiv-ity; b) at the same time, emissions of gases, particles and so on happened in this zone and, as a consequence, variations in some of the parameters of the troposphere, mainly an in-crease of the refractive index at the surface, occurred. It must be noted that variations in the level of the underground wa-ter as well as emission of gases and particles have been ob-served from long time before the occurrence of earthquakes (Heinicke et al., 1995; King, 1984/1985; King et al., 1995; Kovach et al., 1975; Ouzounov and Freund, 2004; Roeloffs, 1988; Roeloffs and Quilty, 1997; Steinitz et al., 2003; Wakita et al., 1988).
The previous increases of the ground conductivity and of the surface refractive index produced an anomalous zone along the MCO-AS path able to increase the electric field strength of the ground-wave at the AS receiver. As an exam-ple, we have tried a quantitative estimation. For the eval-uation of the MCO theoretical ground-wave electric field strength at the AS receiver we used the values of the ground conductivity reported on the world Atlas of ground conduc-tivities (CCIR, 1990c). In particular for the MCO-AS path in Italy, 250 km long (Fig. 1), we assumed the ground conduc-tivity equal to 1 mS/m. For the refractive index of the tropo-sphere at the surface of the earth we used the standard value 1.000315 (Rotheram, 1981b). Now, we have repeated the evaluation of the MCO ground-wave electric field strength introducing, in corrispondence with the Reatini mountains
area, a radio path (40 km long) with a ground conductivity equal to 10 mS/m and a refractive index of the troposphere at the surface of the earth equal to 1.000600. In such a way, we have obtained for the ground-wave electric field strength at the AS receiver the value 0.80 mV/m, i.e. an increase of about 50% respect the previous value. This increase is repre-sentative of the radio anomaly under study.
4 Conclusions
From this study we can infer that the LF (200–300 kHz) radio signals recorded as far as 500–1000 km from the transmitter, contain information related to the ground-wave. In partic-ular, anomalies appearing on this wave could be related to variations in some parameters of the ground and of the tro-posphere which control the ground wave propagation mode. Such variations can be produced by the processes which take place during the preparatory phase of earthquakes occurring inside the first Fresnel zone of these radio signals.
Acknowledgements. This research was conducted in the framework
of: a) the Cooperation Agreement between the University of Bari (Italy) and the Institute of the Earth’s Physics, Russian Academy of Sciences; b) the Cooperative Program 12B1 of the Italian Ministry of the Foreign Affair between Italy and Japan.
Edited by: S. Tinti
Reviewed by: three referees
References
Bella, F., Biagi, P. F., Caputo, M., Cozzi, E., Della Monica, G., Er-mini, A., Plastino, W., and Sgrigna, V.: Field strength variations of LF radio waves prior to earthquakes in Central Italy, Phys. Earth Planet. Int., 105, 279–286, 1998.
Biagi, P. F., Piccolo, R., Ermini, A., Martellucci, S., Bellecci, C., Hayakawa, M., Capozzi, V., and Kingsley, S. P.: Possible earth-quake precursors revealed by LF radio signals, Nat. Hazards Earth Syst. Sci., 1, 99–104, 2001a,
SRef-ID: 1684-9981/nhess/2001-1-99.
Biagi, P. F., Piccolo, R., Ermini, A., Martellucci, S., Bellecci, C., Hayakawa, M., and Kingsley, S. P.: Disturbances in LF radio-signals as seismic precursors, Annali di Geofisica, 44, 5/6, 2001b.
Biagi, P. F. and Hayakawa, M.: Possible premonitory behaviour of LF radiowaves on the occasion of the Slovenia earth-quakes (M=5.2–6.0–5.1) occurred on March–May 1998, in: Seismo Electromagnetics: Lithosphere-Atmosphere-Ionosphere Coupling, edited by: Hayakawa, M. and Molchanov, O., TER-RAPUB, Tokyo, 249–253, 2002.
Biagi, P. F., Piccolo, R., Capozzi, V., Ermini, A., Martellucci, S., and Bellecci, C.: Exalting in atmospheric tides as earthquake precursor, Nat. Hazards Earth Syst. Sci., 3, 197–201, 2003, SRef-ID: 1684-9981/nhess/2003-3-197.
CCIR: Sky-wave propagation and circuit performance at frequen-cies between about 30 kHz and 500 kHz, Rep. 265-7, 212–229, 1990a.
CCIR: Radiometeorological data, Rep. 563-4, 105–148, 1990b.
CCIR: World Atlas of Ground Conductivities, Rep. 717-3, 95–105, 1990c.
Daubechies, I.: Ten lectures on wavelets, CBMS – NSF Regional Conferences Series in Applied Mathematics SIAM, Philadelphia PA, 61, 1992.
Gokhberg, M. B., Gufeld, I. L., and Liperovsky, V. L.: Modern in-vestigations of the electromagnetic prediction of the earthquakes, in: Discrete Properties of Geophysical Medium (in Russian), Nauka Moscow, p. 92, 1989.
Hayakawa, M. and Sato, H.: Ionospheric perturbations associated with earthquakes as detected by subionospheric VLF propaga-tion, in: Electromagnetic Phenomena Related to Earthquake Pre-diction, edited by: Hayakawa, M. and Fujinawa, Y., TERRA-PUB, Tokyo, 391–397, 1994.
Hayakawa, M., Molchanov, O. A., Ondoh, T., and Kawai, E.: The precursory signature effect of the Kobe earthquake on VLF subionospheric signals, J. Comm. Res. Lab., 169–180, 1996.
Heinicke, J., Koch, U., and Martinelli, G.: CO2and Radon
mea-surements in the Vogtland area (Germany) – a contribution to earthquake prediction research, Geophys. Res. Lett., 22, 771– 774, 1995.
Horie, T., Maekawa, S., Yamauchi, T., and Hayakawa, M.: A pos-sible effect of ionospheric perturbations for the Sumatra earth-quake as revealed from subionospheric VLF propagation (NWC-Japan), Int. J. Rem. Sens., in press, 2005.
Kanamori, H. and Anderson, D.: Theoretical basis of some empir-ical relations in seismology, Bull. Seismol. Soc. Am., 65, 1073– 1095, 1975.
King, C.-Y. (ed.): Earthquake hydrology and chemistry, Special Is-sue, Pure Appl. Geophys., 122, 141–618, 1984/1985.
King, C.-Y., Koizumi, N., and Kitagawa, Y.: Hydrogeochemical anomalies and the 1995 Kobe earthquake, Science, 269, 38–39, 1995.
Knight, P.: MF propagation: a wave-hop method for ionospheric field-strength prediction, BBC Eng., 10, 22–34, 1973.
Kovach, R. L., Nur, A., Wesson, R. L., and Robinson, R.: Water-level fluctuations and earthquakes on the San Andreas fault zone, Geology, 3, 437–440, 1975.
Molchanov, O. A. and Hayakawa, M.: Subionospheric VLF signal perturbations possibly related to earthquakes, J. Geophys. Res., 103, 17 489–17 504, 1998.
Molchanov, O. A., Hayakawa, M., Ondoh, T., and Kawai, E.: Pre-cursory effects in the subionospheric VLF signals for the Kobe Earthquake, Phys. Chem. Earth., 29, 589–598, 2004.
Morgounov, V. A., Ondoh, T., and Nagai, S.: Anomalous variation of VLF signals associated with strong earthquakes (M≥7.0), in: Electromagnetic Phenomena Related to Earthquake Prediction, edited by: Hayakawa, M. and Fujinawa, Y., TERRAPUB, Tokyo, 409–428, 1994.
Ouzounov, D. and Freund, F.: Mid-infrared emission prior to strong earthquakes analysed by remote sensing data, Adv. Space Res., 33, 268–273, 2004.
Roeloffs, E. A.: Hydrologic precursors to earthquakes: A review, Pure App. Geophys., 126, 177–209, 1988.
Roeloffs, E. A. and Quilty, E.: Case 21 – water-level and strain changes preceding and following the August 4, 1985 Kettleman Hills, California, earthquake, Pure Appl. Geophys., 149, 21–60, 1997.
Rotehram, S.: Ground wave propagation, Part 1:Theory for short distances, IEE Proc. F. Commun. Radar & Signal Process, 128, 275–284, 1981a.
732 P. F. Biagi et al.: Preseismic anomaly in a ground wave (2416 kHz) radio signal
Rotehram, S.: Ground wave propagation, Part 2: Theory for medium and long distances and reference propagation curves, IEE Proc. F. Commun. Radar & Signal Process, 128, 285–295, 1981b.
Rozhnoi, A. A., Solovieva, M. S., Molchanov, O. A., and Hayakawa, M.: Middle latitude LF (40 kHz) phase variations associated with earthquakes for quiet and disturbed geomagnetic conditions, Phys. Chem. Earth, 29, 6589–598, 2004.
Steinitz, G., Begin, and Gazit-Yaari, N.: A statistically significant relation between Rn flux and waek earthquakes in the Dead Sea rift valley, Geology, 31, 505–508, 2003.
Strang G. and Nguye, T.: Wavelets and filter banks, Wellesley Cam-bridge Press, 490 pp., 1996.
Telford, W. M., Geldart, L. P., and Sheriff, R. E.: Electric Proper-ties of Rocks and Minerals, in: Applied Geophysics, Cambridge University Press, New York, 283–292, 2002.
Torrence, C. and Compo, G. P.: A practical Guide to Wavelet Anal-ysis, Bull. Amer. Meteor. Soc., 79, 1, 61–78, 1998.
Wakita, H., Nakamura, Y., and Sano, Y.: Short-term and
intermediate-term geochemical precursors, Pure Appl. Geophys., 126, 267–278, 1988.